
Rest of World Wearable Technology Market (2026-2031)

The Rest of World Wearable Technology Market was valued at $6569.5 Million in 2026 and projected to reach to $42601.8 Million by 2031, representing a compound annual growth rate of CAGR 36.6%. The Rest of World AR wearables segment is poised for transformative growth through 2031, driven by increasing smartphone penetration, rising disposable incomes, and growing consumer interest in immersive technologies across emerging markets.


| Market Size in | USD 26.32 MN |
| Market Forecast in | |
| CAGR | |
| Forecast Period | |
| Units Considered | Value (USD MN) |
Rest of World Wearable Technology Market Trends and Insights
- Ar represents one of the fastest-growing product categories in wearables, driven by advancing display technologies, improved battery efficiency, and increasing consumer adoption of immersive experiences.
- The Ar segment's 36.6% compound annual growth rate significantly outpaces the global wearable market's 14.7% CAGR, reflecting strong demand for augmented reality-enabled devices across consumer, enterprise, and industrial applications. Ar wearables are transforming how users interact with digital content in real-world environments, spanning smart glasses, head-mounted displays, and integrated AR solutions.
- Between 2026 and 2031, Ar is expected to capture an increasingly larger share of the wearable technology market as manufacturers invest in miniaturization, processing power, and software ecosystems.
- The Ar segment's trajectory demonstrates the market's shift toward more sophisticated, feature-rich wearable devices that blend digital and physical realities..
Key Market Statistics
- CAGR (2026-2031) CAGR 36.6%
- Market Size, 2026 ~USD 6569.5 Million
- Forecast, 2031 ~USD 42601.8 Million
- Geography Rest of World
Rest of World Wearable Technology Market Overview
Exceptional Growth Trajectory :
Rest of World AR wearables market is expanding at 36.6% CAGR, significantly outpacing the global average of 14.7%, driven by emerging market adoption and localized innovation ecosystems.
Rapid Market Expansion :
Market valuation is projected to surge from $6,569.5 million in 2026 to $42,601.8 million by 2031, representing a 548% increase over five years in Rest of World regions.
Emerging Market Leadership :
Rest of Asia Pacific, GCC Countries, and Africa collectively represent substantial growth opportunities, with Rest of Asia Pacific alone valued at $61.6 billion, positioning these regions as key growth drivers.
Technology Adoption Acceleration :
Advancing display technologies and improved battery efficiency are enabling mass-market penetration in Rest of World markets, particularly in developing economies seeking immersive consumer experiences.
Rest of World Wearable Technology Market Dynamics
- Regional players are investing heavily in localized AR applications for healthcare, education, and enterprise solutions, creating unique market dynamics distinct from developed regions. Key growth catalysts include government digital transformation initiatives, expanding 5G infrastructure, and declining hardware costs making AR wearables accessible to broader populations.
- Rest of World markets are expected to become innovation hubs for affordable AR solutions, attracting global manufacturers and creating competitive advantages through region-specific customization and localized content ecosystems..
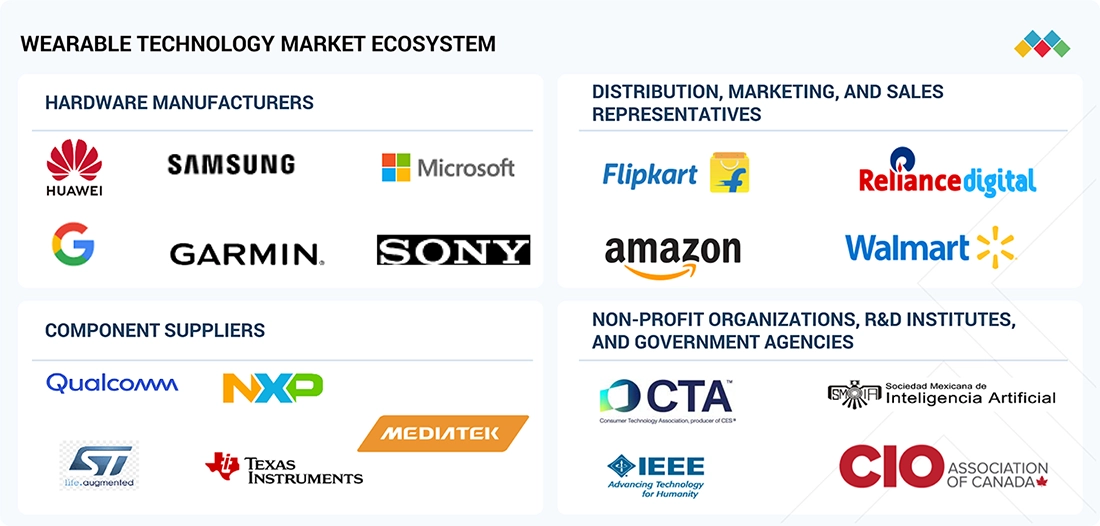
Market Ecosystem
WEARABLE TECHNOLOGY MARKET SIZE, SHARE & TRENDS: COMMERCIAL USE CASES ACROSS INDUSTRIES
| COMPANY | USE CASE DESCRIPTION | BENEFITS |
|---|---|---|
 |
Provides AI-enabled smartwatches and earwear for consumer health monitoring, fitness tracking, communication, and wellness management; Devices support ECG monitoring, activity tracking, sleep analysis, and seamless integration with connected digital ecosystems | Enhances preventive healthcare | Improves user engagement | Enables real-time health insights | Supports continuous wellness monitoring through advanced sensors and AI-driven analytics |
 |
Delivers smartwatches, smart rings, and earwear solutions for consumer electronics, healthcare, and fitness applications; Devices integrate health monitoring capabilities, AI-powered features, and connectivity across smartphones and cloud platforms | Improves health tracking accuracy | Strengthens connected experiences | Increases user convenience | Enables personalized recommendations through integrated wearable ecosystems |
 |
Offers cost-effective smartwatches, fitness trackers, and earwear designed for large-scale consumer adoption; Solutions focus on activity tracking, health monitoring, and connected lifestyle management across emerging and developed markets | Expands accessibility to wearable technology | Supports fitness and wellness objectives | Enhances user connectivity | Delivers value-driven wearable experiences |
 |
Develops smartwatches, fitness trackers, earwear, and smart glasses with advanced health monitoring and AI-enabled capabilities; Devices are utilized across consumer wellness, fitness, and productivity applications | Enables comprehensive health monitoring | Improves device intelligence | Supports seamless connectivity | Enhances user experiences through integrated hardware and software platforms |
 |
Provides advanced smartwatches and wearable devices for sports, fitness, outdoor recreation, aviation, and marine applications; Solutions incorporate GPS technologies, biometric monitoring, and performance analytics for professional and recreational users | Delivers accurate performance tracking | Improves athletic training outcomes | Supports navigation and safety applications | Enables data-driven decision-making across specialized use cases |
Logos and trademarks shown above are the property of their respective owners. Their use here is for informational and illustrative purposes only.
Related Ecosystem
Aviation
- Narrow Body Aircraft
- Wide Body Aircraft
- Military Helicopters
- Special Mission Aircraft
- Fighter Aircraft
- HONEYWELL INTERNATIONAL INC.
- COLLINS AEROSPACE
- Thales group
- Safran group
- HEICO Corporation
Industrial Iot
- Sensors
- Pressure Sensors
- Flow Sensors
- Gas Sensors
- Image Sensors
- Siemens ag
- ABB India Limited
- HONEYWELL INTERNATIONAL INC.
- Emerson Electric Co.
- SCHNEIDER ELECTRIC SE
Sensors And Control
- Sensors
- Image Sensors
- Temperature Sensors
- Pressure Sensors
- Flow Sensors
- BAUMER ELECTRIC AG
- HONEYWELL INTERNATIONAL INC.
- Stmicroelectronics
- Lenovo
- Texas Instruments Incorporated
Key Takeaways
- Ar segment valued at $6,569.5M in 2026, expanding to $42,601.8M by 2031 with a 36.6% CAGR
- Ar growth rate of 36.6% significantly exceeds the global wearable market CAGR of 14.7%
- Ar wearables span consumer, enterprise, and industrial applications with increasing adoption
- Ar technology advancement in displays and processing power drives market expansion through 2031
Wearable Technology Market Report Scope
| Report Metric | Details |
|---|---|
| Base Year | 2026 |
| Fastest Growing Segment | EXOSKELETONS (Wristwear) |
| Forecast Period | 2026–2031 |
| Growth Rate | CAGR of 14.7% from 2026 to 2031 |
| Largest Segment | NORTH AMERICA (Application) |
| Market Size Base Year (Billions) | ~USD 105.59 (2026) |
| Revenue Forecast (Billions) | ~USD 209.62 (2031) |
| Segments Covered | Product, Product Type, Type, Operation, Ai-Based Operation, Operation Type, Wristwear, Application |
Rest of World Wearable Technology Market Report Segmentation
8 segment dimensions are covered across the global market.
By Product
- Earwear
- Earwears
- Exoskeletons
- Head-Mounted Displays
- Other Products
- Smart Clothing & Footwear
- Smart Glasses
- Smart Rings
- Wearable Cameras
- Wristwear
By Product Type
- Ar
- Augmented Reality
- Fitness Trackers
- Other Head-Mounted Displays
- Smartwatches
- Virtual Reality
- Vr
By Type
- Cloud-Based AI
- Fitness Trackers
- Non-Textile Wearables
- On-Device AI
- Smartwatches
- Wearable Products (Non-Textiles)
- Wearable Smart Textiles
By Operation
- AI-Based
- Conventional
By Ai-Based Operation
- Cloud-Based AI
- On-Device AI
By Operation Type
- Cloud-Based AI
- On-Device AI
By Wristwear
- Fitness Trackers
- Smartwatches
By Application
- Consumer Electronics
- Enterprise & Industrial
- Healthcare
- Other Applications
Target Audience
- International AR Hardware Manufacturers : Require detailed Rest of World market sizing and growth forecasts to prioritize manufacturing expansion, distribution partnerships, and localized product development in high-growth emerging regions.
- Emerging Market Investors & PE Firms : Need comprehensive regional data to identify investment opportunities in Rest of World AR wearables startups, evaluate market potential, and assess competitive landscapes for portfolio companies.
- Technology & Telecom Service Providers : Seek market intelligence on Rest of World adoption rates and regional demand patterns to develop AR-enabled services, 5G integration strategies, and content ecosystems for emerging markets.
- Strategic Business Consultants : Utilize Rest of World market forecasts and regional insights to advise clients on market entry strategies, competitive positioning, and long-term growth opportunities in high-potential territories.
- Government & Policy Makers : Require market data to inform digital transformation initiatives, technology infrastructure investments, and regulatory frameworks supporting AR wearables adoption in Rest of World economies.
Key Companies in the Rest of World Wearable Technology Market
| Company | HQ | Ownership | Strongest segments |
|---|---|---|---|
| OBERTHUR TECHNOLOGIES | France | Private Company | Smartwatch,Fitness Tracker,Head-Mounted Display, |
| WISECHIP SEMICONDUCTOR INC. | Taiwan | Public Company | Smartwatch,Fitness Tracker,Smart Glass, |
| ASUSTEK COMPUTER INC | Taiwan | Public Company | Smartwatch,Fitness Tracker,Head-Mounted Display, |
| HCL TECHNOLOGIES LIMITED | India | Public Company | Smartwatch,Fitness Tracker,Head-Mounted Display, |
| JABIL | United States | Public Company | Smartwatch,Fitness Tracker,Head-Mounted Display, |
| LATTICE SEMICONDUCTOR | United States | Public Company | Smartwatch,Fitness Tracker,Head-Mounted Display, |
| T-MOBILE US, INC | United States | Public Company | Smartwatch,Fitness Tracker,Head-Mounted Display, |
| AT&S | Austria | Public Company | Smartwatch,Fitness Tracker,Head-Mounted Display, |
| DSP GROUP, INC. | United States | Private Company | Smartwatch,Fitness Tracker,Head-Mounted Display, |
| MINDTREE | India | Public Company | Smartwatch,Fitness Tracker,Head-Mounted Display, |
| AMS AG | United States | Public Company | Smartwatch,Fitness Tracker,Head-Mounted Display, |
| XIAOMI | China | Public Company | Smartwatch,Fitness Tracker,Smart Glass, |
| APPLE INC. | United States | Public Company | Smartwatch,Fitness Tracker,Head-Mounted Display, |
| SAMSUNG | South Korea | Public Company | Smartwatch,Fitness Tracker,Head-Mounted Display, |
| GARMIN LTD. | Switzerland | Public Company | Smartwatch,Fitness Tracker,Head-Mounted Display, |
| SONY GROUP CORPORATION | Japan | Public Company | Smartwatch,Fitness Tracker,Head-Mounted Display, |
| ALPHABET INC. | United States | Public Company | Smartwatch,Fitness Tracker,Head-Mounted Display, |
| LENOVO | China | Public Company | Smartwatch,Fitness Tracker,Head-Mounted Display, |
| META | United States | Public Company | Head-Mounted Display,Smart Glass,Smartwatch, |
| IMAGINE MARKETING LIMITED | India | Private Company | Smartwatch,Fitness Tracker,Smart Ring, |
| VUZIX | United States | Public Company | Smart Glass,Head-Mounted Display,Waveguides & Display Engines (OEM/ODM components), |
| COMAU | Italy | Private Company | Exoskeleton,Smart Vest,Smart Glass, |
OBERTHUR TECHNOLOGIES
Oberthur Technologies is a French private company founded in 2011 with 6,127 employees.
WISECHIP SEMICONDUCTOR INC.
Wisechip Semiconductor Inc. is a Taiwanese public company founded in 2005 with 298 employees.
ASUSTEK COMPUTER INC
Asustek Computer Inc. is a Taiwanese public company founded in 1989 specializing in computer hardware and electronics.
HCL TECHNOLOGIES LIMITED
HCL Technologies Limited is an Indian public company founded in 1976 providing IT services and solutions.
JABIL
Jabil is a United States-based public company founded in 1966 with 135,000 employees.
LATTICE SEMICONDUCTOR
Lattice Semiconductor is a United States-based public company founded in 1983 with 1,174 employees.
T-MOBILE US, INC
T-Mobile US, Inc. is a United States-based public company founded in 1994 with 75,000 employees.
AT&S
AT&S is an Austrian public company founded in 1978 with 7,000 employees.
DSP GROUP, INC.
DSP Group, Inc. is a United States-based private company founded in 1987 with 352 employees.
MINDTREE
Mindtree is an Indian public company founded in 1999 with 87,950 employees providing IT services.
AMS AG
AMS AG is a United States-based public company founded in 1987 with 20,605 employees.
XIAOMI
Xiaomi is a Chinese public company founded in 2010 with 55,994 employees.
APPLE INC.
Apple Inc. is a United States-based public company founded in 1976 with 166,000 employees.
SAMSUNG
Samsung is a South Korean public company founded in 1969 with 128,735 employees.
GARMIN LTD.
Garmin Ltd. is a Switzerland-based public company founded in 1989 with 23,000 employees.
SONY GROUP CORPORATION
Sony Group Corporation is a Japanese public company founded in 1946 with 94,900 employees.
ALPHABET INC.
Alphabet Inc. is a United States-based public company founded in 1998 with 194,668 employees.
LENOVO
Lenovo is a Chinese public company founded in 1984.
META
Meta is a United States-based public company founded in 2004 with 77,986 employees.
IMAGINE MARKETING LIMITED
Imagine Marketing Limited is an Indian private company founded in 2013 with 486 employees.
VUZIX
Vuzix is a United States-based public company founded in 1997 with 88 employees.
COMAU
Comau is an Italian private company founded in 1970 with 7,103 employees.
Countries within Rest of World - compare and drill down
| Country | 2025 size (native) |
|---|---|
| Rest Of Asia Pacific | USD 61613.1 Million |
| GCC Countries | USD 16788.7 Million |
| Rest Of Middle East | USD 50798.6 Million |
| Africa | USD 26095.3 Million |
| Rest Of Europe | USD 845.8 Million |
Country market size visualization
Reasons to Buy this Report
- Superior Growth Intelligence : Access exclusive data on Rest of World AR wearables expanding at 36.6% CAGR—2.5x faster than global average—enabling strategic market entry and expansion planning in high-growth regions.
- Regional Market Segmentation : Detailed breakdowns across Rest of Asia Pacific, GCC Countries, Africa, and Middle East provide granular insights for targeted investment decisions and localized go-to-market strategies.
- Competitive Positioning : Understand emerging market dynamics, local player strategies, and technology adoption patterns to identify competitive advantages and partnership opportunities in underserved regions.
- Investment Opportunity Mapping : Comprehensive forecasts through 2031 highlight high-potential markets and emerging consumer segments, enabling data-driven capital allocation and risk mitigation across Rest of World territories.
- Technology Trend Analysis : Track display technology advancement and battery efficiency improvements driving mass adoption in Rest of World markets, informing product development and supply chain optimization.
Frequently asked questions
What is the market size of Ar in the wearable technology segment?
Ar is valued at $6,569.5 million in 2026 and is forecast to reach $42,601.8 million by 2031.
What is the CAGR for Ar wearables?
Ar wearables are growing at a 36.6% compound annual growth rate from 2026 to 2031.
How does Ar growth compare to the overall wearable market?
Ar's 36.6% CAGR significantly outpaces the global wearable technology market's 14.7% CAGR.
What applications drive Ar wearable adoption?
Ar wearables are adopted across consumer, enterprise, and industrial sectors for immersive digital experiences and real-world interaction enhancement.
What technologies are advancing the Ar segment?
Improvements in display technologies, battery efficiency, miniaturization, and processing power are key drivers of Ar wearable market growth.
RESEARCH METHODOLOGY
The study involved four major activities in estimating the current size of the wearable technology market. Extensive secondary research was conducted to gather information on the market, adjacent markets, and the broader imaging system ecosystem. This was followed by primary research with industry stakeholders across the value chain, including manufacturers, distributors, technology providers, and end users, to validate assumptions and market sizing. Both top-down and bottom-up approaches were used to estimate the overall market size. Market breakdown and data triangulation techniques were then applied to derive the size of individual segments and sub-segments. Secondary and primary sources were jointly used to support a comprehensive technical and commercial analysis of the wearable technology market.
Secondary Research
Various secondary sources have been referred to in the secondary research process to identify and collect information crucial for this study. The secondary sources include annual reports, press releases, and investor presentations of companies; white papers; journals and certified publications; and articles from recognized authors, websites, directories, and databases. Secondary research has been conducted to obtain key information about the industry’s supply chain, the market’s value chain, the total pool of key players, market segmentation according to the industry trends (to the bottom-most level), regional markets, and key developments from market- and technology-oriented perspectives. The secondary data has been collected and analyzed to determine the overall market size, further validated by primary research.
Primary Research
Extensive primary research was conducted after gaining knowledge about the current scenario of the wearable technology market through secondary research. Several primary interviews were conducted with experts from the demand and supply sides across four major regions: North America, Europe, Asia Pacific, and RoW. This primary data was collected through questionnaires, emails, and telephonic interviews.
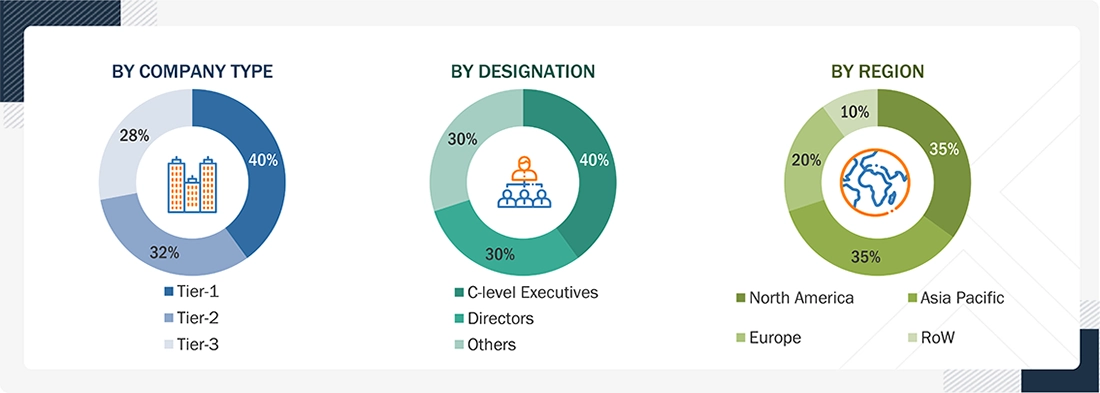
Note: The three tiers of the companies are defined based on their total revenue in 2023: Tier 1 - revenue greater than or equal to USD 1 billion; Tier 2 - revenue between USD 100 million and USD 1 billion; and Tier 3 revenue less than or equal to USD 100 million. Other designations include sales managers, marketing managers, and product managers.
To know about the assumptions considered for the study, download the pdf brochure
Market Size Estimation
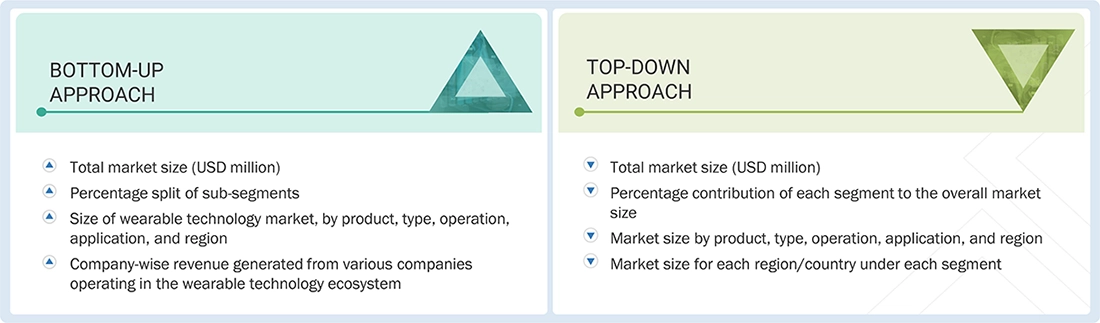
Both top-down and bottom-up approaches have been used to estimate and validate the total size of the wearable technology market. These methods have also been used extensively to estimate the size of various sub-segments in the market. The following research methodology has been used to estimate the market size:
- Major players in the industry and markets have been identified through extensive secondary research.
- The industry’s value chain and market size (in terms of value) have been determined through primary and secondary research processes.
- All percentage shares, splits, and breakdowns have been determined using secondary sources and verified through primary sources.
The market sizing includes the following:
Data Triangulation
After arriving at the overall size of the wearable technology market from the market size estimation process explained above, the total market has been split into several segments and sub-segments. Data triangulation and market breakdown procedures have been employed, wherever applicable, to complete the overall market engineering process and arrive at the exact statistics for all segments and sub-segments of the market. The data has been triangulated by studying various factors and trends from the demand and supply sides. Along with this, the market size has been validated using top-down and bottom-up approaches.
Market Definition
Wearable technology refers to electronic devices designed to be worn on the body, taking various forms, such as jewelry, accessories, medical devices, or clothing. While some wearables offer advanced features, such as AI-powered hearing aids, Google Glass, and Microsoft’s HoloLens, simpler versions include devices such as disposable skin patches with sensors that wirelessly transmit patient data in healthcare settings.
Key Stakeholders
- Wearable technology companies
- Artificial intelligence companies
- Wearable AI companies
- Key service providers
- Software solution providers
- Network providers
- Retail distributors
- Government, financial, and research institutions, and investment communities
- Analysts and strategic business planners
- Research and consulting firms
Report Objectives
- To describe and forecast the wearable technology market, by product, type, operation, and application, in terms of value
- To describe and forecast the wearable technology market, by product and operation, in terms of volume
- To describe and forecast the market for various segments with respect to four main regions, namely North America, Europe, Asia Pacific, and RoW, in terms of value
- To study different types of technology, connectivity, vertical, distribution channel, and component used in the wearable technology market, with the scope limited to qualitative research
- To provide detailed information regarding the major factors, such as drivers, restraints, opportunities, and challenges, influencing the growth of the wearable technology market
- To provide ecosystem analysis, trends/disruptions impacting customer business, technology analysis, pricing analysis, key stakeholders & buying criteria, case study analysis, trade analysis, patent analysis, key conferences & events, Gen AI/ AI impact, and regulations related to the wearable technology market
- To strategically analyze micromarkets with respect to individual growth trends, prospects, and contributions to the total market
- To analyze opportunities for stakeholders by identifying high-growth segments of the wearable technology market
- To benchmark players within the market using the proprietary company evaluation matrix framework, which analyzes market players on various parameters within the broad categories of market rank and product offering
- To strategically profile the key players and comprehensively analyze their market shares and core competencies, and provide a detailed competitive landscape for market leaders
- To analyze competitive developments, such as partnerships, collaborations, agreements, joint ventures, mergers & acquisitions, expansions, and product launches & developments, in the wearable technology market
Available customizations:
With the given market data, MarketsandMarkets offers customizations according to the company’s specific needs. The following customization options are available for the report:
Company Information:
- Detailed analysis and profiling of additional market players (up to 5)
Get the Full Wearable Technology Market Report
Full forecast, segment splits, and company analysis for all Wearable Technology Market.
- US Wearable Technology Market
- Canada Wearable Technology Market
- Mexico Wearable Technology Market
- Germany Wearable Technology Market
- UK Wearable Technology Market
- France Wearable Technology Market
- Italy Wearable Technology Market
- Rest Of Europe Wearable Technology Market
- China Wearable Technology Market
- Japan Wearable Technology Market
- India Wearable Technology Market
- South Korea Wearable Technology Market
- Rest Of Asia Pacific Wearable Technology Market
- GCC Countries Wearable Technology Market
- Rest Of Middle East Wearable Technology Market
- Africa Wearable Technology Market
Need a Tailored Report?
Customize this report to your needs
Get 10% FREE Customization
Customize This Report
