
Agriculture IoT Market Size, Share & Trends

Agriculture IoT Market Size, Share, Growth & Trends by Automation & Control Systems (Drones/UAVs, Guidance & Steering), Sensing & Monitoring Devices, Variable Rate Controllers, RFID Tags & Readers, LED Grow Lights, HVAC Systems, Irrigation Systems Global Forecast to 2030


AGRICULTURE MARKET SIZE, SHARE & TRENDS
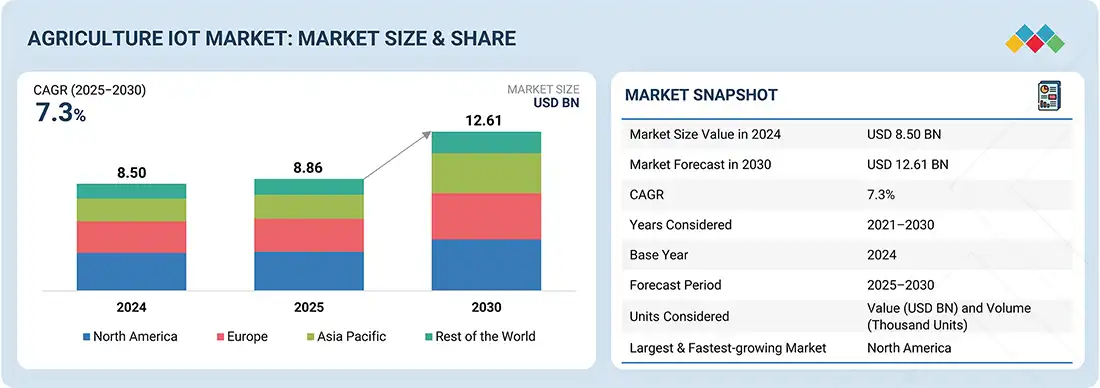
According to Marketsandmarkets, the global agriculture IoT market size was valued at USD 8.86 billion in 2025 and is projected to reach USD 12.61 billion by 2030, growing at a CAGR of 7.3% from 2025 to 2030. The growing demand for data-driven, resource-efficient farming solutions that enhance productivity and sustainability drives the market. Increasing focus on precision agriculture and advancements in IoT-enabled sensors, drones, and automated machinery accelerate adoption. Agriculture IoT solutions offer improved operational efficiency, optimized input usage, and better crop and livestock health management capabilities.
MARKET SNAPSHOT TABLE
| REPORT METRIC | DETAILS |
|---|---|
| Market Size Value in 2025 | USD 8.86 BN |
| Revenue Forecast in 2030 | USD 12.61 BN |
| Growth Rate | 7.3% |
| Years Considered | 2021–2030 |
| Base Year | 2024 |
| Forecast Period | 2025–2030 |
| Units Considered | Value (USD Billion) and Volume (Thousand Units) |
| Report Coverage | Revenue Forecast, Company Ranking, Competitive Landscape, Growth Factors, and Trends |
| Segments Covered | • By Hardware: Precision Farming Hardware, Precision Forestry Hardware, Livestock Monitoring Hardware, Precision Aquaculture Hardware, Smart Greenhouse Hardware, and Other Hardware • By Farm Size: Small, Medium, and Large • By Farm Production Planning: P |
| Regional Scope | North America, Europe, Asia Pacific, and RoW |
| Top Companies |
|
| Growth Drivers |
|
Market Size & Forecast
• 2025 Market Size: USD 8.86 Billion
• 2030 Projected Market Size: USD 12.61 Billion
• CAGR (2025-2030): 7.3%
• Precision Farming Segment: Largest Market Share
• Asia Pacific: Highest CAGR
KEY TAKEAWAYS
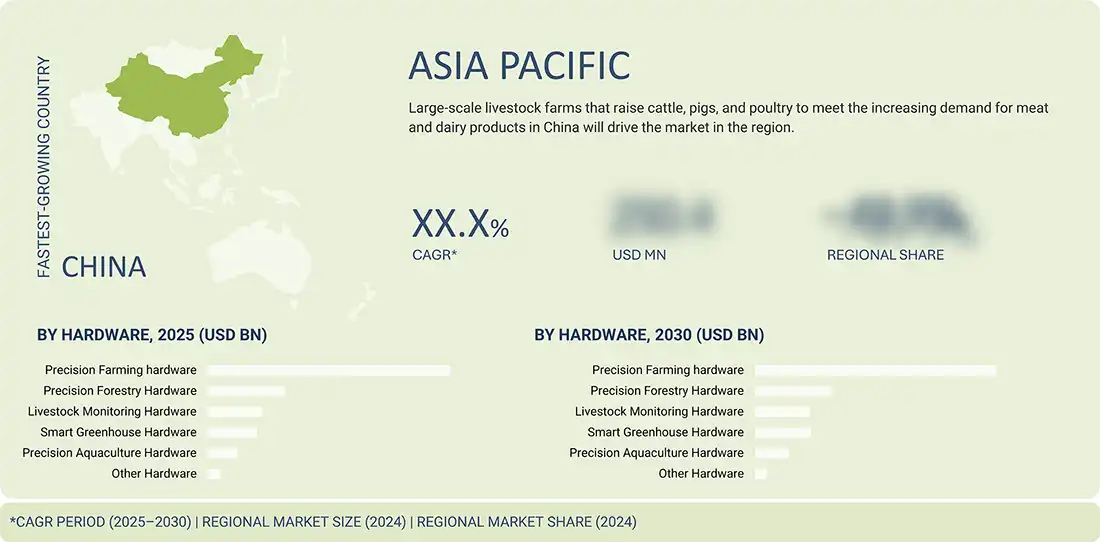
- By region, the market for Asia Pacific is projected to grow at a CAGR of 10.7%
- By application, the precision farming segment dominates the market with share of ~52% in 2024.
- By hardware, the market forprecision aquaculture hardware segment projected to grow at a CAGR of 9.8%
- By farm size, the large farm segment dominates the market with share of ~51% in 2024.
- By farm production planning, the production planning segment dominates the market with share of ~41% in 2024.
- Company Raven Industries, Inc., DeLaval, and Merck & Co., Inc. were identified as star players in the agriculture IOT market given their strong market share and product footprint. Companies Farmers Edge (Canada), CropX Inc. (New Zealand), and AgEagle Aerial Systems Inc. (US) have distinguished themselves among startups and SMEs by securing strong footholds in specialized niche areas, underscoring their potential as emerging market leaders
The Agriculture IoT market size is projected to expand significantly over the coming years, driven by the rising need for precision farming, resource optimization, and sustainable agricultural practices. Farmers and agribusinesses are increasingly adopting IoT technologies, such as sensors, drones, automation systems, and data analytics, to improve crop yields, enhance livestock management, and streamline farm operations. Growing demand for food security and government initiatives promoting smart farming further accelerate adoption. With its potential to optimize inputs, reduce costs, and enable real-time decision-making, IoT in agriculture is emerging as a transformative force shaping the future of farming worldwide
Source: Secondary Research, Interviews with Experts, MarketsandMarkets Analysis
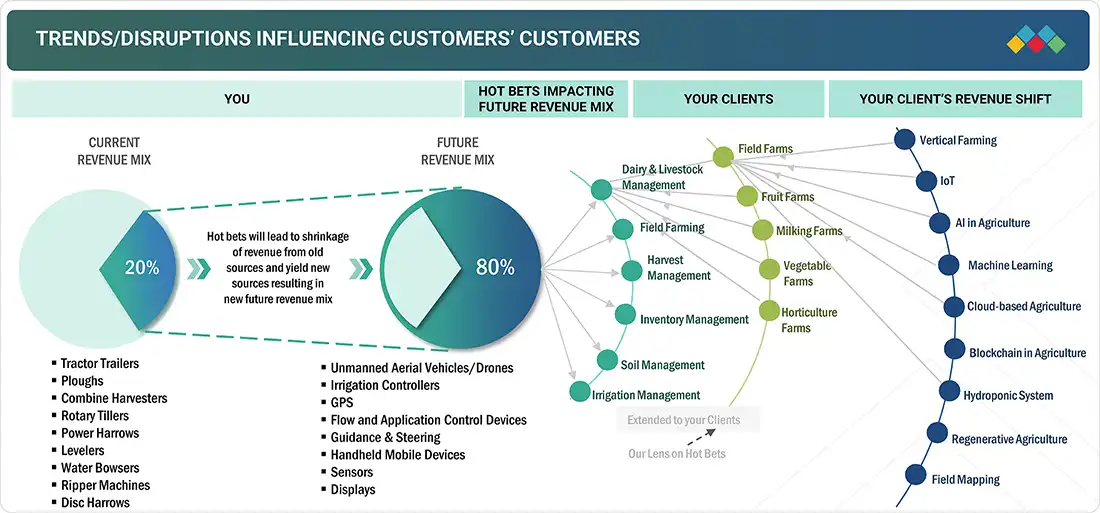
TRENDS & DISRUPTIONS IMPACTING CUSTOMERS' CUSTOMERS
The agriculture IoT industry is rapidly evolving with drones, sensors, irrigation controllers, GPS, and automation systems reshaping farming operations. These technologies are widely applied in livestock, soil, irrigation, crop, and inventory management to improve efficiency and sustainability. Rising adoption of AI, blockchain, and cloud-based platforms creates new revenue streams, while vertical farming, hydroponics, and regenerative agriculture contribute to future growth. Companies are innovating and diversifying solutions to meet the changing demands of modern agriculture.
Source: Secondary Research, Interviews with Experts, MarketsandMarkets Analysis
MARKET DYNAMICS
Level
-
Rapid advances in digital technologies, automation, and data analytics

-
Adoption of automation technology and IoT-enabled devices

Level
-
High upfront capital expenditure

-
Lack of technical expertise

Level
-
Rising integration of AI with IoT

-
Shift toward hyper-localized and data-validated decision making

Level
-
Concerns regarding agricultural data privacy

-
Limited digital infrastructure in rural areas

Source: Secondary Research, Interviews with Experts, MarketsandMarkets Analysis
Driver: Rapid advances in digital technologies, automation, and data analytics
Recent advances in digital technologies, automation, and data analytics are transforming agriculture. Integration of IoT-enabled sensors, drones, satellite imaging, and connected machinery allows farmers to capture real-time data on soil, crops, microclimate, and equipment performance. When combined with AI and machine learning, this data generates actionable insights for optimizing planting schedules, irrigation, fertilizer use, and pest management. These innovations drive higher yields, improved sustainability, reduced input waste, and more resilient farming systems
Restraint: High upfront capital expenditure
Agriculture IoT can boost yields and resource efficiency, but high upfront costs for sensors, drones, irrigation systems, and analytics platforms hinder adoption, especially for small- and mid-sized farmers. Limited credit access and risk tolerance further slow uptake, concentrating advanced solutions only in developed markets. Innovative financing models and subsidies will be vital to drive broader, equitable adoption
Opportunity: Rising integration of AI with IoT
AI integrated with IoT enables proactive, data-driven farming by predicting crop health issues, optimizing irrigation, and forecasting yields. Early detection of pests, diseases, and nutrient deficiencies reduces pesticide reliance and improves crop quality. These insights enhance profitability, sustainability, and supply chain efficiency, positioning agriculture IoT as a strategic engine for precision farming
Challenge: Concerns regarding agricultural data privacy
The vast amount of farm data generated by IoT tools, covering yields, land, soil, and finances, faces risks due to weak privacy regulations, a lack of standardized cybersecurity, and low digital literacy among farmers. Vulnerabilities expose sensitive information to misuse and unauthorized access. Strengthening encryption, regulatory frameworks, and farmer awareness is critical to ensure trust and resilience in digital agriculture
Agriculture IoT Market Growth: COMMERCIAL USE CASES ACROSS INDUSTRIES
| COMPANY | USE CASE DESCRIPTION | BENEFITS |
|---|---|---|
 |
Precision farming with high-resolution satellite imagery via Planet Labs partnership, integrated into the Cropwise digital agriculture platform | Enables early anomaly detection, improved decision-making, reduced input costs, higher yields, and sustainable farming practices |
 |
IoT-powered sensors with multi-network SIM cards for monitoring fruit size in real-time and uploading data to the cloud | Enhances forecasting and inventory management, reduces food waste, aligns fruit yield with market demand, and improves grower profitability |
 |
Drone-based remote sensing and satellite analytics to monitor crop health, water usage, and pest activity in California’s agriculture sector | Enabled early detection of stress, reduced water and chemical usage, optimized inputs, increased yields, lowered operational costs, and improved sustainability |
 |
Precision farming solutions for cotton farmers in Parbhani, Maharashtra, through a digital platform delivering real-time insights on crop management, soil health, and weather | Improved cotton yields, better pest and disease control, optimized resource utilization, enhanced crop quality, and increased farmer profitability |
 |
Precision herbicide spraying in sugarcane plantations of Paraná, Brazil, using DJI Agras T40 drones with mapping support from DJI Mavic 3M for optimized chemical application | Treated 4,000+ hectares with reduced chemical costs, lower environmental impact, improved weed control, healthier crops, enhanced efficiency, and greater operational agility. |
Logos and trademarks shown above are the property of their respective owners. Their use here is for informational and illustrative purposes only.
MARKET ECOSYSTEM
The agriculture IoT market functions within a complex and interconnected ecosystem involving diverse stakeholders across the agricultural value chain. From hardware manufacturers and sensor technology providers to software developers, connectivity solution providers, system integrators, and end users, such as farmers, cooperatives, and agribusinesses, each participant is pivotal in developing, integrating, and deploying IoT solutions in agriculture.
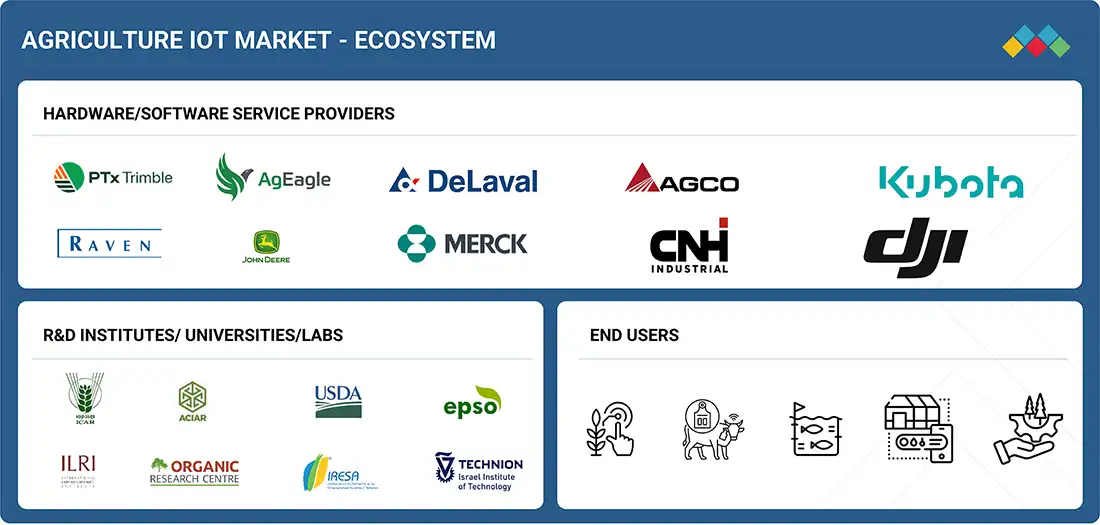
Logos and trademarks shown above are the property of their respective owners. Their use here is for informational and illustrative purposes only.
MARKET SEGMENTS
Source: Secondary Research, Interviews with Experts, MarketsandMarkets Analysis
Agriculture IoT Market, By Hardware
The precision farming hardware segment accounted for a significant share in 2024. The rise in precision farming hardware is driven by its increasing integration into smart agricultural systems for enhanced productivity, resource optimization, and crop health monitoring. These systems support applications such as automated irrigation, soil condition sensing, and pest control, contributing to higher yields and reduced operational costs.
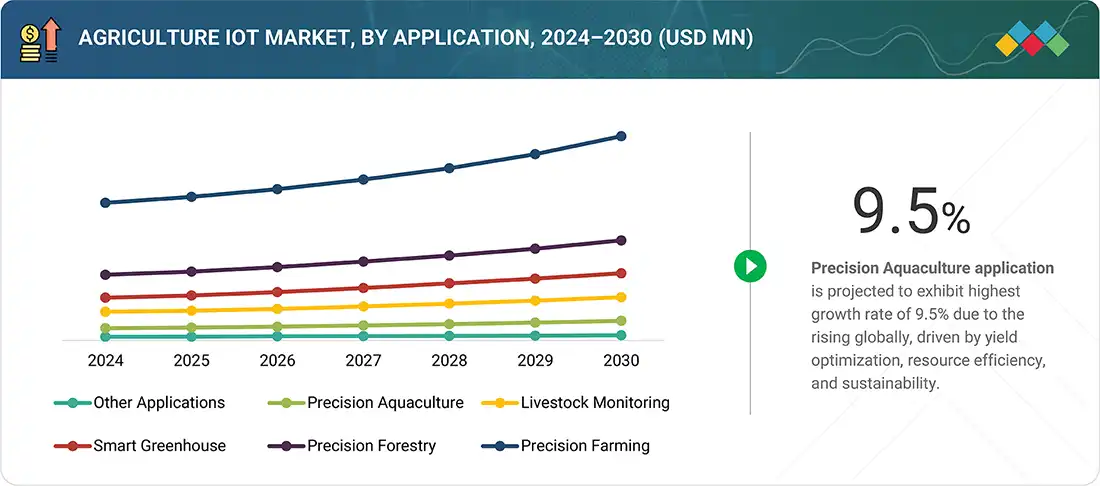
Agriculture IoT Market, By Application
In 2024, precision farming application accounted for the largest share of the global market. The demand for Agri IoT in precision farming is driven by the need to optimize crop yields, reduce resource wastage, and cut labor costs. Real-time monitoring of soil, weather, and crop health enables data-driven decisions, improving efficiency and profitability. Additionally, sustainability goals, compliance requirements, and government incentives further accelerate adoption among farmers seeking competitive advantage.
Agriculture IoT Market, By Farm Size
Medium farms held the largest share in 2024. The adoption of agriculture IoT among medium farms is fueled by the need to improve operational efficiency, optimize inputs, and reduce costs. Their scale allows measurable ROI from IoT investments, while automation and real-time monitoring help overcome labor shortages and stay competitive in the market.
Agriculture IoT Market, By Fram Production Planning
The market for pre-production segment captured largest share in 2024. In the pre-production stage, agriculture IoT drives soil testing, irrigation planning, and crop selection for optimized outputs. Early-stage monitoring and analytics enable data-backed decisions, minimize risks, and ensure efficient resource allocation even before planting begins.
REGION
Asia Pacific to be fastest-growing region in global agriculture IoT market trends during forecast period
The agriculture IoT market in Asia Pacific is driven by the need to enhance crop yields, optimize resource usage, and reduce labor dependency across diverse farm sizes. Growing adoption of smart irrigation, sensors, and data analytics as well as government initiatives and subsidies accelerate IoT deployment in small and medium farms. Early-stage monitoring in pre-production and precision farming further boosts efficiency and sustainability in the region. Additionally, the rising population and the increasing food demand in countries such as India and China contribute to greater adoption of smart farming solutions to ensure food security and meet regional consumption needs.
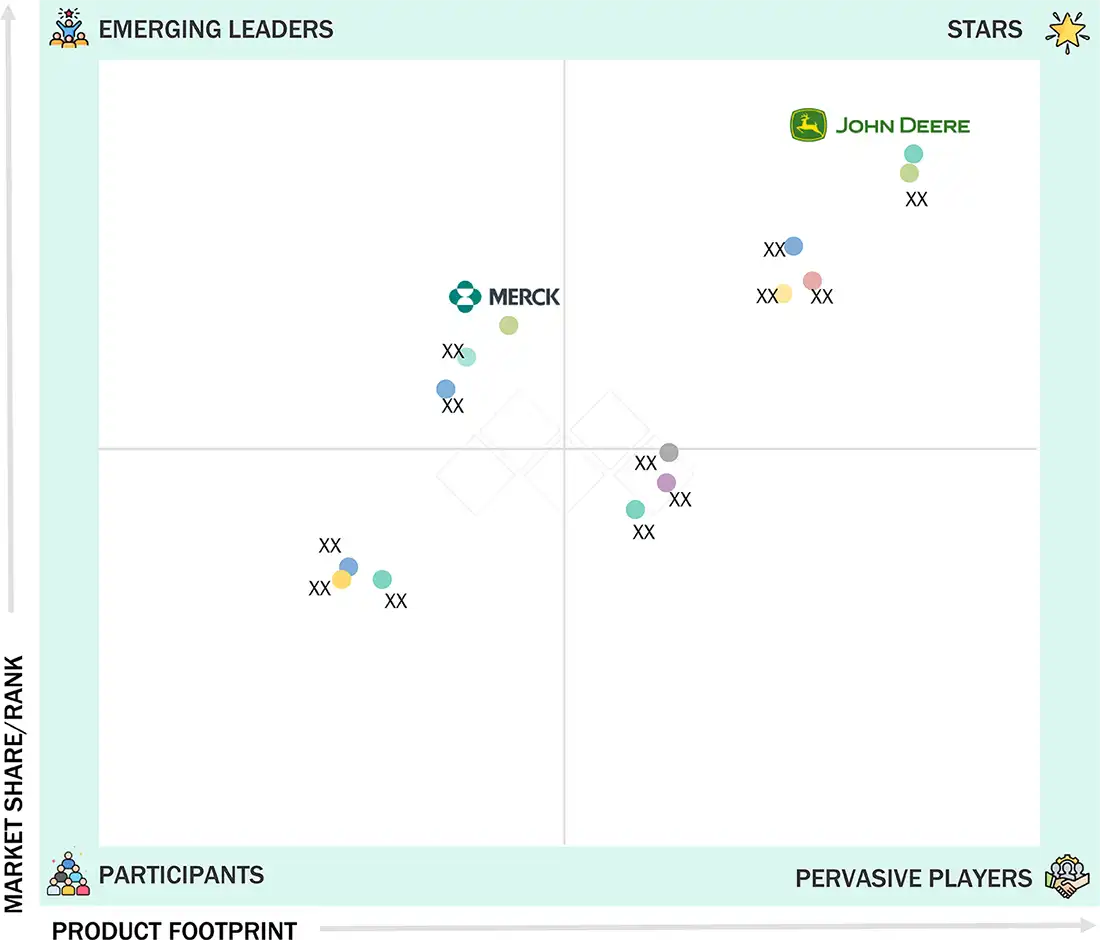
Agriculture IoT Market Share: COMPANY EVALUATION MATRIX
In the agriculture IoT companies matrix, Deere & Company (Star) leads with a strong market presence and extensive portfolio of precision agriculture solutions, driving large-scale adoption through connected machinery, smart equipment, and advanced farm management platforms. Merck & Co. (Emerging Leader) is gaining traction with innovative digital agriculture and IoT-driven solutions that enhance crop health monitoring and sustainability. While Deere & Company dominates with scale and established customer networks, Merck shows strong growth potential to advance toward the leaders' quadrant by expanding its agri-tech offerings.
Source: Secondary Research, Interviews with Experts, MarketsandMarkets Analysis
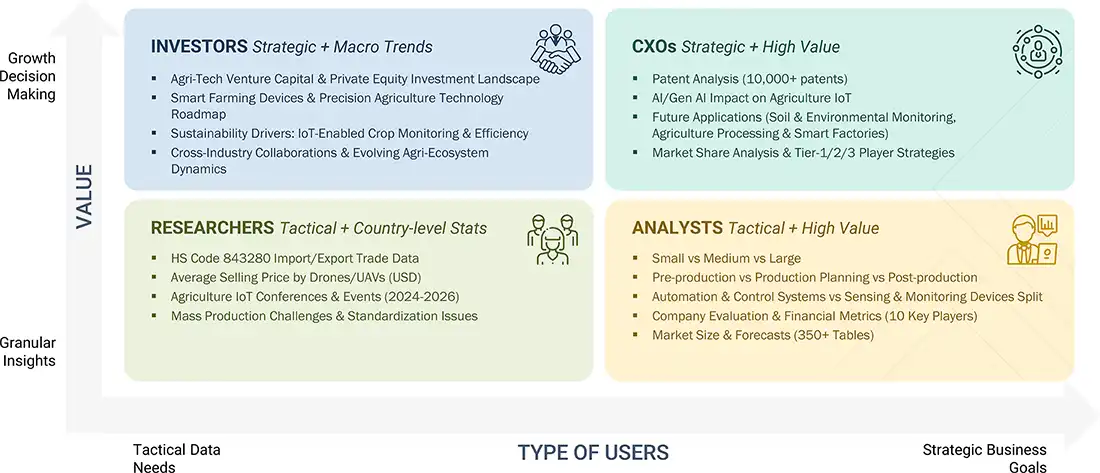
WHAT IS IN IT FOR YOU: Agriculture IoT Market Growth REPORT CONTENT GUIDE
DELIVERED CUSTOMIZATIONS
We have successfully delivered the following deep-dive customizations:
| CLIENT REQUEST | CUSTOMIZATION DELIVERED | VALUE ADDS |
|---|---|---|
| Agricultural Equipment Manufacturer | • Detailed profiles of IoT-enabled equipment competitors (tractors, harvesters, and sensors) • Customer segmentation by farm size and crop type • Analysis of ecosystem partnerships (hardware, software, and connectivity) | • Identify gaps in IoT product portfolio • Highlight emerging customer demands and tech trends • Strengthen market entry and collaboration strategies |
| AgTech Startup | • Comprehensive list of IoT solutions by application (precision farming, livestock monitoring, and irrigation) • Benchmarking adoption rates across regions and farm types • Analysis of barriers to adoption and regulatory landscape | • Insights on revenue growth from emerging IoT applications • Pinpoint opportunities for cross-application integration • Enable targeting of high-potential customer segments |
| Farm Cooperative/Agribusiness | • Economic impact analysis of IoT adoption on yield and operational efficiency • Forecast of IoT tech penetration and cost trends by 2030 | • Support strategic investment in IoT tech deployment • Uncovering new revenue streams from data analytics services • Strengthen operational resilience and sustainability |
| Agricultural Input Supplier | • Global and regional market sizing and supply chain mapping • Pipeline analysis of IoT-enabled products and new entrants • Customer profiling by product use and farm management style | • Enhance forward integration with IoT-enabled solutions • Identify high-demand customer segments for long-term contracts • Assess supply-demand gaps for competitive advantage |
| Agricultural Research Institution | • Mapping of IoT innovation landscape in agriculture • Assessment of technology readiness levels and adoption roadmaps • Competitive analysis of research partnerships and funding | • Support backward integration into IoT research collaborations • Identify future applications in smart farming and sustainability • Secure early-mover advantage in new IoT-driven practices |
RECENT DEVELOPMENTS
- June 2025 : Deere & Company launched F8 and F9 Series forage harvesters. These products offer powerful engines ranging from 425PS to over 1,000PS, advanced fuel-efficient technologies, and precision agriculture integration like the StarFire 7500 receiver. They deliver superior forage quality, automation, and operator comfort for efficient, high-performance harvesting.
- June 2025 : KUBOTA Corporation collaborated with Agtonomy to conduct joint projects aimed at providing smart solutions for specialty crops through the development of data platforms and automation systems. The collaboration is ongoing since 2024, focuses on developing and commercializing smart solutions for specialty crop agriculture by integrating automation systems and data platforms
- May 2025 : Deere & Company acquired Sentera, a leading provider of remote imagery solutions for agriculture. This acquisition advances John Deere's precision agriculture technology by integrating Sentera’s high-resolution drone-based imagery and software capabilities into the John Deere Operations Center.
Table of Contents
 Exclusive indicates content/data unique to MarketsandMarkets and not available with any competitors.
Methodology
The research study involved four major steps in estimating the size of the agriculture IoT market. Exhaustive secondary research has been done to collect important information about the market and peer markets. The next step has been to validate these findings and assumptions and size them with the help of primary research with industry experts across the value chain. Both top-down and bottom-up approaches have been used to estimate the market size. After this, the market breakdown and data triangulation approaches have been adopted to estimate the market sizes of segments and subsegments.
Secondary Research
Various secondary sources have been referred to in the secondary research process to identify and collect important information for this study. The secondary sources include annual reports, press releases, and investor presentations of companies; white papers; journals and certified publications; and articles from recognized authors, websites, directories, and databases. Secondary research has been conducted to obtain key information about the industry's supply chain, the market's value chain, the total pool of key players, market segmentation according to the industry trends (to the bottom-most level), regional markets, and key developments from market- and technology-oriented perspectives. The secondary data has been collected and analyzed to determine the overall market size, further validated by primary research.
Primary Research
Extensive primary research has been conducted after understanding the agriculture IoT market scenario through secondary research. Several primary interviews have been conducted with key opinion leaders from demand- and supply-side vendors across major regions— North America, Europe, Asia Pacific, RoW. This primary data has been collected mainly through telephonic interviews, which consist of 80% of the total primary interviews; questionnaires, and emails:

Note: Others include sales, marketing, and product managers.
To know about the assumptions considered for the study, download the pdf brochure
Market Size Estimation
In the market engineering process, both top-down and bottom-up approaches and data triangulation methods have been used to estimate and validate the size of the agriculture IoT and other dependent submarkets. The research methodology used to estimate the market sizes includes the following:
- Identifying the players in the agriculture IoT market, along with their offerings
- Analyzing major manufacturers of agriculture IoT Solutions, studying their portfolios, and understanding several types of products based on their features and functions
- Tracking ongoing and upcoming developments in the market, such as investments made, R&D activities, product launches, acquisitions, partnerships, and forecasting the market based on these developments and other critical parameters
- Identification of each hardware of the agriculture IoT offered by the ecosystem players
- Consideration of revenues generated by agriculture IoT solution manufacturers for each type of hardware
- Identification of trends of the agriculture IoT market for each hardware in each region (North America, Europe, Asia Pacific, Rest of the World) and calculation of market size
- Summation of the market size of all hardware and deriving the total market size (USD million)
- Conducting multiple discussions with key opinion leaders to understand different agriculture IoT hardware, applications, and current trends in the market, thereby analyzing the breakup of the scope of work carried out by major manufacturing companies
- Arriving at the market estimates by analyzing the revenues of these companies generated from different types of products, and then combining the same to get the market estimate by region
- The pricing of various product types is calculated separately to analyze the shipment of the precision farming hardware category.
- Verifying and cross-checking the estimates at every level by discussing with key opinion leaders, such as CXOs, directors, and operations managers, and finally with the domain experts in MarketsandMarkets
- Studying various paid and unpaid sources of information, such as annual reports, press releases, white papers, and databases
Agriculture IoT Market : Top-Down and Bottom-Up Approach

Data Triangulation
After arriving at the overall market size, using the market size estimation processes as explained above, the market has been split into several segments and subsegments. Data triangulation and market breakdown procedures have been employed to complete the entire market engineering process and arrive at each market segment's and subsegment's exact statistics. The data has been triangulated by studying various factors and trends from the demand and supply sides in the agriculture IoT market.
Market Definition
The Agriculture IoT Market encompasses solutions that assess and track the quality, performance, and health of Agriculture IoT refers to the application of Internet of Things (IoT) technologies in agriculture, where interconnected devices such as sensors, monitors, cameras, controllers, and connectivity technologies are used in farming operations to collect and exchange real-time data. This integration enables monitoring, analysis, and optimization of agricultural activities, facilitating precision farming, efficient resource utilization (such as water, fertilizers, and energy), enhanced crop and livestock management, and data-driven decision-making to improve productivity, sustainability, and operational efficiency.
Key Stakeholders
- Agriculture IoT component providers
- Product manufacturers
- Agriculture IoT-related associations, organizations, forums, and alliances
- Government and corporate bodies
- Research institutes and organizations
- Venture capitalists, private equity firms, and start-ups
- Distributors and traders
- End users
- Market research and consulting firms
- Agri-food buyers
- Agriculture technology providers
Report Objectives
- To describe and forecast the size of the agriculture IoT market by hardware, farm size, farm production planning, application, and region in terms of value
- To estimate the market size of various segments across four key regions, North America, Europe, Asia Pacific, and RoW, in terms of value
- To forecast the size of the agriculture IoT market by automation & control systems, in terms of volume
- To provide detailed information regarding the drivers, restraints, opportunities, and challenges influencing the growth of the agriculture IoT market
- To evaluate the agriculture IoT value chain and ecosystem, along with the average selling price of drones/UVAs
- To strategically analyze the regulatory landscape, tariffs, standards, patents, Porter's five forces, import and export scenarios, AI/Gen AI impact, trade values, the 2025 US Tariff, and case studies pertaining to the market under study
- To understand micromarkets with regard to individual growth trends, prospects, and contributions to the overall market
- To study opportunities in the market for stakeholders by identifying high-growth segments
- To provide details of the competitive landscape for market leaders
- To offer details of the macroeconomic outlook for regions
- To analyze strategies such as product launches, contracts, collaborations, and acquisitions adopted by players in the agriculture IoT market
- To profile key players in the agriculture IoT market and comprehensively analyze their market ranking based on their revenue, market share, and core competencies
Available Customizations:
With the given market data, MarketsandMarkets offers customizations according to the specific requirements of companies. The following customization options are available for the report:
- Detailed analysis and profiling of additional market players based on various blocks of the supply chain
Key Questions Addressed by the Report
What is the current size of the IoT in Agriculture market?
The Agriculture IoT market is valued at approximately USD 8.86 billion in 2025 and is expected to reach USD 12.61 billion by 2030.
What is the expected growth rate of the IoT in Agriculture market?
The market is projected to grow at a CAGR of 7.3% during the forecast period from 2025 to 2030.
What are the major growth drivers for the IoT in Agriculture industry?
Key drivers include increasing adoption of precision farming, demand for data-driven agriculture, automation technologies, IoT-enabled sensors, drones, and resource-efficient farming practices.
Which technology trend is shaping the IoT in Agriculture market?
Integration of AI with IoT, automated farm machinery, advanced sensors, drones, and real-time analytics are major technology trends transforming agricultural operations.
Which application segment dominates the market?
Precision farming is the leading application segment, accounting for approximately 52% of the market share in 2024.
Which region is expected to witness the fastest growth?
The Asia Pacific region is projected to register the highest growth rate, with a CAGR of about 10.7% during the forecast period.
What challenges affect the growth of the IoT in Agriculture market?
Major challenges include high initial investment costs, lack of technical expertise among farmers, and concerns regarding agricultural data privacy and security.
Who are the leading companies operating in the IoT in Agriculture market?
Key companies include Raven Industries, DeLaval, Merck & Co., Inc., Farmers Edge, CropX Inc., and AgEagle Aerial Systems Inc.
What opportunities exist in the IoT in Agriculture industry?
Growth opportunities include AI-enabled farming solutions, variable rate application technologies, hyper-localized farm decision-making, and advanced digital agriculture platforms.
How is the market analyzed in the report?
The report uses top-down and bottom-up market sizing approaches, data triangulation, company revenue analysis, product portfolio assessment, and regional trend evaluation to estimate market size and forecast growth.
Need a Tailored Report?
Customize this report to your needs
Get 10% FREE Customization
Customize This ReportPersonalize This Research
- Triangulate with your Own Data
- Get Data as per your Format and Definition
- Gain a Deeper Dive on a Specific Application, Geography, Customer or Competitor
- Any level of Personalization
Let Us Help You
- What are the Known and Unknown Adjacencies Impacting the Agriculture IoT Market
- What will your New Revenue Sources be?
- Who will be your Top Customer; what will make them switch?
- Defend your Market Share or Win Competitors
- Get a Scorecard for Target Partners

Custom Market Research Services
We Will Customise The Research For You, In Case The Report Listed Above Does Not Meet With Your Requirements
Get 10% Free CustomisationTESTIMONIALS

Tetsuya Ohhira
Business Development Manager-Technology Business
Nikon Corporation,
Leading Japanese MNC specializing in optics and imaging productswww.nikon.com
MarketsandMarkets™ response
is quick. Their attitude is flexible and positive. Analyst Insights are globally considered and
significant. Client Services quickly respond to our inquiry and demand. Their wide range of global
surveys help us make our strategic plan.
We hope Knowledge Store will be easier to search
for a report.
VP - Marketing & Business Development
Leading Provider of Process Control Solutions
We engaged with MarketsandMarkets on a study to perform an analysis and recommend a Go-To-Market strategy for metrology and process control in the semiconductor market. The study was tailored to our targets and needs with well-defined milestones. Our overall experience with the MarketsandMarkets team was very good throughout the project in all aspects including the analysis methodologies used, the quality and depth of primary and secondary data sets, the professionalism and flexibility of the team and the ability to meet the target schedule and milestones. We want to thank MarketsandMarkets team for a job well done.


Growth opportunities and latent adjacency in Agriculture IoT Market