4
MARKET OVERVIEW
Harness the surge in AI-driven lab informatics amidst rising R&D and regulatory demands.
45
4.2.1.1
GROWING NEED FOR LABORATORY AUTOMATION
4.2.1.2
INCREASING ADOPTION OF INTEGRATED LABORATORY INFORMATICS SOLUTIONS
4.2.1.3
RISING R&D EXPENDITURE IN PHARMACEUTICAL AND BIOTECHNOLOGY COMPANIES
4.2.1.4
STRINGENT REGULATORY REQUIREMENTS FOR PRECLINICAL AND CLINICAL TESTING
4.2.1.5
GROWING ADOPTION OF CLOUD-BASED AND SAAS LABORATORY SYSTEMS
4.2.2.1
HIGH IMPLEMENTATION, MAINTENANCE, AND SERVICE COSTS
4.2.2.2
INTEGRATION AND INTEROPERABILITY CHALLENGES
4.2.3.1
RISING DEMAND FOR REAL-TIME DATA & ANALYTICS
4.2.3.2
RAPID ADOPTION OF AI-ENABLED LABORATORY INFORMATICS
4.2.3.3
GROWTH POTENTIAL IN EMERGING ECONOMIES
4.2.4.1
SHORTAGE OF SKILLED MEDICAL LABORATORY TECHNICIANS
4.2.4.2
LIMITED ADOPTION OF LAB INFORMATICS SOLUTIONS IN SMES
4.2.4.3
INTERFACING CHALLENGES WITH INFORMATICS SOFTWARE
4.3
UNMET NEEDS AND WHITE SPACES
4.4
INTERCONNECTED MARKETS AND CROSS-SECTOR OPPORTUNITIES
4.5
STRATEGIC MOVES BY TIER-1/2/3 PLAYERS
5
INDUSTRY TRENDS
Uncover strategic insights driving competitive edge in the evolving global healthcare IT landscape.
57
5.1
PORTER'S FIVE FORCES ANALYSIS
5.1.1
BARGAINING POWER OF SUPPLIERS
5.1.2
BARGAINING POWER OF BUYERS
5.1.3
THREAT OF NEW ENTRANTS
5.1.4
THREAT OF SUBSTITUTES
5.1.5
INTENSITY OF COMPETITIVE RIVALRY
5.2
MACROECONOMIC INDICATORS
5.2.2
GDP TRENDS AND FORECAST
5.2.3
TRENDS IN GLOBAL HEALTHCARE IT INDUSTRY
5.3.1
RESEARCH & PRODUCT DEVELOPMENT
5.3.2
TECHNOLOGY INFRASTRUCTURE
5.3.3
PLATFORM DEVELOPMENT
5.3.6
POST-SALES SERVICES
5.5.1
INDICATIVE PRICE FOR LABORATORY SOFTWARE MARKET, BY SOFTWARE (2025)
5.5.2
INDICATIVE PRICE FOR LABORATORY SOFTWARE MARKET, BY REGION (2025)
5.6
KEY CONFERENCES AND EVENTS
5.7
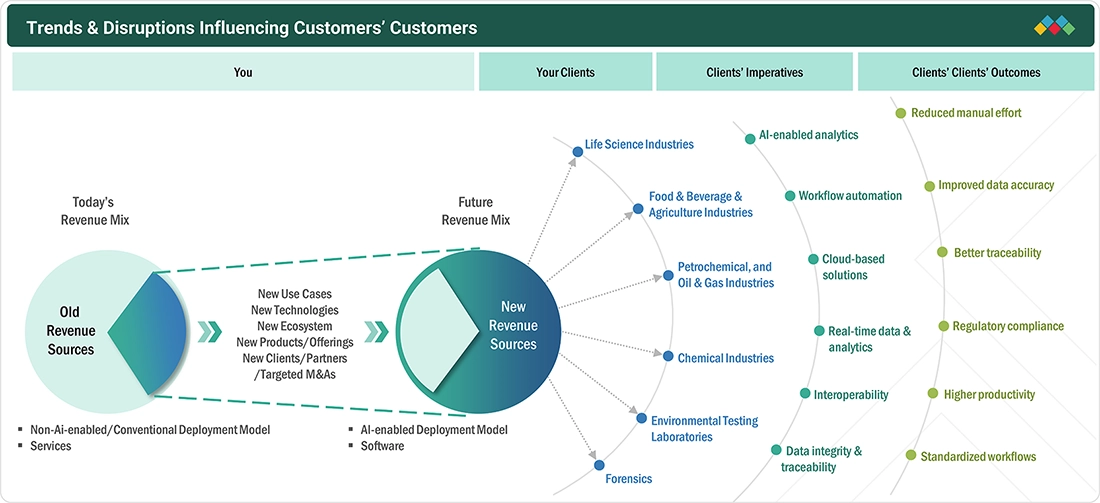
TRENDS/DISRUPTIONS IMPACTING CUSTOMERS' BUSINESSES
5.8
INVESTMENT AND FUNDING SCENARIO
5.9.1
IMPROVING CLINICAL LABORATORY DATA MANAGEMENT
5.9.2
IMPROVED DATA MANAGEMENT
5.9.3
HARMONIZED WORKFLOWS & INTERCONNECTED ECOSYSTEM
5.9.4
IMPROVED RESULT ACCESSIBILITY
5.10
IMPACT OF US TARIFF OVERVIEW
5.10.3
PRICE IMPACT ANALYSIS
5.10.4
IMPACT ON COUNTRY/REGION
5.10.5
IMPACT ON END USERS
5.10.5.2
FOOD & BEVERAGE AND AGRICULTURE
STRATEGIC DISRUPTION THROUGH TECHNOLOGY, PATENTS,
6.1
KEY EMERGING TECHNOLOGIES
6.1.1
AI-ENABLED LABORATORY INFORMATICS AND INTELLIGENT ANALYTICS
6.1.2
AUTONOMOUS LABORATORY AUTOMATION AND WORKFLOW ORCHESTRATION
6.1.3
CLOUD-NATIVE, INTEROPERABLE, AND COMPOSABLE LABORATORY ECOSYSTEMS
6.2
COMPLEMENTARY TECHNOLOGIES
HL7, FHIR, LOINC, SNOMED CT, AND LABORATORY DATA
LABORATORY MIDDLEWARE, APIS, AND INSTRUMENT CONNECTIVITY
6.2.3
CLOUD, DATA MANAGEMENT, AND CYBERSECURITY INFRASTRUCTURE
6.3
ADJACENT TECHNOLOGIES
6.3.1
DIGITAL TWINS AND COMPUTATIONAL MODELING
6.4
TECHNOLOGY/PRODUCT ROADMAP
6.5.1
PATENT PUBLICATION TRENDS FOR LABORATORY SOFTWARE MARKET
6.5.2
INSIGHTS: JURISDICTION AND TOP APPLICANT ANALYSIS
6.6.1
AI-ASSISTED LABORATORY DECISION SUPPORT AND ADAPTIVE WORKFLOWS
REAL-TIME LABORATORY WORKFLOW OPTIMIZATION AND
6.6.3
LONGITUDINAL LABORATORY DATA MANAGEMENT AND PREDICTIVE ANALYTICS
6.7
IMPACT OF AI/GEN AI ON LABORATORY SOFTWARE MARKET
6.7.2
POTENTIAL OF AI/GEN AI IN LABORATORY SOFTWARE MARKET
6.7.3
CASE STUDIES RELATED TO AI/GEN AI IMPLEMENTATION
6.7.4
IMPACT OF AI/GEN AI ON INTERCONNECTED AND ADJACENT ECOSYSTEMS
6.7.4.1
LABORATORY INSTRUMENTS & AUTOMATION
6.7.4.2
HEALTHCARE & CLINICAL INFORMATICS
6.7.4.3
PHARMA, BIOTECH, AND SCIENTIFIC RESEARCH
6.7.5
USER READINESS AND IMPACT ASSESSMENT
6.7.5.1.1
USER A: LIFE SCIENCE INDUSTRY
6.7.5.1.2
USER B: FOOD & BEVERAGE INDUSTRY
6.7.5.1.3
USER C: CHEMICAL INDUSTRY
6.7.5.2
IMPACT ASSESSMENT
6.7.5.2.1
USER A: LIFE SCIENCE INDUSTRY
6.7.5.2.2
USER B: FOOD & BEVERAGE INDUSTRY
6.7.5.2.3
USER C: CHEMICAL INDUSTRY
7
REGULATORY LANDSCAPE
Navigate complex global regulations with insights into regional compliance and industry standards.
94
7.1
REGIONAL REGULATIONS AND COMPLIANCE
7.1.1
REGULATORY BODIES, GOVERNMENT AGENCIES, AND OTHER ORGANIZATIONS
7.1.2
REGULATORY FRAMEWORK
7.1.6
MIDDLE EAST & AFRICA
8
CUSTOMER LANDSCAPE & BUYER BEHAVIOR
Navigate complex buying dynamics by understanding stakeholder influence and unmet end-user needs.
102
8.2
DECISION-MAKING PROCESS
8.3
BUYER STAKEHOLDERS AND BUYING EVALUATION CRITERIA
8.4
KEY STAKEHOLDERS IN BUYING PROCESS
8.4.1
KEY STAKEHOLDERS IN BUYING PROCESS
8.5
ADOPTION BARRIERS & INTERNAL CHALLENGES
8.6
UNMET NEEDS FROM VARIOUS END USERS
8.6.2
END USER EXPECTATIONS
9
LABORATORY SOFTWARE MARKET, BY SOLUTION TYPE
Market Size & Growth Rate Forecast Analysis to 2031 in USD Million | 12 Data Tables
110
9.2
LABORATORY INFORMATION MANAGEMENT SYSTEMS
9.2.1.1
ADVANTAGES SUCH AS FASTER ROI AND REDUCED TOTAL COST OF OWNERSHIP BOOST SEGMENT
9.2.2
INDUSTRY-SPECIFIC LIMS
9.2.2.1
NEED FOR LIMS SOLUTIONS TO CATER TO SPECIFIC INDUSTRY REQUIREMENTS TO SUPPORT MARKET GROWTH
9.3
ELECTRONIC LAB NOTEBOOKS
INCREASING NEED FOR COMPLIANCE, INTELLECTUAL PROPERTY
9.4
CHROMATOGRAPHY DATA SYSTEMS
CHROMATOGRAPHY DATA SYSTEMS SUPPORT AUTOMATED
9.5
ELECTRONIC DATA CAPTURE & CLINICAL DATA MANAGEMENT SYSTEMS
INCREASING DIGITIZATION OF CLINICAL RESEARCH AND NEED FOR
9.6
LABORATORY EXECUTION SYSTEMS
LABORATORY EXECUTION SYSTEMS PROVIDE AN ELECTRONIC
9.7
QUALITY MANAGEMENT SYSTEMS
INCREASING NEED FOR DIGITAL QUALITY, COMPLIANCE, AND
9.8
SCIENTIFIC DATA MANAGEMENT SYSTEMS
SDMS SUPPORTS CENTRALIZED MANAGEMENT, TRACEABILITY,
10
LABORATORY SOFTWARE MARKET, BY COMPONENT
Market Size & Growth Rate Forecast Analysis to 2031 in USD Million | 4 Data Tables
122
RISING NEED TO INTEGRATE EXISTING ANALYTICAL INSTRUMENTS
GROWING DEMAND FOR IMPLEMENTATION, INTEGRATION, AND
NEED TO RESOLVE TECHNICAL ISSUES AND ENHANCE LABORATORY
11
LABORATORY SOFTWARE MARKET, BY TECHNOLOGY MATURITY
Market Size & Growth Rate Forecast Analysis to 2031 in USD Million | 3 Data Tables
127
11.2
AI-ENABLED LABORATORY SOFTWARE
11.2.1
INCREASING ADOPTION OF AI-BASED ANALYTICS, PREDICTIVE CAPABILITIES, AND AUTOMATION TO SUPPORT MARKET GROWTH
11.3
NON-AI-ENABLED/CONVENTIONAL LABORATORY SOFTWARE
11.3.1
CONTINUED USE OF ESTABLISHED LABORATORY SOFTWARE FOR CORE DATA MANAGEMENT, WORKFLOW AUTOMATION, AND COMPLIANCE
12
LABORATORY SOFTWARE MARKET, BY FUNCTION
Market Size & Growth Rate Forecast Analysis to 2031 in USD Million | 8 Data Tables
131
12.2
SAMPLE & WORKFLOW MANAGEMENT
12.2.1
INCREASING NEED FOR SAMPLE TRACEABILITY AND WORKFLOW AUTOMATION TO SUPPORT MARKET GROWTH
12.3
EXPERIMENT EXECUTION & DATA MANAGEMENT
12.3.1
GROWING DEMAND FOR STANDARDIZED EXPERIMENT EXECUTION AND DIRECT DATA CAPTURE TO IMPROVE DATA QUALITY
12.4
DATA STORAGE & LIFECYCLE MANAGEMENT
12.4.1
INCREASING LABORATORY DATA VOLUMES AND NEED FOR LONG-TERM DATA ACCESS TO DRIVE DEMAND
12.5
QUALITY & COMPLIANCE CONTROL
12.5.1
INCREASING FOCUS ON DATA INTEGRITY, AUDITABILITY, AND DIGITAL QUALITY PROCESSES TO SUPPORT MARKET GROWTH
12.6
ANALYTICS & INTERPRETATION
12.6.1
GROWING USE OF ADVANCED ANALYTICS AND AI TO EXTRACT INSIGHTS FROM LABORATORY DATA TO DRIVE MARKET GROWTH
12.7
INVENTORY & ASSET MANAGEMENT
12.7.1
INCREASING NEED FOR REAL-TIME MANAGEMENT OF LABORATORY MATERIALS AND EQUIPMENT TO IMPROVE OPERATIONAL EFFICIENCY
12.8
REPORTING & REGULATORY SUBMISSION
12.8.1
GROWING NEED FOR AUTOMATED REPORTING AND TRACEABLE ELECTRONIC SUBMISSIONS TO SUPPORT REGULATORY COMPLIANCE
13
LABORATORY SOFTWARE MARKET, BY INDUSTRY
Market Size & Growth Rate Forecast Analysis to 2031 in USD Million | 16 Data Tables
140
13.2.1
PHARMACEUTICAL & BIOTECHNOLOGY COMPANIES
13.2.1.1
ABILITY TO AUTOMATE WORKFLOWS AND IMPROVE EFFICIENCY IN PHARMA & BIOTECH COMPANIES TO BOOST DEMAND
13.2.2
CONTRACT SERVICE ORGANIZATIONS (CDMO/CRO/CMO)
13.2.2.1
IMPACT OF ADVANCED LABORATORY SOFTWARE ON CRO, CDMO AND CMO GROWTH TO BOOST SEGMENT
13.2.3
BIOBANKS & BIOREPOSITORIES
ADVANCEMENTS FACILITATING PRECISION MEDICINE AND COLLABORATIVE
13.2.4
CLINICAL & MOLECULAR DIAGNOSTICS LABORATORIES
13.2.4.1
ENHANCED EFFICIENCY AND COMPLIANCE TO DRIVE SEGMENT GROWTH
13.2.5
ACADEMIC & GOVERNMENT RESEARCH INSTITUTES
13.2.5.1
ADVANCES IN CANCER, GENOMICS, AND PROTEOMICS RESEARCH TO SUPPORT MARKET GROWTH
13.2.6
NGS/GENOMIC LABORATORIES
13.2.6.1
IMPACT OF NEXT-GENERATION SEQUENCING (NGS) ON LABORATORY SOFTWARE: REVOLUTIONIZING GENOMIC RESEARCH AND CLINICAL DIAGNOSTICS
13.2.7
TOXICOLOGY LABORATORIES
13.2.7.1
IMPROVED TOXICOLOGY WORKFLOW MANAGEMENT, DATA INTEGRITY, AND REGULATORY COMPLIANCE TO DRIVE SEGMENT
13.3
FOOD & BEVERAGE AND AGRICULTURE
13.3.1
MAJOR ROLE IN FOOD CONTAMINATION PREVENTION TO BOOST MARKET
13.4
PETROCHEMICAL AND OIL & GAS INDUSTRIES
13.4.1
ENHANCED OPERATIONAL EFFICIENCY AND COMPLIANCE TO PROPEL SEGMENT
13.5.1
ADVANCED QUALITY AND EFFICIENCY IN SPECIALTY CHEMICALS – KEY DRIVERS
13.6
ENVIRONMENTAL TESTING LABORATORIES
ASSURED COMPLIANCE AND EFFICIENCY IN ENVIRONMENTAL
ENHANCED FORENSIC INVESTIGATIONS WITH ADVANCED
14
LABORATORY SOFTWARE MARKET, BY REGION
Comprehensive coverage of 8 Regions with country-level deep-dive of 17 Countries | 203 Data Tables.
156
14.3
MACROECONOMIC OUTLOOK FOR NORTH AMERICA
INCREASING ADOPTION OF AI-ENABLED AND INTEROPERABLE LABORATORY
INCREASING DIGITALIZATION AND INVESTMENT IN RESEARCH INFRASTRUCTURE
14.4.1
MACROECONOMIC OUTLOOK FOR EUROPE
INCREASING DIGITALIZATION OF HEALTHCARE AND INVESTMENT IN BIOTECHNOLOGY
INCREASING INVESTMENT IN HEALTH INNOVATION AND BIOMEDICAL RESEARCH
14.4.4.1
INCREASING LIFE SCIENCE INVESTMENT AND DIGITALIZATION TO DRIVE ADOPTION
INCREASING HEALTHCARE DIGITALIZATION AND RESEARCH DATA
INCREASING HEALTH DATA DIGITALIZATION AND LIFE SCIENCE INVESTMENT
14.5.1
MACROECONOMIC OUTLOOK FOR ASIA PACIFIC
INCREASING HEALTHCARE DIGITALIZATION AND BIOMEDICAL RESEARCH
GOVERNMENT SUPPORT FOR HEALTHCARE DIGITALIZATION AND ADVANCED
EXPANSION OF DIGITAL HEALTH INFRASTRUCTURE AND LIFE SCIENCE RESEARCH
INCREASING GENOMICS ADOPTION AND HEALTHCARE DATA DIGITALIZATION
INCREASING INVESTMENT IN DIGITAL HEALTHCARE AND BIOMEDICAL
14.5.7
REST OF ASIA PACIFIC
14.6.1
MACROECONOMIC OUTLOOK FOR LATIN AMERICA
INCREASING DIGITAL HEALTH INVESTMENT AND INTEROPERABILITY TO
INCREASING HEALTHCARE DIGITALIZATION AND LABORATORY DATA INTEGRATION
14.6.4
REST OF LATIN AMERICA
14.7
MIDDLE EAST & AFRICA
14.7.1
MACROECONOMIC OUTLOOK FOR MIDDLE EAST & AFRICA
14.7.2.1.1
GROWING HEALTHCARE DIGITALIZATION AND INNOVATION TO DRIVE MARKET GROWTH
14.7.2.2.1
INCREASING HEALTHCARE DIGITALIZATION AND AI ADOPTION TO DRIVE MARKET GROWTH
14.7.2.3
OTHER GCC COUNTRIES
INCREASING HEALTHCARE DATA DIGITALIZATION AND LABORATORY ANALYTICS
14.7.4
REST OF MIDDLE EAST & AFRICA
15
COMPETITIVE LANDSCAPE
Uncover key strategies and market dynamics shaping the laboratory software industry's competitive edge.
260
15.2
KEY PLAYER STRATEGY/RIGHT TO WIN, 2023–2026
15.3
REVENUE ANALYSIS, 2021–2025
15.4
MARKET SHARE ANALYSIS
15.5
BRAND/SOFTWARE COMPARISON
15.6
COMPANY VALUATION AND FINANCIAL METRICS
15.7
COMPANY EVALUATION MATRIX: KEY PLAYERS, 2025
15.7.5
COMPANY FOOTPRINT: KEY PLAYERS, 2025
15.7.5.1
COMPANY FOOTPRINT
15.7.5.2
REGION FOOTPRINT
15.7.5.3
TECHNOLOGY FOOTPRINT
15.7.5.4
COMPONENT FOOTPRINT
15.7.5.5
INDUSTRY FOOTPRINT
15.8
COMPANY EVALUATION MATRIX: STARTUPS/SMES, 2025
15.8.1
PROGRESSIVE COMPANIES
15.8.2
RESPONSIVE COMPANIES
15.8.5
COMPETITIVE BENCHMARKING: STARTUPS/SMES, 2025
15.9
COMPETITIVE SCENARIO
15.9.2
OTHER DEVELOPMENTS
16
COMPANY PROFILES
In-depth Company Profiles of Leading Market Players with detailed Business Overview, Product and Service Portfolio, Recent Developments, and Unique Analyst Perspective (MnM View)
281
16.1.1
THERMO FISHER SCIENTIFIC INC.
16.1.1.1
BUSINESS OVERVIEW
16.1.1.2
PRODUCTS/SOLUTIONS/SERVICES OFFERED
16.1.1.3
RECENT DEVELOPMENTS
16.1.1.3.1
PRODUCT LAUNCHES & UPGRADES
16.1.1.4.2
STRATEGIC CHOICES
16.1.1.4.3
WEAKNESSES AND COMPETITIVE THREATS
16.1.2
LABVANTAGE SOLUTIONS INC.
16.1.4
STARLIMS CORPORATION
16.1.5
AGILENT TECHNOLOGIES, INC.
16.1.6
WATERS CORPORATION
16.1.14
NOVATEK INTERNATIONAL
16.1.15
AGARAM TECHNOLOGIES PVT. LTD.
16.1.17
CALIBER TECHNOLOGIES
16.2.3
L7 INFORMATICS, INC.
17
RESEARCH METHODOLOGY
369
17.1.1
SECONDARY RESEARCH
17.1.1.1
KEY DATA FROM SECONDARY SOURCES
17.1.2.1
KEY DATA FROM PRIMARY SOURCES
17.1.2.2
INSIGHTS FROM PRIMARY EXPERTS
17.2
RESEARCH METHODOLOGY DESIGN
17.3
MARKET SIZE ESTIMATION
17.4
MARKET BREAKDOWN DATA TRIANGULATION
17.5
MARKET SHARE ESTIMATION
17.7.1
SCOPE-RELATED LIMITATIONS
17.7.2
METHODOLOGY-RELATED LIMITATIONS
18.2
KNOWLEDGESTORE: MARKETSANDMARKETS’ SUBSCRIPTION PORTAL
18.3
CUSTOMIZATION OPTIONS
TABLE 1
USD EXCHANGE RATES
TABLE 2
LABORATORY SOFTWARE MARKET: PORTER'S FIVE FORCES ANALYSIS
TABLE 3
LABORATORY SOFTWARE MARKET: ROLE IN ECOSYSTEM
TABLE 4
INDICATIVE PRICE FOR LABORATORY SOFTWARE MARKET, BY OFFERING (2025)
TABLE 5
INDICATIVE PRICE FOR LABORATORY SOFTWARE MARKET, BY REGION (2025)
TABLE 6
LABORATORY SOFTWARE MARKET: KEY CONFERENCES AND EVENTS (2026–2027)
TABLE 7
CASE 1: IMPROVING BIOANALYTICAL AND CLINICAL LABORATORY DATA MANAGEMENT
TABLE 8
CASE 2: TRANSITION FROM IN-HOUSE LIMS TO VALIDATED LABORATORY SOFTWARE PLATFORM
TABLE 9
CASE 3: SCALING LIMS + ELN ACROSS MULTIPLE CRO SITES
TABLE 10
CASE 4: CONSOLIDATING LEGACY LIMS ACROSS HOSPITAL PATHOLOGY SERVICES
TABLE 11
US ADJUSTED RECIPROCAL TARIFF RATES
TABLE 12
LABORATORY SOFTWARE MARKET: KEY PATENTS
TABLE 13
NORTH AMERICA: REGULATORY BODIES, GOVERNMENT AGENCIES, AND OTHER ORGANIZATIONS
TABLE 14
EUROPE: REGULATORY BODIES, GOVERNMENT AGENCIES, AND OTHER ORGANIZATIONS
TABLE 15
ASIA PACIFIC: REGULATORY BODIES, GOVERNMENT AGENCIES, AND OTHER ORGANIZATIONS
TABLE 16
LATIN AMERICA: REGULATORY BODIES, GOVERNMENT AGENCIES, AND OTHER ORGANIZATIONS
TABLE 17
MIDDLE EAST & AFRICA: REGULATORY BODIES, GOVERNMENT AGENCIES, AND OTHER ORGANIZATIONS
TABLE 18
REGULATORY SCENARIO IN NORTH AMERICA
TABLE 19
REGULATORY SCENARIO IN EUROPE
TABLE 20
REGULATORY SCENARIO IN ASIA PACIFIC
TABLE 21
REGULATORY SCENARIO IN LATIN AMERICA
TABLE 22
REGULATORY SCENARIO IN MIDDLE EAST & AFRICA
TABLE 23
INFLUENCE OF STAKEHOLDERS ON BUYING PROCESS FOR TOP THREE END USERS
TABLE 24
BUYING CRITERIA FOR TOP THREE END USERS
TABLE 25
UNMET NEEDS IN LABORATORY SOFTWARE MARKET
TABLE 26
END USER EXPECTATIONS IN LABORATORY SOFTWARE MARKET
TABLE 27
LABORATORY SOFTWARE MARKET, BY SOLUTION TYPE, 2024–2031 (USD MILLION)
TABLE 28
LABORATORY SOFTWARE MARKET FOR LIMS, BY TYPE, 2024–2031 (USD MILLION)
TABLE 29
LABORATORY SOFTWARE MARKET FOR LIMS, BY REGION, 2024–2031 (USD MILLION)
TABLE 30
LABORATORY SOFTWARE MARKET FOR BROAD-BASED LIMS, BY REGION, 2024–2031 (USD MILLION)
TABLE 31
LABORATORY SOFTWARE MARKET FOR INDUSTRY-SPECIFIC LIMS, BY REGION, 2024–2031 (USD MILLION)
TABLE 32
LABORATORY SOFTWARE MARKET FOR ELECTRONIC LAB NOTEBOOKS, BY REGION, 2024–2031 (USD MILLION)
TABLE 33
LABORATORY SOFTWARE MARKET FOR CHROMATOGRAPHY DATA SYSTEMS, BY REGION, 2024–2031 (USD MILLION)
TABLE 34
LABORATORY SOFTWARE MARKET FOR ELECTRONIC DATA CAPTURE & CLINICAL DATA MANAGEMENT SYSTEMS, BY REGION, 2024–2031 (USD MILLION)
TABLE 35
LABORATORY SOFTWARE MARKET FOR LABORATORY EXECUTION SYSTEMS, BY REGION, 2024–2031 (USD MILLION)
TABLE 36
LABORATORY SOFTWARE MARKET FOR QUALITY MANAGEMENT SYSTEMS, BY REGION, 2024–2031 (USD MILLION)
TABLE 37
LABORATORY SOFTWARE MARKET FOR SCIENTIFIC DATA MANAGEMENT SYSTEMS, BY REGION, 2024–2031 (USD MILLION)
TABLE 38
LABORATORY SOFTWARE MARKET FOR OTHER SOLUTION TYPES, BY REGION, 2024–2031 (USD MILLION)
TABLE 39
LABORATORY SOFTWARE MARKET, BY COMPONENT, 2024–2031 (USD MILLION)
TABLE 40
LABORATORY SOFTWARE MARKET FOR SOFTWARE, BY REGION, 2024–2031 (USD MILLION)
TABLE 41
LABORATORY SOFTWARE MARKET FOR SERVICES, BY REGION, 2024–2031 (USD MILLION)
TABLE 42
LABORATORY SOFTWARE MARKET FOR SUPPORT, BY REGION, 2024–2031 (USD MILLION)
TABLE 43
LABORATORY SOFTWARE MARKET, BY TECHNOLOGY MATURITY, 2024–2031 (USD MILLION)
TABLE 44
LABORATORY SOFTWARE MARKET FOR AI-ENABLED LABORATORY SOFTWARE BY REGION, 2024–2031 (USD MILLION)
TABLE 45
LABORATORY SOFTWARE MARKET, FOR NON-AI-ENABLED/CONVENTIONAL LABORATORY SOFTWARE, BY REGION, 2024–2031 (USD MILLION)
TABLE 46
LABORATORY SOFTWARE MARKET, BY FUNCTION, 2024–2031 (USD MILLION)
TABLE 47
LABORATORY SOFTWARE MARKET FOR SAMPLE & WORKFLOW MANAGEMENT, BY REGION, 2024–2031 (USD MILLION)
TABLE 48
LABORATORY SOFTWARE MARKET FOR EXPERIMENT EXECUTION & DATA MANAGEMENT, BY REGION, 2024–2031 (USD MILLION)
TABLE 49
LABORATORY SOFTWARE MARKET FOR DATA STORAGE & LIFECYCLE MANAGEMENT, BY REGION, 2024–2031 (USD MILLION)
TABLE 50
LABORATORY SOFTWARE MARKET FOR QUALITY & COMPLIANCE CONTROL, BY REGION, 2024–2031 (USD MILLION)
TABLE 51
LABORATORY SOFTWARE MARKET FOR ANALYTICS & INTERPRETATION, BY REGION, 2024–2031 (USD MILLION)
TABLE 52
LABORATORY SOFTWARE MARKET FOR INVENTORY & ASSET MANAGEMENT, BY REGION, 2024–2031 (USD MILLION)
TABLE 53
LABORATORY SOFTWARE MARKET FOR REPORTING & REGULATORY SUBMISSION, BY REGION, 2024–2031 (USD MILLION)
TABLE 54
LABORATORY SOFTWARE MARKET, BY INDUSTRY, 2024–2031 (USD MILLION)
TABLE 55
LABORATORY SOFTWARE MARKET FOR LIFE SCIENCE, BY TYPE, 2024–2031 (USD MILLION)
TABLE 56
LABORATORY SOFTWARE MARKET FOR LIFE SCIENCE, BY REGION, 2024–2031 (USD MILLION)
TABLE 57
LABORATORY SOFTWARE MARKET FOR PHARMACEUTICAL & BIOTECHNOLOGY COMPANIES, BY REGION, 2024–2031 (USD MILLION)
TABLE 58
LABORATORY SOFTWARE MARKET FOR CONTRACT SERVICE ORGANIZATIONS, BY REGION, 2024–2031 (USD MILLION)
TABLE 59
LABORATORY SOFTWARE MARKET FOR BIOBANKS & BIOREPOSITORIES, BY REGION, 2024–2031 (USD MILLION)
TABLE 60
LABORATORY SOFTWARE MARKET FOR CLINICAL & MOLECULAR DIAGNOSTICS LABORATORIES, BY REGION, 2024–2031 (USD MILLION)
TABLE 61
LABORATORY SOFTWARE MARKET FOR ACADEMIC & GOVERNMENT RESEARCH INSTITUTES, BY REGION, 2024–2031 (USD MILLION)
TABLE 62
LABORATORY SOFTWARE MARKET FOR NGS/GENOMIC LABORATORIES, BY REGION, 2024–2031 (USD MILLION)
TABLE 63
LABORATORY SOFTWARE MARKET FOR TOXICOLOGY LABORATORIES, BY REGION, 2024–2031 (USD MILLION)
TABLE 64
LABORATORY SOFTWARE MARKET FOR FOOD & BEVERAGE AND AGRICULTURE, BY REGION, 2024–2031 (USD MILLION)
TABLE 65
LABORATORY SOFTWARE MARKET FOR PETROCHEMICAL AND OIL & GAS, BY REGION, 2024–2031 (USD MILLION)
TABLE 66
LABORATORY SOFTWARE MARKET FOR CHEMICALS, BY REGION, 2024–2031 (USD MILLION)
TABLE 67
LABORATORY SOFTWARE MARKET FOR ENVIRONMENTAL TESTING LABORATORIES, BY REGION, 2024–2031 (USD MILLION)
TABLE 68
LABORATORY SOFTWARE MARKET FOR FORENSICS, BY REGION, 2024–2031 (USD MILLION)
TABLE 69
LABORATORY SOFTWARE MARKET FOR OTHER INDUSTRIES, BY REGION, 2024–2031 (USD MILLION)
TABLE 70
LABORATORY SOFTWARE MARKET, BY REGION, 2024–2031 (USD MILLION)
TABLE 71
NORTH AMERICA: LABORATORY SOFTWARE MARKET, BY COUNTRY, 2024–2031 (USD MILLION)
TABLE 72
NORTH AMERICA: LABORATORY SOFTWARE MARKET, BY SOLUTION TYPE, 2024–2031 (USD MILLION)
TABLE 73
NORTH AMERICA: LABORATORY SOFTWARE MARKET FOR LIMS, BY TYPE, 2024–2031 (USD MILLION)
TABLE 74
NORTH AMERICA: LABORATORY SOFTWARE MARKET, BY COMPONENT, 2024–2031 (USD MILLION)
TABLE 75
NORTH AMERICA: LABORATORY SOFTWARE MARKET, BY TECHNOLOGY MATURITY, 2024–2031 (USD MILLION)
TABLE 76
NORTH AMERICA: LABORATORY SOFTWARE MARKET, BY FUNCTION, 2024–2031 (USD MILLION)
TABLE 77
NORTH AMERICA: LABORATORY SOFTWARE MARKET, BY INDUSTRY, 2024–2031 (USD MILLION)
TABLE 78
NORTH AMERICA: LABORATORY SOFTWARE MARKET FOR LIFE SCIENCE, BY TYPE, 2024–2031 (USD MILLION)
TABLE 79
US: LABORATORY SOFTWARE MARKET, BY SOLUTION TYPE, 2024–2031 (USD MILLION)
TABLE 80
US: LABORATORY SOFTWARE MARKET FOR LIMS, BY TYPE, 2024–2031 (USD MILLION)
TABLE 81
US: LABORATORY SOFTWARE MARKET, BY COMPONENT, 2024–2031 (USD MILLION)
TABLE 82
US: LABORATORY SOFTWARE MARKET, BY TECHNOLOGY MATURITY, 2024–2031 (USD MILLION)
TABLE 83
US: LABORATORY SOFTWARE MARKET, BY FUNCTION, 2024–2031 (USD MILLION)
TABLE 84
US: LABORATORY SOFTWARE MARKET, BY INDUSTRY, 2024–2031 (USD MILLION)
TABLE 85
US: LABORATORY SOFTWARE MARKET FOR LIFE SCIENCE, BY TYPE, 2024–2031 (USD MILLION)
TABLE 86
CANADA: LABORATORY SOFTWARE MARKET, BY SOLUTION TYPE, 2024–2031 (USD MILLION)
TABLE 87
CANADA: LABORATORY SOFTWARE MARKET FOR LIMS, BY TYPE, 2024–2031 (USD MILLION)
TABLE 88
CANADA: LABORATORY SOFTWARE MARKET, BY COMPONENT, 2024–2031 (USD MILLION)
TABLE 89
CANADA: LABORATORY SOFTWARE MARKET, BY TECHNOLOGY MATURITY, 2024–2031 (USD MILLION)
TABLE 90
CANADA: LABORATORY SOFTWARE MARKET, BY FUNCTION, 2024–2031 (USD MILLION)
TABLE 91
CANADA: LABORATORY SOFTWARE MARKET, BY INDUSTRY, 2024–2031 (USD MILLION)
TABLE 92
CANADA: LABORATORY SOFTWARE MARKET FOR LIFE SCIENCE, BY TYPE, 2024–2031 (USD MILLION)
TABLE 93
EUROPE: LABORATORY SOFTWARE MARKET, BY COUNTRY, 2024–2031 (USD MILLION)
TABLE 94
EUROPE: LABORATORY SOFTWARE MARKET, BY SOLUTION TYPE, 2024–2031 (USD MILLION)
TABLE 95
EUROPE: LABORATORY SOFTWARE MARKET FOR LIMS, BY TYPE, 2024–2031 (USD MILLION)
TABLE 96
EUROPE: LABORATORY SOFTWARE MARKET, BY COMPONENT, 2024–2031 (USD MILLION)
TABLE 97
EUROPE: LABORATORY SOFTWARE MARKET, BY TECHNOLOGY MATURITY, 2024–2031 (USD MILLION)
TABLE 98
EUROPE: LABORATORY SOFTWARE MARKET, BY FUNCTION, 2024–2031 (USD MILLION)
TABLE 99
EUROPE: LABORATORY SOFTWARE MARKET, BY INDUSTRY, 2024–2031 (USD MILLION)
TABLE 100
EUROPE: LABORATORY SOFTWARE MARKET FOR LIFE SCIENCE, BY TYPE, 2024–2031 (USD MILLION)
TABLE 101
GERMANY: LABORATORY SOFTWARE MARKET, BY SOLUTION TYPE, 2024–2031 (USD MILLION)
TABLE 102
GERMANY: LABORATORY SOFTWARE MARKET FOR LIMS, BY TYPE, 2024–2031 (USD MILLION)
TABLE 103
GERMANY: LABORATORY SOFTWARE MARKET, BY COMPONENT, 2024–2031 (USD MILLION)
TABLE 104
GERMANY: LABORATORY SOFTWARE MARKET, BY TECHNOLOGY MATURITY, 2024–2031 (USD MILLION)
TABLE 105
GERMANY: LABORATORY SOFTWARE MARKET, BY FUNCTION, 2024–2031 (USD MILLION)
TABLE 106
GERMANY: LABORATORY SOFTWARE MARKET, BY INDUSTRY, 2024–2031 (USD MILLION)
TABLE 107
GERMANY: LABORATORY SOFTWARE MARKET FOR LIFE SCIENCE, BY TYPE, 2024–2031 (USD MILLION)
TABLE 108
FRANCE: LABORATORY SOFTWARE MARKET, BY SOLUTION TYPE, 2024–2031 (USD MILLION)
TABLE 109
FRANCE: LABORATORY SOFTWARE MARKET FOR LIMS, BY TYPE, 2024–2031 (USD MILLION)
TABLE 110
FRANCE: LABORATORY SOFTWARE MARKET, BY COMPONENT, 2024–2031 (USD MILLION)
TABLE 111
FRANCE: LABORATORY SOFTWARE MARKET, BY TECHNOLOGY MATURITY, 2024–2031 (USD MILLION)
TABLE 112
FRANCE: LABORATORY SOFTWARE MARKET, BY FUNCTION, 2024–2031 (USD MILLION)
TABLE 113
FRANCE: LABORATORY SOFTWARE MARKET, BY INDUSTRY, 2024–2031 (USD MILLION)
TABLE 114
FRANCE: LABORATORY SOFTWARE MARKET FOR LIFE SCIENCE, BY TYPE, 2024–2031 (USD MILLION)
TABLE 115
UK: LABORATORY SOFTWARE MARKET, BY SOLUTION TYPE, 2024–2031 (USD MILLION)
TABLE 116
UK: LABORATORY SOFTWARE MARKET FOR LIMS, BY TYPE, 2024–2031 (USD MILLION)
TABLE 117
UK: LABORATORY SOFTWARE MARKET, BY COMPONENT, 2024–2031 (USD MILLION)
TABLE 118
UK: LABORATORY SOFTWARE MARKET, BY TECHNOLOGY MATURITY, 2024–2031 (USD MILLION)
TABLE 119
UK: LABORATORY SOFTWARE MARKET, BY FUNCTION, 2024–2031 (USD MILLION)
TABLE 120
UK: LABORATORY SOFTWARE MARKET, BY INDUSTRY, 2024–2031 (USD MILLION)
TABLE 121
UK: LABORATORY SOFTWARE MARKET FOR LIFE SCIENCE, BY TYPE, 2024–2031 (USD MILLION)
TABLE 122
ITALY: LABORATORY SOFTWARE MARKET, BY SOLUTION TYPE, 2024–2031 (USD MILLION)
TABLE 123
ITALY: LABORATORY SOFTWARE MARKET FOR LIMS, BY TYPE, 2024–2031 (USD MILLION)
TABLE 124
ITALY: LABORATORY SOFTWARE MARKET, BY COMPONENT, 2024–2031 (USD MILLION)
TABLE 125
ITALY: LABORATORY SOFTWARE MARKET, BY TECHNOLOGY MATURITY, 2024–2031 (USD MILLION)
TABLE 126
ITALY: LABORATORY SOFTWARE MARKET, BY FUNCTION, 2024–2031 (USD MILLION)
TABLE 127
ITALY: LABORATORY SOFTWARE MARKET, BY INDUSTRY, 2024–2031 (USD MILLION)
TABLE 128
ITALY: LABORATORY SOFTWARE MARKET FOR LIFE SCIENCE, BY TYPE, 2024–2031 (USD MILLION)
TABLE 129
SPAIN: LABORATORY SOFTWARE MARKET, BY SOLUTION TYPE, 2024–2031 (USD MILLION)
TABLE 130
SPAIN: LABORATORY SOFTWARE MARKET FOR LIMS, BY TYPE, 2024–2031 (USD MILLION)
TABLE 131
SPAIN: LABORATORY SOFTWARE MARKET, BY COMPONENT, 2024–2031 (USD MILLION)
TABLE 132
SPAIN: LABORATORY SOFTWARE MARKET, BY TECHNOLOGY MATURITY, 2024–2031 (USD MILLION)
TABLE 133
SPAIN: LABORATORY SOFTWARE MARKET, BY FUNCTION, 2024–2031 (USD MILLION)
TABLE 134
SPAIN: LABORATORY SOFTWARE MARKET, BY INDUSTRY, 2024–2031 (USD MILLION)
TABLE 135
SPAIN: LABORATORY SOFTWARE MARKET FOR LIFE SCIENCE, BY TYPE, 2024–2031 (USD MILLION)
TABLE 136
REST OF EUROPE: LABORATORY SOFTWARE MARKET, BY SOLUTION TYPE, 2024–2031 (USD MILLION)
TABLE 137
REST OF EUROPE: LABORATORY SOFTWARE MARKET FOR LIMS, BY TYPE, 2024–2031 (USD MILLION)
TABLE 138
REST OF EUROPE: LABORATORY SOFTWARE MARKET, BY COMPONENT, 2024–2031 (USD MILLION)
TABLE 139
REST OF EUROPE: LABORATORY SOFTWARE MARKET, BY TECHNOLOGY MATURITY, 2024–2031 (USD MILLION)
TABLE 140
REST OF EUROPE: LABORATORY SOFTWARE MARKET, BY FUNCTION, 2024–2031 (USD MILLION)
TABLE 141
REST OF EUROPE: LABORATORY SOFTWARE MARKET, BY INDUSTRY, 2024–2031 (USD MILLION)
TABLE 142
REST OF EUROPE: LABORATORY SOFTWARE MARKET FOR LIFE SCIENCE, BY TYPE, 2024–2031 (USD MILLION)
TABLE 143
ASIA PACIFIC: LABORATORY SOFTWARE MARKET, BY COUNTRY, 2024–2031 (USD MILLION)
TABLE 144
ASIA PACIFIC: LABORATORY SOFTWARE MARKET, BY SOLUTION TYPE, 2024–2031 (USD MILLION)
TABLE 145
ASIA PACIFIC: LABORATORY SOFTWARE MARKET FOR LIMS, BY TYPE, 2024–2031 (USD MILLION)
TABLE 146
ASIA PACIFIC: LABORATORY SOFTWARE MARKET, BY COMPONENT, 2024–2031 (USD MILLION)
TABLE 147
ASIA PACIFIC: LABORATORY SOFTWARE MARKET, BY TECHNOLOGY MATURITY, 2024–2031 (USD MILLION)
TABLE 148
ASIA PACIFIC: LABORATORY SOFTWARE MARKET, BY FUNCTION, 2024–2031 (USD MILLION)
TABLE 149
ASIA PACIFIC: LABORATORY SOFTWARE MARKET, BY INDUSTRY, 2024–2031 (USD MILLION)
TABLE 150
ASIA PACIFIC: LABORATORY SOFTWARE MARKET FOR LIFE SCIENCE, BY TYPE, 2024–2031 (USD MILLION)
TABLE 151
CHINA: LABORATORY SOFTWARE MARKET, BY SOLUTION TYPE, 2024–2031 (USD MILLION)
TABLE 152
CHINA: LABORATORY SOFTWARE MARKET FOR LIMS, BY TYPE, 2024–2031 (USD MILLION)
TABLE 153
CHINA: LABORATORY SOFTWARE MARKET, BY COMPONENT, 2024–2031 (USD MILLION)
TABLE 154
CHINA: LABORATORY SOFTWARE MARKET, BY TECHNOLOGY MATURITY, 2024–2031 (USD MILLION)
TABLE 155
CHINA: LABORATORY SOFTWARE MARKET, BY FUNCTION, 2024–2031 (USD MILLION)
TABLE 156
CHINA: LABORATORY SOFTWARE MARKET, BY INDUSTRY, 2024–2031 (USD MILLION)
TABLE 157
CHINA: LABORATORY SOFTWARE MARKET FOR LIFE SCIENCE, BY TYPE, 2024–2031 (USD MILLION)
TABLE 158
JAPAN: LABORATORY SOFTWARE MARKET, BY SOLUTION TYPE, 2024–2031 (USD MILLION)
TABLE 159
JAPAN: LABORATORY SOFTWARE MARKET FOR LIMS, BY TYPE, 2024–2031 (USD MILLION)
TABLE 160
JAPAN: LABORATORY SOFTWARE MARKET, BY COMPONENT, 2024–2031 (USD MILLION)
TABLE 161
JAPAN: LABORATORY SOFTWARE MARKET, BY TECHNOLOGY MATURITY, 2024–2031 (USD MILLION)
TABLE 162
JAPAN: LABORATORY SOFTWARE MARKET, BY FUNCTION, 2024–2031 (USD MILLION)
TABLE 163
JAPAN: LABORATORY SOFTWARE MARKET, BY INDUSTRY, 2024–2031 (USD MILLION)
TABLE 164
JAPAN: LABORATORY SOFTWARE MARKET FOR LIFE SCIENCE, BY TYPE, 2024–2031 (USD MILLION)
TABLE 165
INDIA: LABORATORY SOFTWARE MARKET, BY SOLUTION TYPE, 2024–2031 (USD MILLION)
TABLE 166
INDIA: LABORATORY SOFTWARE MARKET FOR LIMS, BY TYPE, 2024–2031 (USD MILLION)
TABLE 167
INDIA: LABORATORY SOFTWARE MARKET, BY COMPONENT, 2024–2031 (USD MILLION)
TABLE 168
INDIA: LABORATORY SOFTWARE MARKET, BY TECHNOLOGY MATURITY, 2024–2031 (USD MILLION)
TABLE 169
INDIA: LABORATORY SOFTWARE MARKET, BY FUNCTION, 2024–2031 (USD MILLION)
TABLE 170
INDIA: LABORATORY SOFTWARE MARKET, BY INDUSTRY, 2024–2031 (USD MILLION)
TABLE 171
INDIA: LABORATORY SOFTWARE MARKET FOR LIFE SCIENCE, BY TYPE, 2024–2031 (USD MILLION)
TABLE 172
AUSTRALIA: LABORATORY SOFTWARE MARKET, BY SOLUTION TYPE, 2024–2031 (USD MILLION)
TABLE 173
AUSTRALIA: LABORATORY SOFTWARE MARKET FOR LIMS, BY TYPE, 2024–2031 (USD MILLION)
TABLE 174
AUSTRALIA: LABORATORY SOFTWARE MARKET, BY COMPONENT, 2024–2031 (USD MILLION)
TABLE 175
AUSTRALIA: LABORATORY SOFTWARE MARKET, BY TECHNOLOGY MATURITY, 2024–2031 (USD MILLION)
TABLE 176
AUSTRALIA: LABORATORY SOFTWARE MARKET, BY FUNCTION, 2024–2031 (USD MILLION)
TABLE 177
AUSTRALIA: LABORATORY SOFTWARE MARKET, BY INDUSTRY, 2024–2031 (USD MILLION)
TABLE 178
AUSTRALIA: LABORATORY SOFTWARE MARKET FOR LIFE SCIENCE, BY TYPE, 2024–2031 (USD MILLION)
TABLE 179
SOUTH KOREA: LABORATORY SOFTWARE MARKET, BY SOLUTION TYPE, 2024–2031 (USD MILLION)
TABLE 180
SOUTH KOREA: LABORATORY SOFTWARE MARKET FOR LIMS, BY TYPE, 2024–2031 (USD MILLION)
TABLE 181
SOUTH KOREA: LABORATORY SOFTWARE MARKET, BY COMPONENT, 2024–2031 (USD MILLION)
TABLE 182
SOUTH KOREA: LABORATORY SOFTWARE MARKET, BY TECHNOLOGY MATURITY, 2024–2031 (USD MILLION)
TABLE 183
SOUTH KOREA: LABORATORY SOFTWARE MARKET, BY FUNCTION, 2024–2031 (USD MILLION)
TABLE 184
SOUTH KOREA: LABORATORY SOFTWARE MARKET, BY INDUSTRY, 2024–2031 (USD MILLION)
TABLE 185
SOUTH KOREA: LABORATORY SOFTWARE MARKET FOR LIFE SCIENCE, BY TYPE, 2024–2031 (USD MILLION)
TABLE 186
REST OF ASIA PACIFIC: LABORATORY SOFTWARE MARKET, BY SOLUTION TYPE, 2024–2031 (USD MILLION)
TABLE 187
REST OF ASIA PACIFIC: LABORATORY SOFTWARE MARKET FOR LIMS, BY TYPE, 2024–2031 (USD MILLION)
TABLE 188
REST OF ASIA PACIFIC: LABORATORY SOFTWARE MARKET, BY COMPONENT, 2024–2031 (USD MILLION)
TABLE 189
REST OF ASIA PACIFIC: LABORATORY SOFTWARE MARKET, BY TECHNOLOGY MATURITY, 2024–2031 (USD MILLION)
TABLE 190
REST OF ASIA PACIFIC: LABORATORY SOFTWARE MARKET, BY FUNCTION, 2024–2031 (USD MILLION)
TABLE 191
REST OF ASIA PACIFIC: LABORATORY SOFTWARE MARKET, BY INDUSTRY, 2024–2031 (USD MILLION)
TABLE 192
REST OF ASIA PACIFIC: LABORATORY SOFTWARE MARKET FOR LIFE SCIENCE, BY TYPE, 2024–2031 (USD MILLION)
TABLE 193
LATIN AMERICA: LABORATORY SOFTWARE MARKET, BY COUNTRY, 2024–2031 (USD MILLION)
TABLE 194
LATIN AMERICA: LABORATORY SOFTWARE MARKET, BY SOLUTION TYPE, 2024–2031 (USD MILLION)
TABLE 195
LATIN AMERICA: LABORATORY SOFTWARE MARKET FOR LIMS, BY TYPE, 2024–2031 (USD MILLION)
TABLE 196
LATIN AMERICA: LABORATORY SOFTWARE MARKET, BY COMPONENT, 2024–2031 (USD MILLION)
TABLE 197
LATIN AMERICA: LABORATORY SOFTWARE MARKET, BY TECHNOLOGY MATURITY, 2024–2031 (USD MILLION)
TABLE 198
LATIN AMERICA: LABORATORY SOFTWARE MARKET, BY FUNCTION, 2024–2031 (USD MILLION)
TABLE 199
LATIN AMERICA: LABORATORY SOFTWARE MARKET, BY INDUSTRY, 2024–2031 (USD MILLION)
TABLE 200
LATIN AMERICA: LABORATORY SOFTWARE MARKET FOR LIFE SCIENCE, BY TYPE, 2024–2031 (USD MILLION)
TABLE 201
BRAZIL: LABORATORY SOFTWARE MARKET, BY SOLUTION TYPE, 2024–2031 (USD MILLION)
TABLE 202
BRAZIL: LABORATORY SOFTWARE MARKET FOR LIMS, BY TYPE, 2024–2031 (USD MILLION)
TABLE 203
BRAZIL: LABORATORY SOFTWARE MARKET, BY COMPONENT, 2024–2031 (USD MILLION)
TABLE 204
BRAZIL: LABORATORY SOFTWARE MARKET, BY TECHNOLOGY MATURITY, 2024–2031 (USD MILLION)
TABLE 205
BRAZIL: LABORATORY SOFTWARE MARKET, BY FUNCTION, 2024–2031 (USD MILLION)
TABLE 206
BRAZIL: LABORATORY SOFTWARE MARKET, BY INDUSTRY, 2024–2031 (USD MILLION)
TABLE 207
BRAZIL: LABORATORY SOFTWARE MARKET FOR LIFE SCIENCE, BY TYPE, 2024–2031 (USD MILLION)
TABLE 208
MEXICO: LABORATORY SOFTWARE MARKET, BY SOLUTION TYPE, 2024–2031 (USD MILLION)
TABLE 209
MEXICO: LABORATORY SOFTWARE MARKET FOR LIMS, BY TYPE, 2024–2031 (USD MILLION)
TABLE 210
MEXICO: LABORATORY SOFTWARE MARKET, BY COMPONENT, 2024–2031 (USD MILLION)
TABLE 211
MEXICO: LABORATORY SOFTWARE MARKET, BY TECHNOLOGY MATURITY, 2024–2031 (USD MILLION)
TABLE 212
MEXICO: LABORATORY SOFTWARE MARKET, BY FUNCTION, 2024–2031 (USD MILLION)
TABLE 213
MEXICO: LABORATORY SOFTWARE MARKET, BY INDUSTRY, 2024–2031 (USD MILLION)
TABLE 214
MEXICO: LABORATORY SOFTWARE MARKET FOR LIFE SCIENCE, BY TYPE, 2024–2031 (USD MILLION)
TABLE 215
REST OF LATIN AMERICA: LABORATORY SOFTWARE MARKET, BY SOLUTION TYPE, 2024–2031 (USD MILLION)
TABLE 216
REST OF LATIN AMERICA: LABORATORY SOFTWARE MARKET FOR LIMS, BY TYPE, 2024–2031 (USD MILLION)
TABLE 217
REST OF LATIN AMERICA: LABORATORY SOFTWARE MARKET, BY COMPONENT, 2024–2031 (USD MILLION)
TABLE 218
REST OF LATIN AMERICA: LABORATORY SOFTWARE MARKET, BY TECHNOLOGY MATURITY, 2024–2031 (USD MILLION)
TABLE 219
REST OF LATIN AMERICA: LABORATORY SOFTWARE MARKET, BY FUNCTION, 2024–2031 (USD MILLION)
TABLE 220
REST OF LATIN AMERICA: LABORATORY SOFTWARE MARKET, BY INDUSTRY, 2024–2031 (USD MILLION)
TABLE 221
REST OF LATIN AMERICA: LABORATORY SOFTWARE MARKET FOR LIFE SCIENCE, BY TYPE, 2024–2031 (USD MILLION)
TABLE 222
MIDDLE EAST & AFRICA: LABORATORY SOFTWARE MARKET, BY COUNTRY, 2024–2031 (USD MILLION)
TABLE 223
MIDDLE EAST & AFRICA: LABORATORY SOFTWARE MARKET, BY SOLUTION TYPE, 2024–2031 (USD MILLION)
TABLE 224
MIDDLE EAST & AFRICA: LABORATORY SOFTWARE MARKET FOR LIMS, BY TYPE, 2024–2031 (USD MILLION)
TABLE 225
MIDDLE EAST & AFRICA: LABORATORY SOFTWARE MARKET, BY COMPONENT, 2024–2031 (USD MILLION)
TABLE 226
MIDDLE EAST & AFRICA: LABORATORY SOFTWARE MARKET, BY TECHNOLOGY MATURITY, 2024–2031 (USD MILLION)
TABLE 227
MIDDLE EAST & AFRICA: LABORATORY SOFTWARE MARKET, BY FUNCTION, 2024–2031 (USD MILLION)
TABLE 228
MIDDLE EAST & AFRICA: LABORATORY SOFTWARE MARKET, BY INDUSTRY, 2024–2031 (USD MILLION)
TABLE 229
MIDDLE EAST & AFRICA: LABORATORY SOFTWARE MARKET FOR LIFE SCIENCE, BY TYPE, 2024–2031 (USD MILLION)
TABLE 230
GCC COUNTRIES: LABORATORY SOFTWARE MARKET, BY COUNTRY, 2024–2031 (USD MILLION)
TABLE 231
GCC COUNTRIES: LABORATORY SOFTWARE MARKET, BY SOLUTION TYPE, 2024–2031 (USD MILLION)
TABLE 232
GCC COUNTRIES: LABORATORY SOFTWARE MARKET FOR LIMS, BY TYPE, 2024–2031 (USD MILLION)
TABLE 233
GCC COUNTRIES: LABORATORY SOFTWARE MARKET, BY COMPONENT, 2024–2031 (USD MILLION)
TABLE 234
GCC COUNTRIES: LABORATORY SOFTWARE MARKET, BY TECHNOLOGY MATURITY, 2024–2031 (USD MILLION)
TABLE 235
GCC COUNTRIES: LABORATORY SOFTWARE MARKET, BY FUNCTION, 2024–2031 (USD MILLION)
TABLE 236
GCC COUNTRIES: LABORATORY SOFTWARE MARKET, BY INDUSTRY, 2024–2031 (USD MILLION)
TABLE 237
GCC COUNTRIES: LABORATORY SOFTWARE MARKET FOR LIFE SCIENCE, BY TYPE, 2024–2031 (USD MILLION)
TABLE 238
SAUDI ARABIA: LABORATORY SOFTWARE MARKET, BY SOLUTION TYPE, 2024–2031 (USD MILLION)
TABLE 239
SAUDI ARABIA: LABORATORY SOFTWARE MARKET FOR LIMS, BY TYPE, 2024–2031 (USD MILLION)
TABLE 240
SAUDI ARABIA: LABORATORY SOFTWARE MARKET, BY COMPONENT, 2024–2031 (USD MILLION)
TABLE 241
SAUDI ARABIA: LABORATORY SOFTWARE MARKET, BY TECHNOLOGY MATURITY, 2024–2031 (USD MILLION)
TABLE 242
SAUDI ARABIA: LABORATORY SOFTWARE MARKET, BY FUNCTION, 2024–2031 (USD MILLION)
TABLE 243
SAUDI ARABIA: LABORATORY SOFTWARE MARKET, BY INDUSTRY, 2024–2031 (USD MILLION)
TABLE 244
SAUDI ARABIA: LABORATORY SOFTWARE MARKET FOR LIFE SCIENCE, BY TYPE, 2024–2031 (USD MILLION)
TABLE 245
UAE: LABORATORY SOFTWARE MARKET, BY SOLUTION TYPE, 2024–2031 (USD MILLION)
TABLE 246
UAE: LABORATORY SOFTWARE MARKET FOR LIMS, BY TYPE, 2024–2031 (USD MILLION)
TABLE 247
UAE: LABORATORY SOFTWARE MARKET, BY COMPONENT, 2024–2031 (USD MILLION)
TABLE 248
UAE: LABORATORY SOFTWARE MARKET, BY TECHNOLOGY MATURITY, 2024–2031 (USD MILLION)
TABLE 249
UAE: LABORATORY SOFTWARE MARKET, BY FUNCTION, 2024–2031 (USD MILLION)
TABLE 250
UAE: LABORATORY SOFTWARE MARKET, BY INDUSTRY, 2024–2031 (USD MILLION)
TABLE 251
UAE: LABORATORY SOFTWARE MARKET FOR LIFE SCIENCE, BY TYPE, 2024–2031 (USD MILLION)
TABLE 252
OTHER GCC COUNTRIES: LABORATORY SOFTWARE MARKET, BY SOLUTION TYPE, 2024–2031 (USD MILLION)
TABLE 253
OTHER GCC COUNTRIES: LABORATORY SOFTWARE MARKET FOR LIMS, BY TYPE, 2024–2031 (USD MILLION)
TABLE 254
OTHER GCC COUNTRIES: LABORATORY SOFTWARE MARKET, BY COMPONENT, 2024–2031 (USD MILLION)
TABLE 255
OTHER GCC COUNTRIES: LABORATORY SOFTWARE MARKET, BY TECHNOLOGY MATURITY, 2024–2031 (USD MILLION)
TABLE 256
OTHER GCC COUNTRIES: LABORATORY SOFTWARE MARKET, BY FUNCTION, 2024–2031 (USD MILLION)
TABLE 257
OTHER GCC COUNTRIES: LABORATORY SOFTWARE MARKET, BY INDUSTRY, 2024–2031 (USD MILLION)
TABLE 258
OTHER GCC COUNTRIES: LABORATORY SOFTWARE MARKET FOR LIFE SCIENCE, BY TYPE, 2024–2031 (USD MILLION)
TABLE 259
SOUTH AFRICA: LABORATORY SOFTWARE MARKET, BY SOLUTION TYPE, 2024–2031 (USD MILLION)
TABLE 260
SOUTH AFRICA: LABORATORY SOFTWARE MARKET FOR LIMS, BY TYPE, 2024–2031 (USD MILLION)
TABLE 261
SOUTH AFRICA: LABORATORY SOFTWARE MARKET, BY COMPONENT, 2024–2031 (USD MILLION)
TABLE 262
SOUTH AFRICA: LABORATORY SOFTWARE MARKET, BY TECHNOLOGY MATURITY, 2024–2031 (USD MILLION)
TABLE 263
SOUTH AFRICA: LABORATORY SOFTWARE MARKET, BY FUNCTION, 2024–2031 (USD MILLION)
TABLE 264
SOUTH AFRICA: LABORATORY SOFTWARE MARKET, BY INDUSTRY, 2024–2031 (USD MILLION)
TABLE 265
SOUTH AFRICA: LABORATORY SOFTWARE MARKET FOR LIFE SCIENCE, BY TYPE, 2024–2031 (USD MILLION)
TABLE 266
REST OF MIDDLE EAST & AFRICA: LABORATORY SOFTWARE MARKET, BY SOLUTION TYPE, 2024–2031 (USD MILLION)
TABLE 267
REST OF MIDDLE EAST & AFRICA: LABORATORY SOFTWARE MARKET FOR LIMS, BY TYPE, 2024–2031 (USD MILLION)
TABLE 268
REST OF MIDDLE EAST & AFRICA: LABORATORY SOFTWARE MARKET, BY COMPONENT, 2024–2031 (USD MILLION)
TABLE 269
REST OF MIDDLE EAST & AFRICA: LABORATORY SOFTWARE MARKET, BY TECHNOLOGY MATURITY, 2024–2031 (USD MILLION)
TABLE 270
REST OF MIDDLE EAST & AFRICA: LABORATORY SOFTWARE MARKET, BY FUNCTION, 2024–2031 (USD MILLION)
TABLE 271
REST OF MIDDLE EAST & AFRICA: LABORATORY SOFTWARE MARKET, BY INDUSTRY, 2024–2031 (USD MILLION)
TABLE 272
REST OF MIDDLE EAST & AFRICA: LABORATORY SOFTWARE MARKET FOR LIFE SCIENCE, BY TYPE, 2024–2031 (USD MILLION)
TABLE 273
OVERVIEW OF STRATEGIES ADOPTED BY KEY PLAYERS IN LABORATORY SOFTWARE MARKET, JANUARY 2023–SEPTEMBER 2026
TABLE 274
LABORATORY SOFTWARE MARKET: DEGREE OF COMPETITION
TABLE 275
LABORATORY SOFTWARE MARKET: REGION FOOTPRINT
TABLE 276
LABORATORY SOFTWARE MARKET: TECHNOLOGY FOOTPRINT
TABLE 277
LABORATORY SOFTWARE MARKET: COMPONENT FOOTPRINT
TABLE 278
LABORATORY SOFTWARE MARKET: INDUSTRY FOOTPRINT
TABLE 279
LABORATORY SOFTWARE MARKET: LIST OF KEY STARTUPS/SMES
TABLE 280
LABORATORY SOFTWARE MARKET: COMPETITIVE BENCHMARKING OF STARTUPS/SMES
TABLE 281
LABORATORY SOFTWARE MARKET: PRODUCT LAUNCHES AND UPGRADES (JANUARY 2023–SEPTEMBER 2026)
TABLE 282
LABORATORY SOFTWARE MARKET: DEALS (JANUARY 2023–SEPTEMBER 2026)
TABLE 283
LABORATORY SOFTWARE MARKET: OTHER DEVELOPMENTS (JANUARY 2023–SEPTEMBER 2026)
TABLE 284
THERMO FISHER SCIENTIFIC INC.: COMPANY OVERVIEW
TABLE 285
THERMO FISHER SCIENTIFIC INC.: PRODUCTS/SOLUTIONS/SERVICES OFFERED
TABLE 286
THERMO FISHER SCIENTIFIC INC.: PRODUCT LAUNCHES & UPGRADES, JANUARY 2023–SEPTEMBER 2026
TABLE 287
THERMO FISHER SCIENTIFIC INC.: DEALS, JANUARY 2023–SEPTEMBER 2026
TABLE 288
THERMO FISHER SCIENTIFIC INC.: EXPANSIONS, JANUARY 2023–SEPTEMBER 2026
TABLE 289
LABVANTAGE SOLUTIONS INC.: COMPANY OVERVIEW
TABLE 290
LABVANTAGE SOLUTIONS INC.: PRODUCTS/SOLUTIONS/SERVICES OFFERED
TABLE 291
LABVANTAGE SOLUTIONS INC.: PRODUCT LAUNCHES & UPGRADES, JANUARY 2023–SEPTEMBER 2026
TABLE 292
LABVANTAGE SOLUTIONS INC.: DEALS, JANUARY 2023–SEPTEMBER 2026
TABLE 293
LABWARE: COMPANY OVERVIEW
TABLE 294
LABWARE: PRODUCTS/SOLUTIONS/SERVICES OFFERED
TABLE 295
LABWARE: PRODUCT LAUNCHES & UPGRADES, JANUARY 2023–SEPTEMBER 2026
TABLE 296
LABWARE: DEALS, JANUARY 2023–SEPTEMBER 2026
TABLE 297
LABWARE: EXPANSIONS, JANUARY 2023–SEPTEMBER 2026
TABLE 298
STARLIMS CORPORATION: COMPANY OVERVIEW
TABLE 299
STARLIMS CORPORATION: PRODUCTS/ SOLUTIONS/SERVICES OFFERED
TABLE 300
STARLIMS CORPORATION: PRODUCT LAUNCHES & UPGRADES, JANUARY 2023–SEPTEMBER 2026
TABLE 301
STARLIMS CORPORATION: DEALS, JANUARY 2023–SEPTEMBER 2026
TABLE 302
AGILENT TECHNOLOGIES, INC.: COMPANY OVERVIEW
TABLE 303
AGILENT TECHNOLOGIES, INC.: PRODUCTS/ SOLUTIONS/SERVICES OFFERED
TABLE 304
AGILENT TECHNOLOGIES, INC.: PRODUCT LAUNCHES & UPGRADES, JANUARY 2023–SEPTEMBER 2026
TABLE 305
AGILENT TECHNOLOGIES, INC.: DEALS, JANUARY 2023–SEPTEMBER 2026
TABLE 306
AGILENT TECHNOLOGIES, INC.: EXPANSIONS, JANUARY 2023–SEPTEMBER 2026
TABLE 307
WATERS CORPORATION: COMPANY OVERVIEW
TABLE 308
WATERS CORPORATION: PRODUCTS/ SOLUTIONS/SERVICES OFFERED
TABLE 309
WATERS CORPORATION: PRODUCT LAUNCHES & UPGRADES, JANUARY 2023–SEPTEMBER 2026
TABLE 310
WATERS CORPORATION: DEALS, JANUARY 2023–SEPTEMBER 2026
TABLE 311
WATERS CORPORATION: EXPANSIONS, JANUARY 2023–SEPTEMBER 2026
TABLE 312
LABLYNX LIMS: COMPANY OVERVIEW
TABLE 313
LABLYNX LIMS: PRODUCTS/ SOLUTIONS/SERVICES OFFERED
TABLE 314
LABLYNX LIMS: PRODUCT LAUNCHES & UPGRADES, JANUARY 2023–SEPTEMBER 2026
TABLE 315
DASSAULT SYSTÈMES: COMPANY OVERVIEW
TABLE 316
DASSAULT SYSTÈMES: PRODUCTS/SOLUTIONS/SERVICES OFFERED
TABLE 317
DASSAULT SYSTÈMES: PRODUCT LAUNCHES & UPGRADES, JANUARY 2023–SEPTEMBER 2026
TABLE 318
DASSAULT SYSTÈMES: EXPANSIONS, JANUARY 2023–SEPTEMBER 2026
TABLE 319
REVVITY: COMPANY OVERVIEW
TABLE 320
REVVITY: PRODUCTS/SOLUTIONS/SERVICES OFFERED
TABLE 321
REVVITY: PRODUCT LAUNCHES & UPGRADES, JANUARY 2023–SEPTEMBER 2026
TABLE 322
REVVITY: DEALS, JANUARY 2023–SEPTEMBER 2026
TABLE 323
CONFIENCE: COMPANY OVERVIEW
TABLE 324
CONFIENCE: PRODUCTS/SOLUTIONS/SERVICES OFFERED
TABLE 325
CONFIENCE: PRODUCT LAUNCHES & UPGRADES, JANUARY 2023–SEPTEMBER 2026
TABLE 326
CONFIENCE: DEALS, JANUARY 2023–SEPTEMBER 2026
TABLE 327
LABWORKS: COMPANY OVERVIEW
TABLE 328
LABWORKS: PRODUCTS/SOLUTIONS/SERVICES OFFERED
TABLE 329
IDBS: COMPANY OVERVIEW
TABLE 330
IDBS: PRODUCTS/SOLUTIONS/SERVICES OFFERED
TABLE 331
IDBS: PRODUCT LAUNCHES & UPGRADES, JANUARY 2023–SEPTEMBER 2026
TABLE 332
IDBS: DEALS, JANUARY 2023–SEPTEMBER 2026
TABLE 333
INSTEM: COMPANY OVERVIEW
TABLE 334
INSTEM: PRODUCTS/SOLUTIONS/SERVICES OFFERED
TABLE 335
INSTEM: PRODUCT LAUNCHES & UPGRADES, JANUARY 2023–SEPTEMBER 2026
TABLE 336
INSTEM: DEALS, JANUARY 2023–SEPTEMBER 2026
TABLE 337
INSTEM: EXPANSIONS, JANUARY 2023–SEPTEMBER 2026
TABLE 338
NOVATEK INTERNATIONAL: COMPANY OVERVIEW
TABLE 339
NOVATEK INTERNATIONAL: PRODUCTS/SOLUTIONS/SERVICES OFFERED
TABLE 340
AGARAM TECHNOLOGIES PVT. LTD.: COMPANY OVERVIEW
TABLE 341
AGARAM TECHNOLOGIES PVT. LTD.: PRODUCTS/SOLUTIONS/SERVICES OFFERED
TABLE 342
AGARAM TECHNOLOGIES PVT. LTD.: PRODUCT LAUNCHES & UPGRADES, JANUARY 2023–SEPTEMBER 2026
TABLE 343
AGARAM TECHNOLOGIES PVT. LTD.: DEALS, JANUARY 2023–SEPTEMBER 2026
TABLE 344
SIEMENS: COMPANY OVERVIEW
TABLE 345
SIEMENS: PRODUCTS/SOLUTIONS/SERVICES OFFERED
TABLE 346
SIEMENS: PRODUCT LAUNCHES & UPGRADES, JANUARY 2023–SEPTEMBER 2026
TABLE 347
SIEMENS: DEALS, JANUARY 2023–SEPTEMBER 2026
TABLE 348
CALIBER TECHNOLOGIES: COMPANY OVERVIEW
TABLE 349
CALIBER TECHNOLOGIES: PRODUCTS/SOLUTIONS/SERVICES OFFERED
TABLE 350
CALIBER TECHNOLOGIES: PRODUCT LAUNCHES & UPGRADES, JANUARY 2023–SEPTEMBER 2026
TABLE 351
CALIBER TECHNOLOGIES: DEALS, JANUARY 2023–SEPTEMBER 2026
TABLE 352
CLINISYS, INC.: COMPANY OVERVIEW
TABLE 353
CLINISYS, INC.: PRODUCTS/SOLUTIONS/SERVICES OFFERED
TABLE 354
CLINISYS, INC.: PRODUCT LAUNCHES & UPGRADES, JANUARY 2023–SEPTEMBER 2026
TABLE 355
CLINISYS, INC.: DEALS, JANUARY 2023–SEPTEMBER 2026
TABLE 356
CLINISYS, INC.: EXPANSIONS, JANUARY 2023–SEPTEMBER 2026
TABLE 357
LABTRACK: COMPANY OVERVIEW
TABLE 358
LABTRACK: PRODUCTS/SOLUTIONS/SERVICES OFFERED
TABLE 359
LABKEY: COMPANY OVERVIEW
TABLE 360
LABKEY: PRODUCTS/SOLUTIONS/SERVICES OFFERED
TABLE 361
LABKEY: PRODUCT LAUNCHES & UPGRADES, JANUARY 2023–SEPTEMBER 2026
TABLE 362
LABKEY: DEALS, JANUARY 2023–SEPTEMBER 2026
TABLE 363
BENCHLING: COMPANY OVERVIEW
TABLE 364
BENCHLING: PRODUCTS/SOLUTIONS/SERVICES OFFERED
TABLE 365
BENCHLING: PRODUCT LAUNCHES & UPGRADES, JANUARY 2023–SEPTEMBER 2026
TABLE 366
BENCHLING: DEALS, JANUARY 2023–SEPTEMBER 2026
TABLE 367
CLOUDLIMS: COMPANY OVERVIEW
TABLE 368
SCINOTE LLC: COMPANY OVERVIEW
TABLE 369
L7 INFORMATICS, INC.: COMPANY OVERVIEW
TABLE 370
QBENCH INC.: COMPANY OVERVIEW
TABLE 371
RISK ASSESSMENT: LABORATORY SOFTWARE MARKET
FIGURE 1
LABORATORY SOFTWARE MARKET SEGMENTATION
FIGURE 3
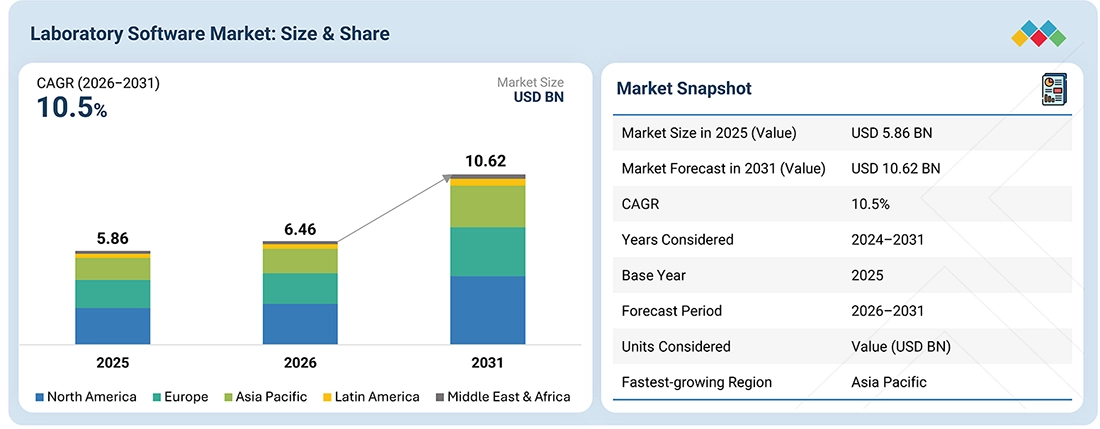
GLOBAL LABORATORY SOFTWARE MARKET, 2024–2031
FIGURE 4
MAJOR STRATEGIES ADOPTED BY KEY PLAYERS IN LABORATORY SOFTWARE MARKET, 2023–2026
FIGURE 5
DISRUPTIONS INFLUENCING GROWTH OF LABORATORY SOFTWARE MARKET
FIGURE 6
HIGH-GROWTH SEGMENTS IN LABORATORY SOFTWARE MARKET, 2026–2031
FIGURE 7
ASIA PACIFIC TO REGISTER HIGHEST CAGR IN LABORATORY SOFTWARE MARKET DURING FORECAST PERIOD
FIGURE 8
INCREASING DIGITALIZATION AND AUTOMATION OF LABORATORY WORKFLOWS TO DRIVE LABORATORY SOFTWARE MARKET GROWTH
FIGURE 9
NON-AI-ENABLED/CONVENTIONAL LABORATORY SOFTWARE ACCOUNTED FOR LARGEST MARKET SHARE IN NORTH AMERICA IN 2025
FIGURE 10
INDIA TO REGISTER HIGHEST GROWTH RATE DURING FORECAST PERIOD
FIGURE 11
LABORATORY SOFTWARE MARKET: DRIVERS, RESTRAINTS, OPPORTUNITIES, AND CHALLENGES
FIGURE 12
LABORATORY SOFTWARE MARKET: PORTER'S FIVE FORCES ANALYSIS
FIGURE 13
LABORATORY SOFTWARE MARKET: VALUE CHAIN ANALYSIS
FIGURE 14
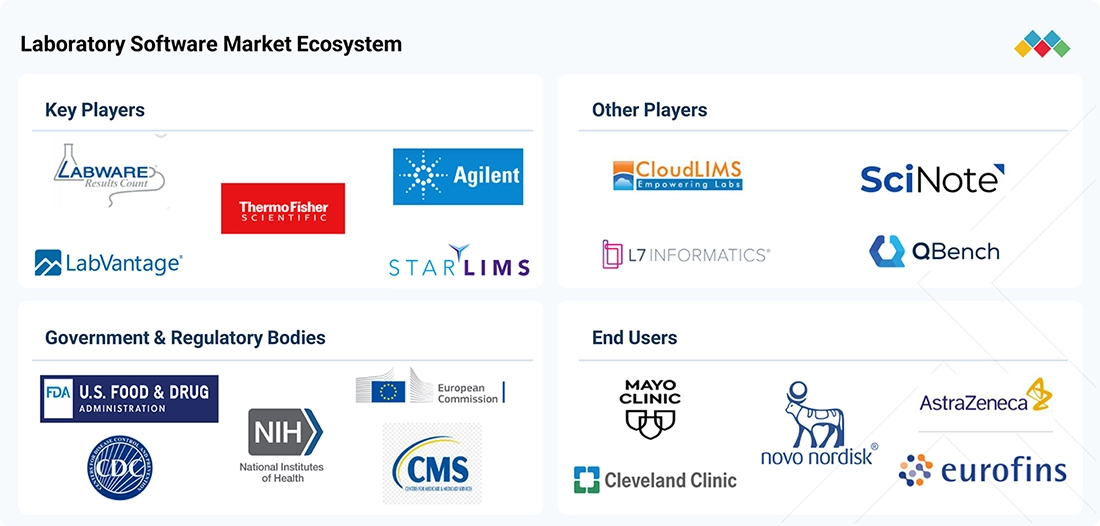
LABORATORY SOFTWARE MARKET: ECOSYSTEM ANALYSIS
FIGURE 15
REVENUE SHIFTS AND NEW REVENUE POCKETS IN LABORATORY SOFTWARE MARKET
FIGURE 16
RECENT FUNDING OF SELECTED PLAYERS IN LABORATORY SOFTWARE MARKET
FIGURE 17
PATENT PUBLICATION TRENDS IN LABORATORY SOFTWARE MARKET, 2015–2026
FIGURE 18
JURISDICTION AND TOP APPLICANT ANALYSIS FOR LABORATORY SOFTWARE PATENTS, 2015–2026
FIGURE 19
LABORATORY SOFTWARE MARKET: TOP APPLICANTS AND OWNERS (COMPANIES/INSTITUTES) FOR PATENTS (JANUARY 2015–SEPTEMBER 2026)
FIGURE 20
POTENTIAL OF AI/GEN AI IN LABORATORY SOFTWARE MARKET
FIGURE 21
IMPACT OF AI/GEN AI ON INTERCONNECTED AND ADJACENT ECOSYSTEMS
FIGURE 22
INFLUENCE OF STAKEHOLDERS ON BUYING PROCESS FOR TOP THREE END USERS
FIGURE 23
LABORATORY SOFTWARE: KEY BUYING CRITERIA FOR TOP THREE END USERS
FIGURE 24
NORTH AMERICA: LABORATORY SOFTWARE MARKET SNAPSHOT
FIGURE 25
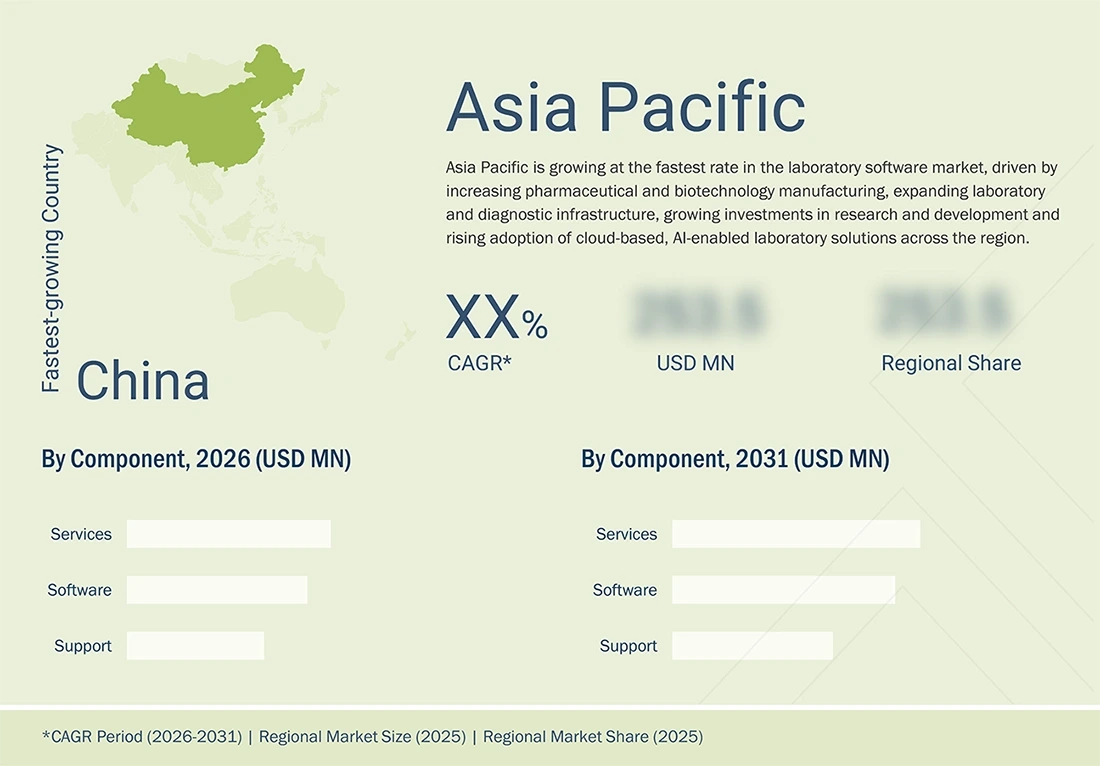
ASIA PACIFIC: LABORATORY SOFTWARE MARKET SNAPSHOT
FIGURE 26
LABORATORY SOFTWARE MARKET: REVENUE ANALYSIS OF KEY PLAYERS, 2021–2025
FIGURE 27
MARKET SHARE ANALYSIS, BY KEY PLAYER (2025)
FIGURE 28
LABORATORY SOFTWARE MARKET: BRAND COMPARISON
FIGURE 29
EV/EBITDA OF KEY VENDORS
FIGURE 30
YEAR-TO-DATE (YTD) PRICE TOTAL RETURN AND 5-YEAR STOCK BETA OF KEY VENDORS
FIGURE 31
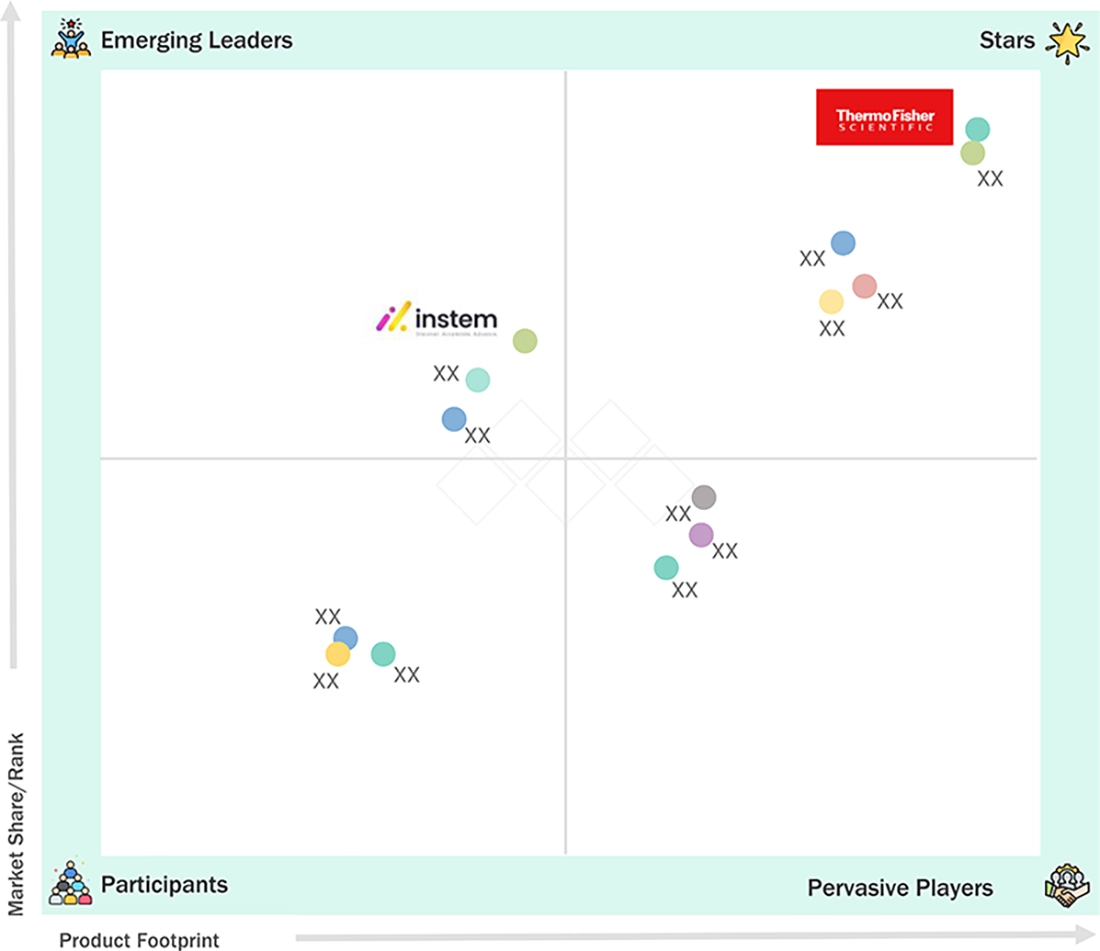
LABORATORY SOFTWARE MARKET: KEY PLAYERS, 2025
FIGURE 32
LABORATORY SOFTWARE MARKET: COMPANY FOOTPRINT
FIGURE 33
LABORATORY SOFTWARE MARKET: STARTUPS/SMES, 2025
FIGURE 34
THERMO FISHER SCIENTIFIC INC.: COMPANY SNAPSHOT (2025)
FIGURE 35
AGILENT TECHNOLOGIES, INC.: COMPANY SNAPSHOT (2025)
FIGURE 36
WATERS CORPORATION: COMPANY SNAPSHOT (2025)
FIGURE 37
DASSAULT SYSTÈMES: COMPANY SNAPSHOT (2025)
FIGURE 38
REVVITY: COMPANY SNAPSHOT (2025)
FIGURE 39
SIEMENS: COMPANY SNAPSHOT (2025)
FIGURE 40
RESEARCH DESIGN
FIGURE 41
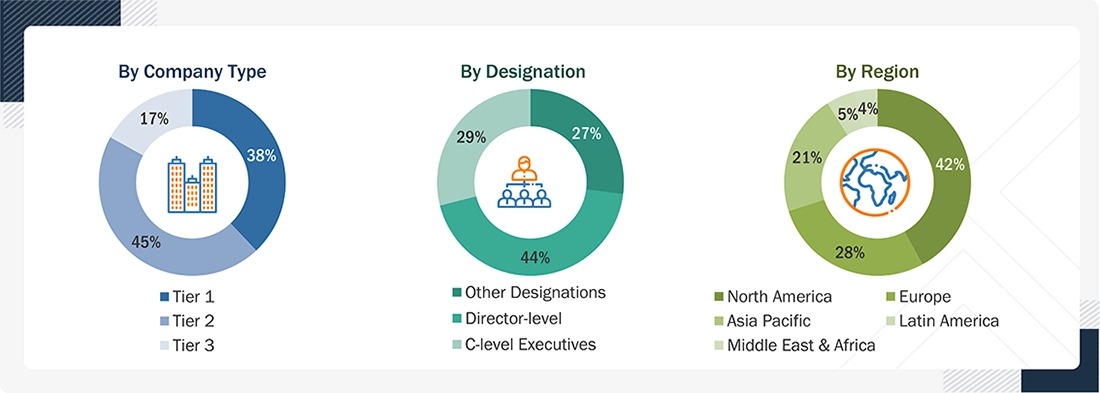
BREAKDOWN OF PRIMARY INTERVIEWS: BY COMPANY TYPE, DESIGNATION, AND REGION
FIGURE 42
RESEARCH METHODOLOGY: HYPOTHESIS BUILDING
FIGURE 43
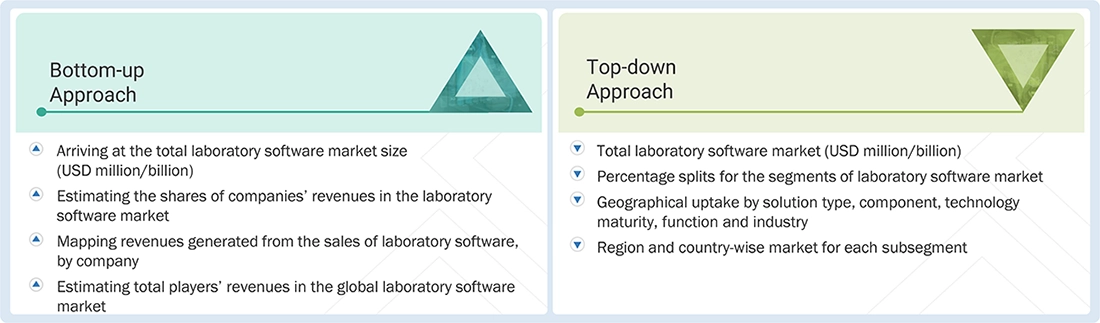
BOTTOM-UP APPROACH
FIGURE 44
TOP-DOWN APPROACH
FIGURE 45
CAGR PROJECTIONS FROM ANALYSIS OF DRIVERS, RESTRAINTS, OPPORTUNITIES, AND CHALLENGES
FIGURE 46
LABORATORY SOFTWARE MARKET: CAGR PROJECTION ANALYSIS
FIGURE 47
DATA TRIANGULATION METHODOLOGY



















Freddie
Jun, 2022
Which are the major growth influencing factors for the Laboratory Informatics Market?.
William
Jun, 2022
Which are the major growth boosting factors for the North American region in the Laboratory Informatics Market?.
Archie
Jun, 2022
By type of solutions, which of the segment will hold the major share of the Laboratory Informatics Market?.