
Microphone Market Size, Share & Trends 2025-2030

Microphone Market Size, Share & Trends by Technology (MEMS, Electret, Piezoelectric, Magnetic), MEMS (Analog, Digital), Communication (Wired, Bluetooth, Wi-Fi, Airplay), SNR (<59dB, 60-64dB, >64dB), Application (Security & Surveillance, Wearable) - Global Forecast to 2030


MICROPHONE MARKET SIZE, SHARE & TRENDS
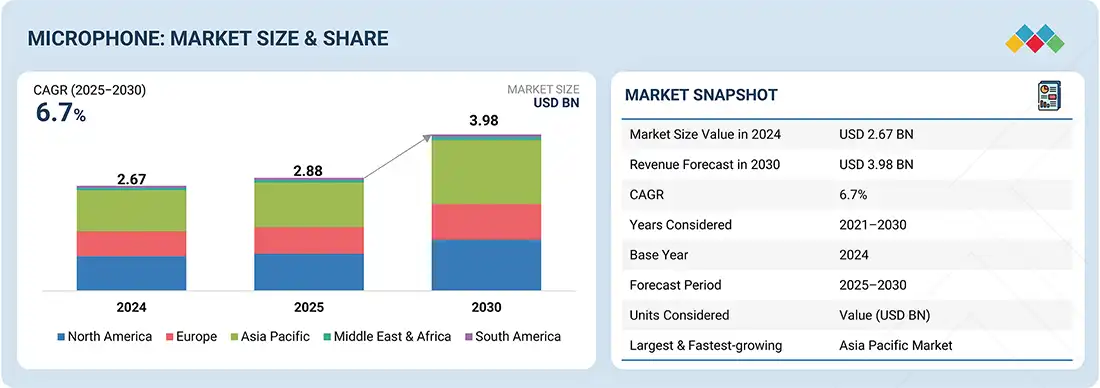
According to Marketsandmarkets, the microphone market size was valued at USD 2.88 billion in 2025 and is projected to reach USD 3.98 billion by 2030, growing at a CAGR of 6.7% from 2025 to 2030. The demand for microphones is increasing due to several evolving trends in technology and communication. The widespread use of smart devices and voice assistants like Alexa and Siri has made high-quality microphones essential for accurate voice recognition. Additionally, the rise of virtual meetings, webinars, and remote learning has created a strong need for reliable audio equipment in both professional and educational settings.
MARKET SNAPSHOT TABLE
| REPORT METRIC | DETAILS |
|---|---|
| Market Size in 2025 (Value) | USD 2.88 Billion |
| Market Forecast in 2030 (Value) | USD 3.98 Billion |
| Growth Rate | CAGR of 6.7% from 2025-2030 |
| Years Considered | 2021–2030 |
| Base Year | 2024 |
| Forecast Period | 2025–2030 |
| Units Considered | Value (USD Billion), Volume (Million Units) |
| Report Coverage | Revenue forecast, company ranking, competitive landscape, growth factors, and trends |
| Top Companies |
|
| Growth Driver |
|
| Segments Covered |
|
| Regional Scope | North America, Asia Pacific, Europe, the Middle East & Africa, and Latin America |
Market Size & Forecast
• 2025 Market Size: USD 2.88 Billion
• 2030 Projected Market Size: USD 3.98 Billion
• CAGR (2025-2030): 6.7%
• Digital MEMS Segment: Largest Market Share
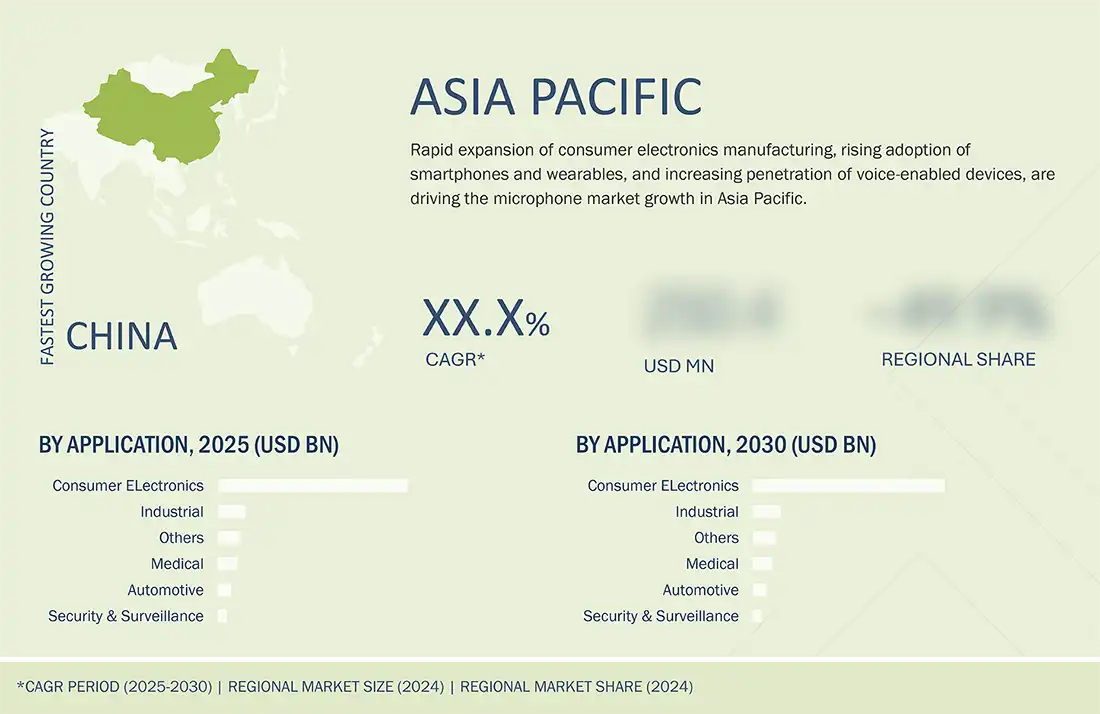
• Asia Pacific: Highest CAGR
KEY TAKEAWAYS
-
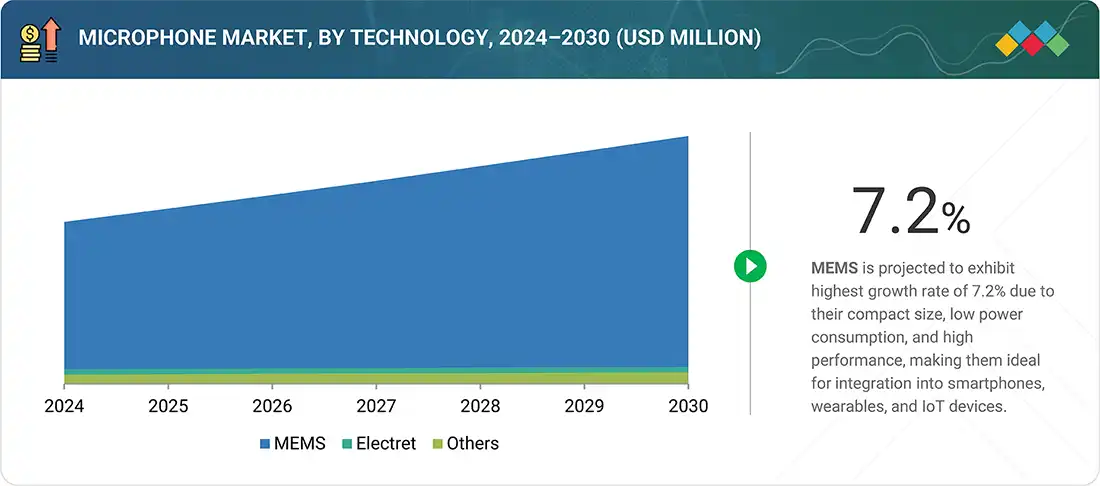
BY TECHNOLOGYBy technology, the market is segmented into MEMS, Electret, and Others. MEMS microphones use micro-electromechanical systems technology for compact, low-power, high-performance audio sensing, while electret microphones use a permanently charged material to convert sound into an electrical signal.
-
BY MEMS TYPEMEMS types include digital and analog. Digital MEMS microphones output sound as digital signals for easy integration, while analog MEMS microphones produce analog voltage signals requiring external conversion.
-
BY COMMUNICATION TECHNOLOGYCommunication technologies includes wired and wireless. Wired microphones connect directly to devices using cables, offering stable and reliable audio transmission. In contrast, wireless microphones transmit audio signals via radio frequencies or Bluetooth, providing mobility and convenience without cables.
-
BY APPLICATIONBy application, the market is segmented into automotive, security & surveillance, consumer electronics, industrial, medical, and others. In consumer electronics, MEMS microphones are used in smartphones, wireless earbuds, smart speakers, laptops, tablets, hearing aids, smart TVs, and wearable devices for voice input, calls, and voice assistant functions.
-
BY REGIONAsia Pacific is the fastest-growing region with a CAGR of 7.5% due to rapid smartphone adoption, expanding consumer electronics manufacturing, rising demand for smart devices, and increasing investments in IoT and AI technologies across the region.
-
COMPETITIVE LANDSCAPEThe major market players have adopted organic growth strategies, such as product launches, and inorganic growth strategies, such as collaborations and partnerships. For instance, Knowles Electronics LLC, Goertek, TDK Corporation, Infineon Technologies AG, and STMicroelectronics have developed new features or launched products.
The microphone market is projected to grow rapidly due to the increasing adoption of smartphones, smart home devices, and wearable technology. The rise of voice-activated assistants and IoT applications drives demand for high-quality audio input. Growth in remote work, online education, and content creation also fuels the need for advanced microphones. Additionally, advancements in MEMS technology offer smaller, more efficient, and cost-effective solutions, further accelerating market expansion.
Source: Secondary Research, Interviews with Experts, MarketsandMarkets Analysis
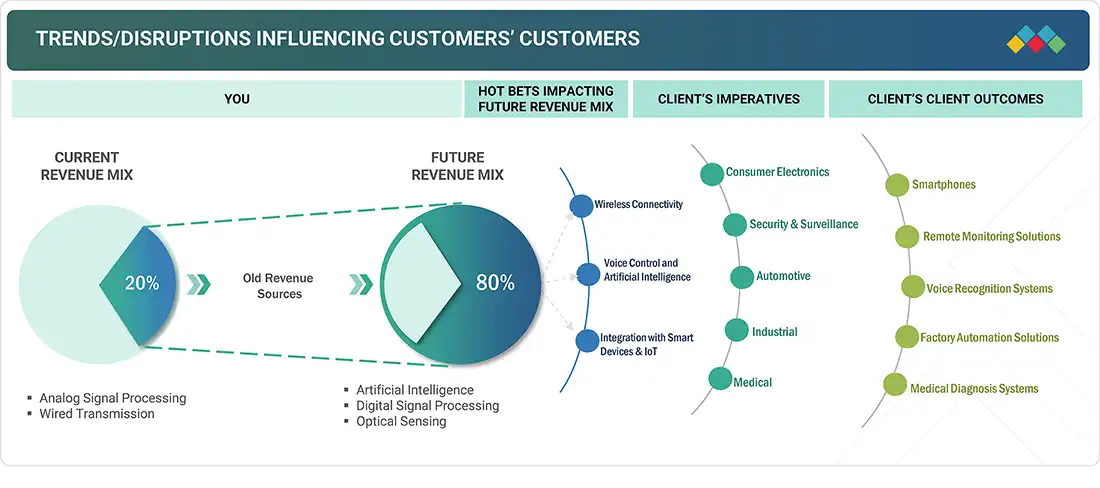
TRENDS & DISRUPTIONS IMPACTING CUSTOMERS' CUSTOMERS
The impact on consumers' business emerges from customer trends or disruptions. Hot bets are the clients of microphone manufacturers, and target applications are the clients of microphone manufacturers. Shifts, which are changing trends or disruptions, will impact the revenues of end users. The revenue impact on end users will affect the revenue of hot beds, which will further affect the revenues of microphone manufacturers.
Source: Secondary Research, Interviews with Experts, MarketsandMarkets Analysis
MARKET DYNAMICS
Level
-
Rising trend of video conferencing and remote collaborations

-
Growing adoption of voice-enabled devices

Level
-
Easy availability of counterfeit and low-quality products

-
Design-related constraints in microphones

Level
-
Increasing demand for wearable devices and hearables

-
Rise in AR, VR, and gaming applications

Level
-
Compatibility issues in microphones

-
Intense competition among small/new companies and established microphone manufacturers

Source: Secondary Research, Interviews with Experts, MarketsandMarkets Analysis
Driver: Growing adoption of voice-enabled devices
The growing adoption of voice-enabled devices is a major driver for the microphone market as these devices rely heavily on high-quality microphones to capture and process voice commands accurately. As more consumers use smart speakers, smartphones, wearables, and home automation systems with voice assistants like Alexa, Siri, and Google Assistant, the demand for sensitive, reliable microphones increases. This trend is fueled by these devices' convenience and hands-free control, encouraging manufacturers to integrate advanced microphones to improve user experience. As voice technology becomes more widespread, microphones play a critical role in enabling seamless, natural interactions.
Restraint: : Design-related constraints in microphones
Design-related constraints in microphones include the need to balance size, power consumption, sensitivity, and cost. Microphones must be small enough for compact devices like smartphones and wearables without sacrificing sound quality. Low power consumption is essential for battery-operated gadgets, while maintaining high performance in noisy environments adds complexity. These factors limit design flexibility and can impact the pace of innovation and adoption in specific applications.
Opportunity: Expansion of AR/VR and gaming platforms
The expansion of AR/VR in gaming platforms presents a significant opportunity for the microphone market. As these technologies grow, there is increasing demand for high-performance microphones that provide accurate voice recognition and immersive spatial audio. This creates opportunities for innovation in compact, low-latency, and noise-cancelling microphones explicitly designed for AR/VR headsets and controllers, opening new avenues for market growth and technology development.
Challenge: Compatibility issues in microphones
Compatibility issues in microphones pose a challenge because different devices and platforms often require varied audio interfaces and signal processing standards. This can lead to difficulties in ensuring seamless integration, especially between analog and digital systems or across operating systems. Such incompatibilities may result in reduced performance, increased development costs, and slower adoption of new microphone technologies in diverse consumer electronics.
Microphone Market: COMMERCIAL USE CASES ACROSS INDUSTRIES
| COMPANY | USE CASE DESCRIPTION | BENEFITS |
|---|---|---|
|
|
MEMS microphones for smartphones, wearables, and hearing aids | Delivers superior sound quality, low power consumption, and compact design for space-constrained devices |
|
|
Consumer electronics and AR/VR headsets with advanced audio features | Enables immersive audio experiences, improved sound pickup, and integration into lightweight form factors |
|
|
Integration in mobile devices, laptops, and smart accessories | Ensures consistent audio capture, environmental noise reduction, and reliable performance in compact systems |
|
|
Smart home devices, automotive systems, and industrial monitoring | Enhances acoustic sensing, supports environmental noise detection, and enables robust performance in harsh conditions |
|
|
Premium consumer electronics, automotive, and IoT devices | Provides accurate audio capture, improved signal-to-noise ratio, and seamless integration into digital system |
Logos and trademarks shown above are the property of their respective owners. Their use here is for informational and illustrative purposes only.
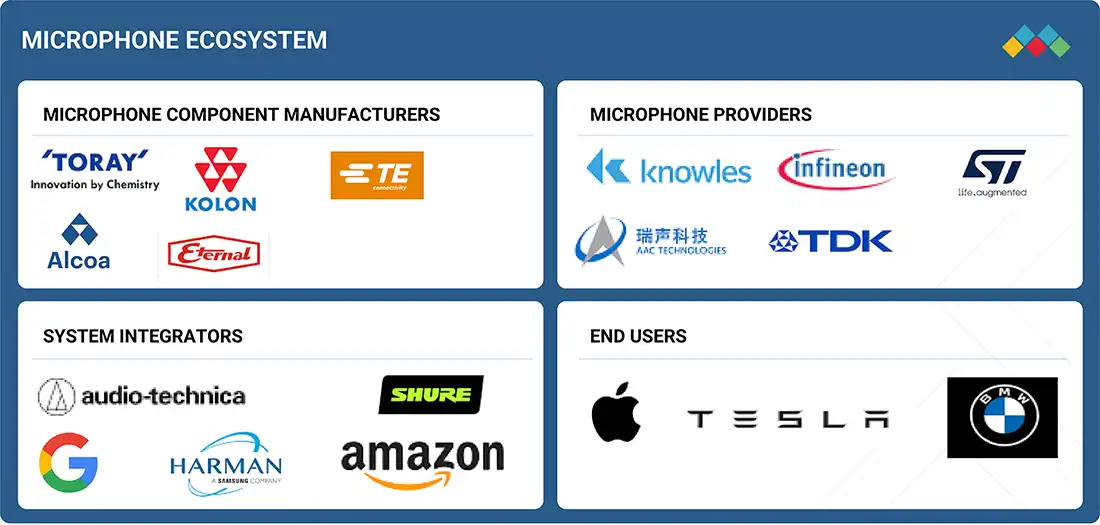
MARKET ECOSYSTEM
The microphone ecosystem comprises a network of interconnected stakeholders, including raw material providers, manufacturers, integrators, and end users. Raw material providers supply key components like membranes and circuits. Microphone manufacturers use these materials to design and produce microphones. Integrators embed the microphones into consumer electronics and other devices. End users are the consumers who use these devices for communication, entertainment, and voice control.
Logos and trademarks shown above are the property of their respective owners. Their use here is for informational and illustrative purposes only.
MARKET SEGMENTS
Source: Secondary Research, Interviews with Experts, MarketsandMarkets Analysis
Microphone Market, By Technology
The MEMS segment is leading the microphone market due to its compact size, low power consumption, and high performance. MEMS microphones are highly reliable and easily integrated into modern consumer electronics like smartphones and wearables. Their resistance to environmental factors and ability to deliver clear audio in noisy settings add to their advantage. Additionally, advancements in MEMS technology continue to lower costs, making them accessible for mass-market applications. These advantages drive strong demand and market dominance for MEMS microphones.
Microphone Market, By MEMS Type
The digital segment leads the microphone market as digital microphones offer better noise immunity and more consistent audio quality than analog ones. They provide easier integration with modern digital devices through standardized interfaces like PDM. Digital microphones reduce the need for additional signal processing hardware, simplifying device design. As consumer electronics increasingly rely on digital systems, the demand for digital MEMS microphones skyrockets, making this segment dominant in the market.
Microphone Market, By Communication Technology
The wireless segment is growing at the highest rate due to the rising popularity of truly wireless earbuds, smart speakers, and wearable devices that prioritize mobility and convenience. Consumers prefer wireless solutions for untethered, hassle-free use, especially with increasing remote work and on-the-go lifestyles. Advances in Bluetooth and low-power wireless technologies make wireless microphones more reliable and efficient. This shift toward wireless audio devices drives rapid growth of the wireless microphone market.
Microphone Market, By Application
The consumer electronics application leads the microphone market due to the widespread use of smartphones, tablets, and wearable devices that require high-quality audio input. Growing demand for voice assistants, video calling, and multimedia content creation drives the need for advanced microphones. The increasing popularity of wireless earbuds and smart home devices further boosts this segment. Continuous innovation and integration of microphones in everyday electronics ensure sustained market growth.
REGION
Asia Pacific to be fastest-growing region in the global microphone market during the forecast period
Asia Pacific is projected to be the fastest-growing microphone market due to rapid smartphone adoption, expanding consumer electronics manufacturing, and increasing demand for smart devices. Growing investments in IoT, AI, and voice-activated technologies boost the need for advanced microphones. Additionally, rising disposable incomes and improving internet infrastructure support higher consumption of voice-enabled gadgets. The region's large population and emerging markets create significant opportunities for market expansion.
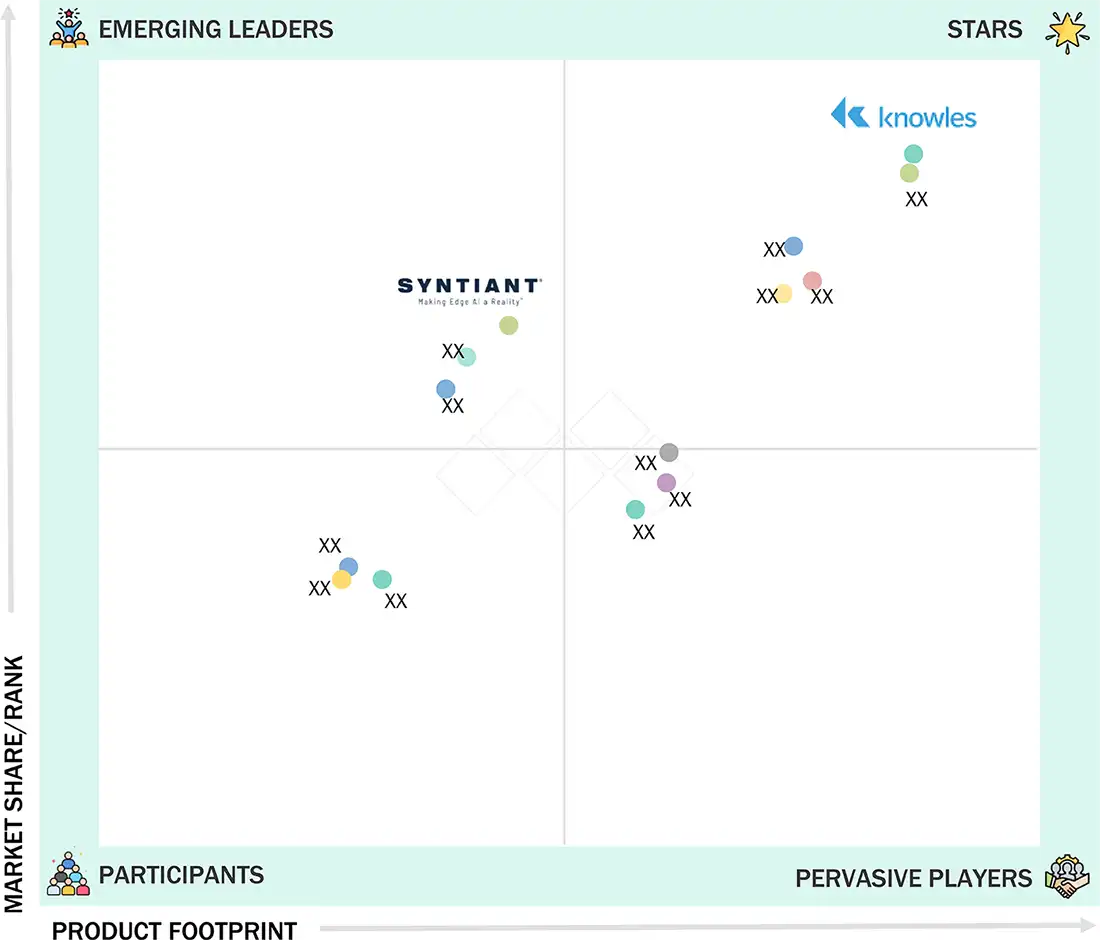
Microphone Market: COMPANY EVALUATION MATRIX
In the microphone companies, Knowles Electronics LLC (Star) leads the market with a diverse, high-performance microphone portfolio catering to healthcare, consumer electronics, and automotive sectors. Known for continuous innovation in MEMS and digital microphones, Knowles maintains a strong global presence and market dominance, driving sustained growth and expansion in the microphone industry. STMicroelectronics (Emerging Leader) is rapidly gaining traction with innovative MEMS microphone technologies and a growing focus on consumer electronics and automotive applications, backed by strong R&D investment. Its expanding product portfolio and market presence position it well for future growth and advancement toward the leaders' quadrant.
Source: Secondary Research, Interviews with Experts, MarketsandMarkets Analysis
KEY MARKET PLAYERS
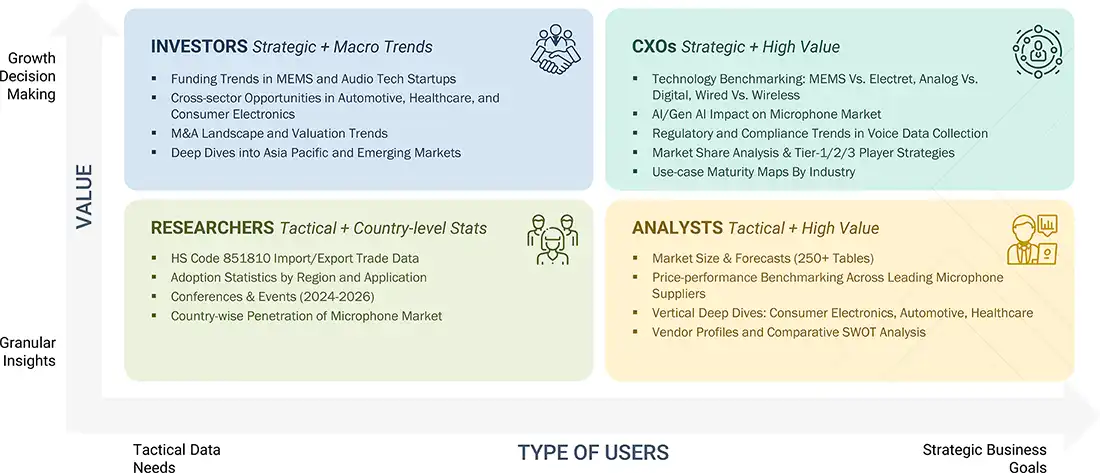
WHAT IS IN IT FOR YOU: Microphone Market REPORT CONTENT GUIDE
DELIVERED CUSTOMIZATIONS
We have successfully delivered the following deep-dive customizations:
| CLIENT REQUEST | CUSTOMIZATION DELIVERED | VALUE ADDS |
|---|---|---|
| Consumer Electronics Company |
|
|
| Microphone Manufacturer |
|
|
| Component Distributor |
|
|
| Automotive OEM |
|
|
RECENT DEVELOPMENTS
- June 2024 : TDK Corporation announced the global availability of its InvenSense SmartSound T5848 I²S microphones. These microphones are designed to support intelligent keyword recognition, voice commands, and sound detection with ultra-low power consumption.
- January 2023 : Knowles introduced its latest series of SiSonic MEMS microphones: Titan (Digital), Falcon (Differential Analog), and Robin (Single Ended Analog). The new trio of microphones provides advanced performance capabilities for space-constrained ear and wearable applications such as True Wireless Stereo (TWS) earbuds, smartwatches, augmented reality (AR) glasses, and virtual reality (VR) headsets.
- January 2023 : TDK Corporation announced the availability of the InvenSense T5838 and T5837 MEMS microphones. The T5837 and T5838 PDM MEMS microphones offer the lowest power Pulse Density Modulation (PDM) multi-mode MEMS microphone with a high acoustic overload point.
- May 2023 : CUI Devices (Same Sky) Audio Group introduced three new MEMS microphone models, each offering a broad frequency range of 20 to 20,000 Hz.
- June 2023 : TDK Corporation partnered with Syntiant. Syntiant has elected the company's latest low-power T5838 and T5837 digital PDM MEMS microphones as a microphone for low-power edge AI application processors.
Table of Contents
 Exclusive indicates content/data unique to MarketsandMarkets and not available with any competitors.
Methodology
The study used four major activities to estimate the microphone's market size. Exhaustive secondary research was conducted to gather information on the market and its peer and parent markets. The next step was to validate these findings, assumptions, and market size with industry experts across the value chain through primary research. Both top-down and bottom-up approaches were employed to estimate the total market size. Finally, market breakdown and data triangulation methods were used to estimate the market size for different segments and subsegments.
Secondary Research
In the secondary research process, various sources were used to identify and collect information on the microphone market. Secondary sources for this research study include corporate filings (such as annual reports, investor presentations, and financial statements); trade, business, and professional associations; white papers; certified publications; and articles by recognized authors, directories, and databases. The secondary data was collected and analyzed to determine the overall market size, and was further validated through primary research.
List of key secondary sources
|
Source |
Web Link |
|
Federal Communications Commission (FCC) |
https://www.fcc.gov/ |
|
National Institute of Standards and Technology (NIST) |
https://www.nist.gov/ |
|
Ministry of Electronics and Information Technology (MeitY) |
https://www.meity.gov.in/ |
|
Ministry of Industry and Information Technology (MIIT) |
https://english.miit.gov.cn/ |
|
Ministry of Internal Affairs and Communications (MIC) |
https://www.soumu.go.jp/english/ |
Primary Research
Primary interviews were conducted to gather insights on market statistics, revenue data, market breakdowns, size estimations, and forecasting. Additionally, primary research was used to comprehend various technologies, types, applications, and regional trends. Interviews with stakeholders from the demand side, including CIOs, CTOs, CSOs, and customer/end user installation teams using microphone offerings and processes, were also conducted to understand their perspective on suppliers, products, component providers, and their current and future use of microphones, which will impact the overall market. Several primary interviews were conducted across major countries in North America, Europe, Asia Pacific, and RoW.

To know about the assumptions considered for the study, download the pdf brochure
Market Size Estimation
In the complete market engineering process, top-down and bottom-up approaches and several data triangulation methods have been used to estimate and forecast the overall market segments and subsegments listed in this report. Key players in the market have been identified through secondary research, and their market shares in the respective regions have been determined through primary and secondary research. This entire procedure includes the study of annual and financial reports of the top market players and extensive interviews for key insights (quantitative and qualitative) with industry experts (CEOs, VPs, directors, and marketing executives).
All percentage shares, splits, and breakdowns have been determined using secondary sources and verified through primary sources. All the parameters affecting the markets covered in this research study have been accounted for, viewed in detail, verified through primary research, and analyzed to obtain the final quantitative and qualitative data. This data has been consolidated and supplemented with detailed inputs and analysis from MarketsandMarkets and presented in this report. The following figure represents this study's overall market size estimation process.
Microphone Market : Top-Down and Bottom-Up Approach

Data Triangulation
Once the overall size of the microphone market has been determined using the methods described above, it has been divided into multiple segments and subsegments. Market engineering has been performed for each segment and subsegment using market breakdown and data triangulation methods, as applicable, to obtain accurate statistics. Various factors and trends from the demand and supply sides have been studied to triangulate the data. The market size has been validated using both top-down and bottom-up approaches..
Market Definition
A microphone is an electronic device that converts sound waves into an electrical signal. Microphones work based on the principle of transduction, where they convert sound waves (acoustic energy) into electrical signals (electrical energy). This conversion process involves a diaphragm or a membrane that vibrates in response to sound waves. When the diaphragm vibrates, it creates an electrical signal reflecting the recorded sound. This signal is usually in the form of voltage or current. Microphones are widely used in voice recording, live performances, broadcasting, communication devices, and audio production.
The market includes first-level packaged MEMS devices (sensors and actuators) sold by IDMs and fabless companies to OEMs/integrators.
Key Stakeholders
- Microphone manufacturers
- Suppliers and distributors
- Microphone vendors
- System integrators
- Professional audio equipment providers
- Consumers
- Regulatory authorities
- Industry associations and standards organizations
- Research institutions
Report Objectives
- To describe and forecast the microphone market by technology, MEMS type, communication technology, application, and region, in terms of value
- To describe and forecast the market for various segments across four main regions, namely, North America, Europe, Asia Pacific, and RoW, in terms of value
- To describe and forecast the market by technology, in terms of volume
- To strategically analyze micromarkets with regard to individual growth trends, prospects, and contributions to the markets
- To provide detailed information regarding drivers, restraints, opportunities, and challenges influencing market growth
- To analyze opportunities for stakeholders by identifying high-growth segments in the market
- To provide a detailed overview of the microphone value chain
- To strategically analyze key technologies, average selling price trends, trends impacting customer business, ecosystem, regulatory landscape, patent landscape, Porter's five forces, import and export scenarios, trade landscape, key stakeholders, buying criteria, and case studies pertaining to the market under study
- To strategically profile key players in the microphone market and comprehensively analyze their market share and core competencies
- To analyze competitive developments such as partnerships, acquisitions, expansions, collaborations, and product launches, along with R&D in the microphone market
Available customizations:
With the given market data, MarketsandMarkets offers customizations according to the specific requirements of companies. The following customization options are available for the report:
- Detailed analysis and profiling of additional market players (up to 5)
- Additional country-level analysis of the microphone market
Product Analysis
- The product matrix provides a detailed comparison of the product portfolio of each company in the microphone market.
Key Questions Addressed by the Report
What is the current size of the Microphone market?
The global Microphone market is valued at USD 2.88 billion in 2025. (MarketsandMarkets)
What is the projected market size by 2030?
The market is expected to reach USD 3.98 billion by 2030. (MarketsandMarkets)
What is the CAGR of the Microphone market?
The market is projected to grow at a CAGR of 6.7% (2025–2030). (MarketsandMarkets)
What are the key growth drivers of the Microphone market?
Growth is driven by smart devices, voice assistants, remote communication, IoT adoption, and MEMS technology advancements. (MarketsandMarkets)
Which technology segment dominates the market?
MEMS microphones hold the largest share due to compact size, low power use, and high performance. (MarketsandMarkets)
Which region leads the Microphone market?
Asia Pacific is the fastest-growing region, while North America holds a strong market share. (MarketsandMarkets)
Which application segment is significant?
Major applications include consumer electronics, automotive, healthcare, industrial, and security & surveillance. (MarketsandMarkets)
Who are the key companies in the Microphone market?
Major players include Knowles, Goertek, TDK Corporation, Infineon Technologies, and STMicroelectronics. (MarketsandMarkets)
What are the key market trends?
Trends include AI voice assistants, noise cancellation, wireless microphones, and miniaturized MEMS devices. (MarketsandMarkets)
What does the Microphone market report include?
The report includes 270 pages, segmentation by technology, application, region, competitive landscape, and forecast to 2030. (MarketsandMarkets)
Need a Tailored Report?
Customize this report to your needs
Get 10% FREE Customization
Customize This ReportPersonalize This Research
- Triangulate with your Own Data
- Get Data as per your Format and Definition
- Gain a Deeper Dive on a Specific Application, Geography, Customer or Competitor
- Any level of Personalization
Let Us Help You
- What are the Known and Unknown Adjacencies Impacting the Microphone Market
- What will your New Revenue Sources be?
- Who will be your Top Customer; what will make them switch?
- Defend your Market Share or Win Competitors
- Get a Scorecard for Target Partners

Custom Market Research Services
We Will Customise The Research For You, In Case The Report Listed Above Does Not Meet With Your Requirements
Get 10% Free CustomisationTESTIMONIALS

Tetsuya Ohhira
Business Development Manager-Technology Business
Nikon Corporation,
Leading Japanese MNC specializing in optics and imaging productswww.nikon.com
MarketsandMarkets™ response
is quick. Their attitude is flexible and positive. Analyst Insights are globally considered and
significant. Client Services quickly respond to our inquiry and demand. Their wide range of global
surveys help us make our strategic plan.
We hope Knowledge Store will be easier to search
for a report.
VP - Marketing & Business Development
Leading Provider of Process Control Solutions
We engaged with MarketsandMarkets on a study to perform an analysis and recommend a Go-To-Market strategy for metrology and process control in the semiconductor market. The study was tailored to our targets and needs with well-defined milestones. Our overall experience with the MarketsandMarkets team was very good throughout the project in all aspects including the analysis methodologies used, the quality and depth of primary and secondary data sets, the professionalism and flexibility of the team and the ability to meet the target schedule and milestones. We want to thank MarketsandMarkets team for a job well done.


Growth opportunities and latent adjacency in Microphone Market