This study involved four major activities in estimating the current size of the regenerative medicine market. Exhaustive secondary research was carried out to collect information on the market, its peer markets, and its parent market. These findings, assumptions, and sizing were then validated with industry experts across the value chain through primary research. Both top-down and bottom-up approaches were employed to estimate the complete market size. After that, market breakdown and data triangulation procedures were used to estimate the market size of segments and subsegments.
Secondary Research
Secondary research was used mainly to identify and collect information for the extensive technical, market-oriented, and commercial study of the regenerative medicine market. The secondary sources used for this study include the Alliance for Regenerative Medicine (ARM), American Society for Cell Biology (ASCB), Centre for Commercialization of Regenerative Medicine (CCRM), European Society of Gene & Cell Therapy (ESGCT), National Center for Biotechnology Information (NCBI), Annual Reports, SEC Filings, Investor Presentations, Expert Interviews, and MarketsandMarkets Analysis. These sources were also used to obtain key information about major players, global product revenues, market classification, and segmentation according to industry trends, regional/country-level markets, market developments, and technology perspectives. Secondary data was collected and analyzed to arrive at the overall size of the global regenerative medicine market, which was validated through primary research.
Primary Research
In-depth interviews were conducted with various primary respondents, including key industry participants, subject-matter experts (SMEs), C-level executives of key market players, and industry consultants, among other experts, to obtain and verify the critical qualitative and quantitative information as well as assess future prospects of the market. Various primary sources from both the supply and demand sides of the market were interviewed to obtain qualitative and quantitative information. The following is a breakdown of the primary respondents:

Note: Tiers are defined based on a company’s total revenue. As of 2022, Tier 1 = >USD 1 Bn, Tier 2 = USD 500 Mn to USD 1 Bn, and Tier 3 <USD 500 Mn.
To know about the assumptions considered for the study, download the pdf brochure
Market Size Estimation
The global size of the regenerative medicine market was estimated through multiple approaches. A detailed market estimation approach was followed to estimate and validate the value of the market and other dependent submarkets. These methods were also used extensively to estimate the size of various subsegments in the market. The research methodology used to estimate the market size includes the following:
-
The major players in the industry and market have been identified through extensive primary and secondary research.
-
The product and company revenues generated from the regenerative medicine business of players operating in the market have been determined through secondary research and primary analysis.
-
All percentage shares, splits, and breakdowns have been determined using secondary sources and verified through primary sources.
Market Size Estimation Methodology-Bottom-up approach

To know about the assumptions considered for the study, Request for Free Sample Report
Top-down Approach-

Data Triangulation
After estimating the overall market size from the market size estimation process, the total market was split into several segments and subsegments. To complete the overall market engineering process and arrive at the exact statistics for all segments and subsegments, data triangulation and market breakdown procedures were employed, wherever applicable. The data was triangulated by studying various factors and trends from both the demand and supply sides.
Market Definition
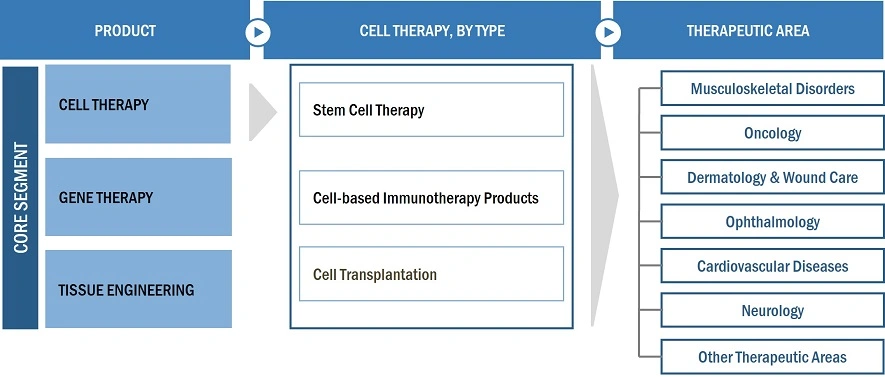
Regenerative medicine refers to a branch of medical science that focuses on repairing, replacing, or regenerating damaged or diseased cells, tissues, or organs to restore normal function. This field employs various approaches, including stem cell therapy, gene therapy, tissue engineering, and other advanced techniques, to promote the body's natural healing processes.
Key Stakeholders
-
Regenerative medicine product manufacturing companies
-
Healthcare service providers (including hospitals & specialty clinics)
-
National and regional research boards and organizations
-
Research & development organizations
-
Clinical research organizations (CROs)
-
Research laboratories & academic institutes
-
Market research & consulting firms
The main objectives of this study are as follows:
-
To define, describe, and forecast the regenerative medicine market by product, therapeutic area, and region
-
To provide detailed information regarding the major factors influencing the market growth (such as drivers, restraints, opportunities, and challenges)
-
To analyze the micromarkets with respect to individual growth trends, prospects, and contributions to the overall regenerative medicine market
-
To provide detailed information about global product revenues.
-
To analyze the opportunities for stakeholders and provide details of the competitive landscape for market leaders
-
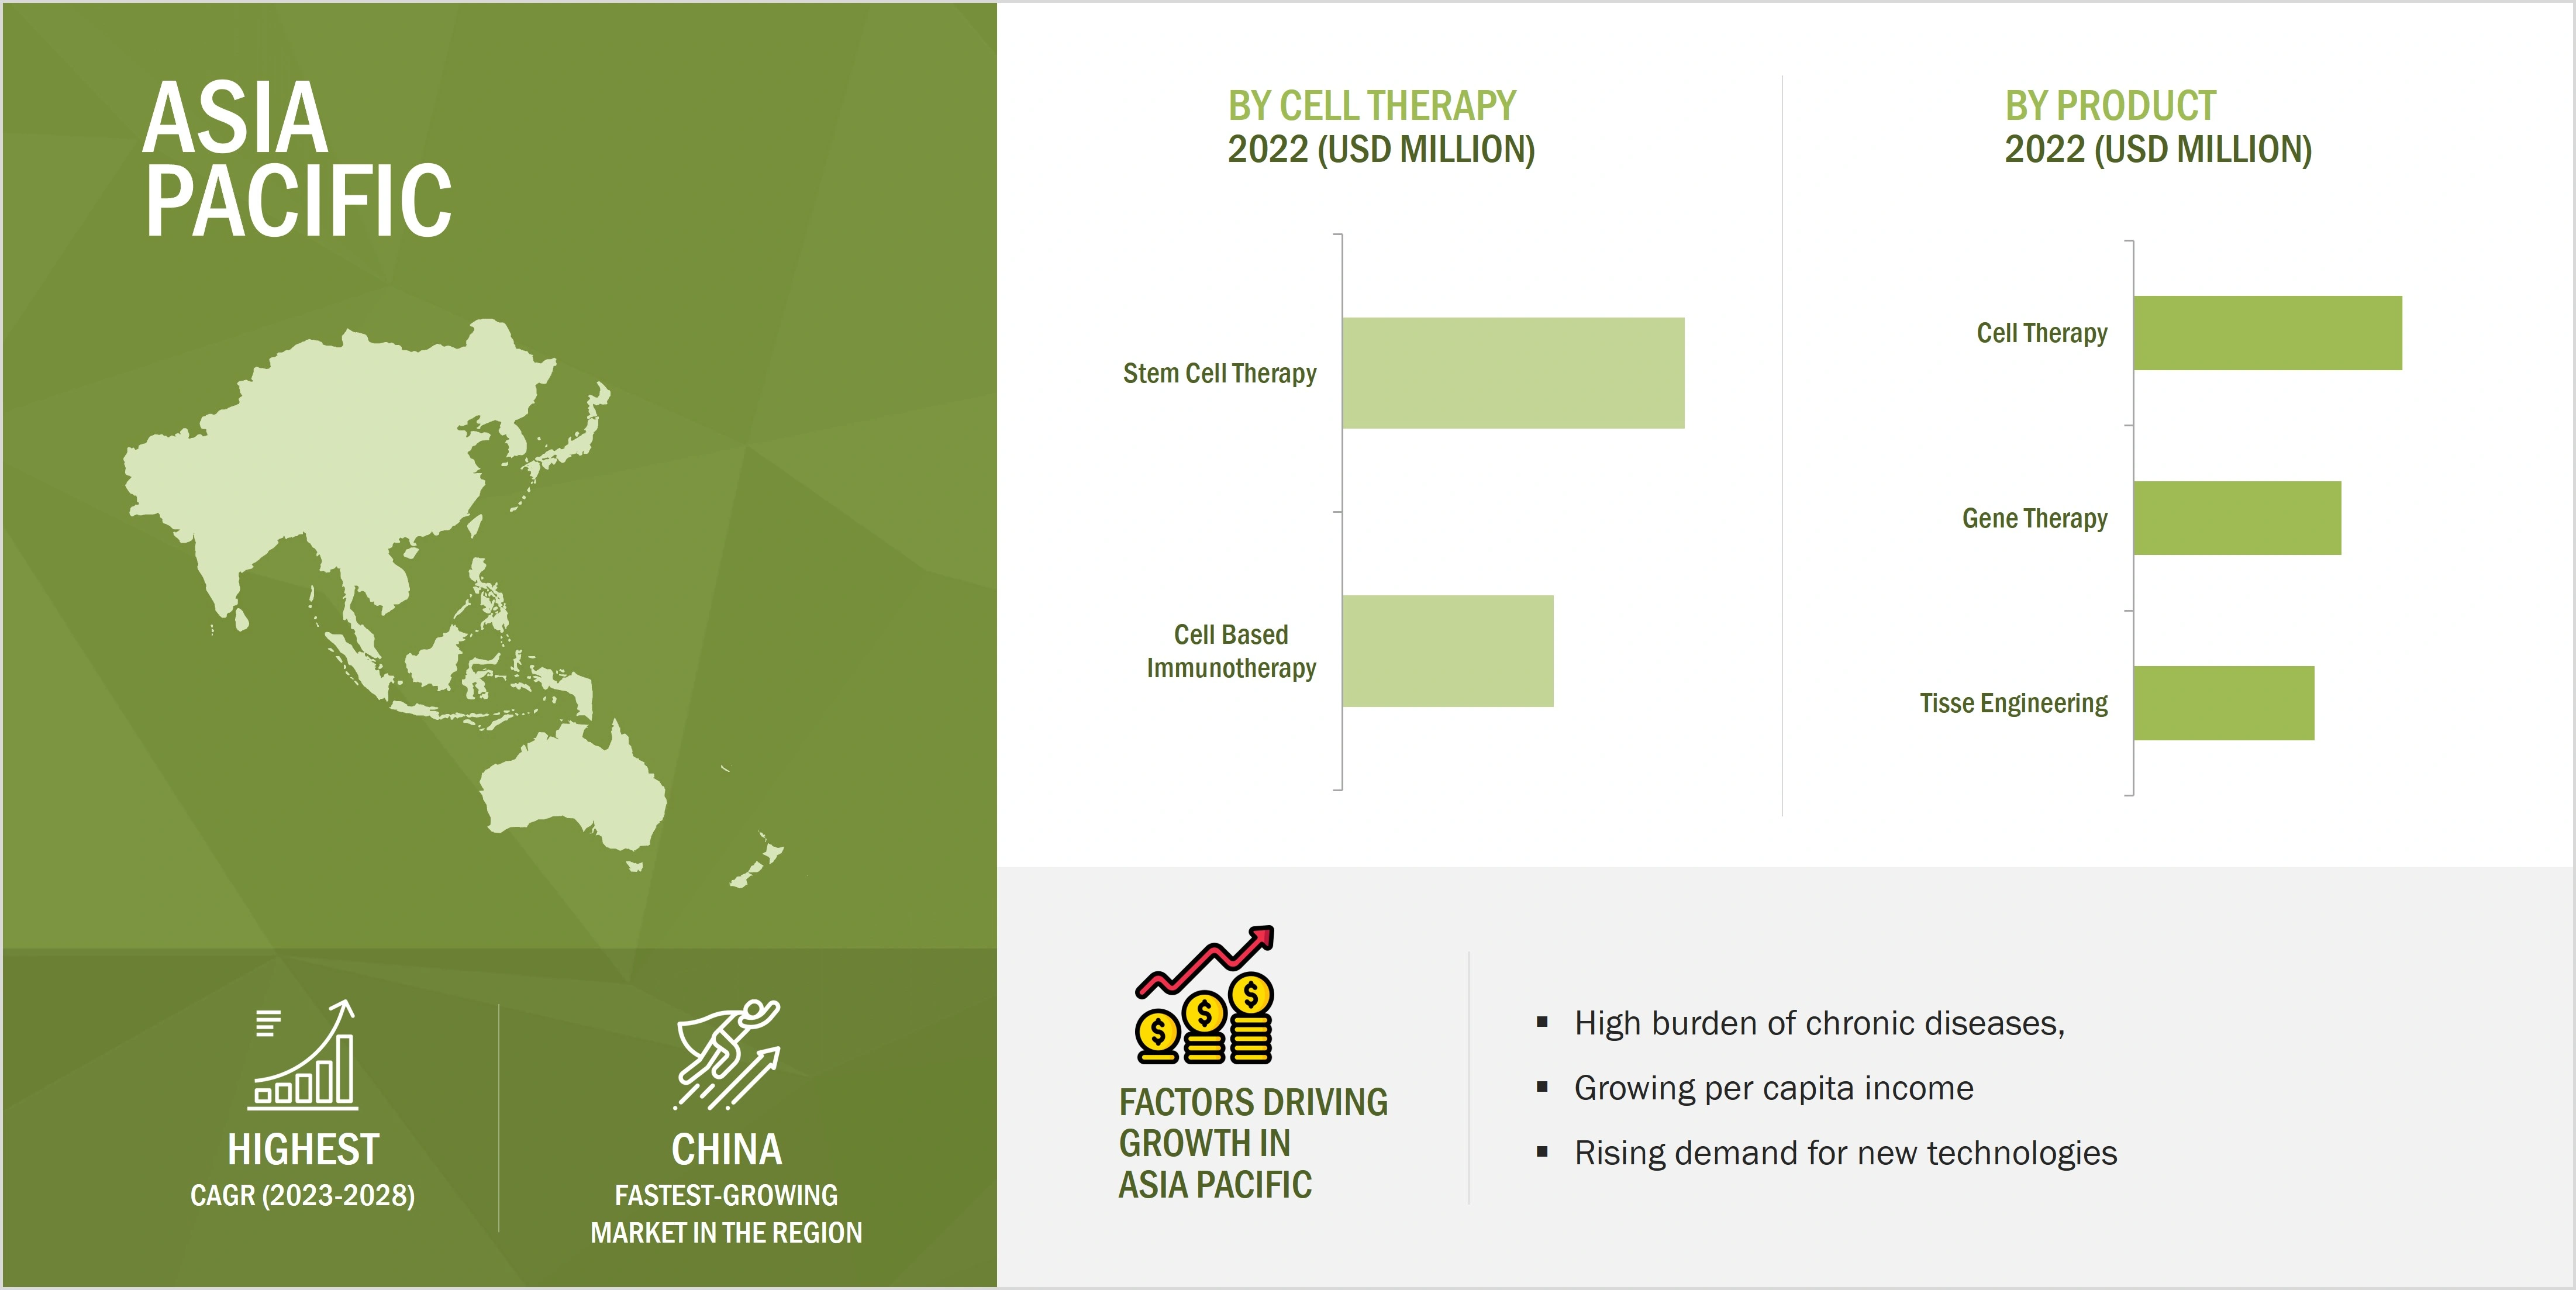
To forecast the size of the market segments with respect to five regions: North America (U.S., Canada), Europe (Germany, UK, France, Italy, Spain, Rest of Europe), the Asia Pacific (China, Japan, India, Australia, South Korea, Rest of Asia Pacific), Latin America (Brazil, Rest of Latin America), the Middle East and Africa
-
To profile the key players and analyze their market shares and core competencies
-
To track and analyze competitive developments, such as product launches, pipeline products (Phase 3 Regenerative medicines clinical trials molecules), partnerships, agreements, collaborations, expansions, and strategic alliances
-
To benchmark players within the market using the proprietary “Company Evaluation Matrix” framework, which analyzes market players on various parameters within the broad categories of business and product excellence strategy.
Available Customizations
With the given market data, MarketsandMarkets offers customizations as per the company’s specific needs. The following customization options are available for this report with additional efforts:
-
Product-Level Information
Country-wise Information:
-
Analysis for additional countries (up to five)
Company Information:
-
Detailed analysis and profiling of additional key market players across the globe


Melinda
Dec, 2022
According to your study, what would be the expected growth rate in the Regenerative Medicine Market by 2030?.
Jeff
Dec, 2022
Based on Regenerative Medicine By Products segment, which products are expected to witness the highest growth rate in the future?.