
Smart Port Market by Technology (IoT, Blockchain, Process Automation, AI), Throughput Capacity (High, Medium, & Low Throughput Capacity), Port Type (Seaports, Inland Ports), Element, and Region - Global Forecast to 2030


OVERVIEW
Source: Secondary Research, Interviews with Experts, MarketsandMarkets Analysis
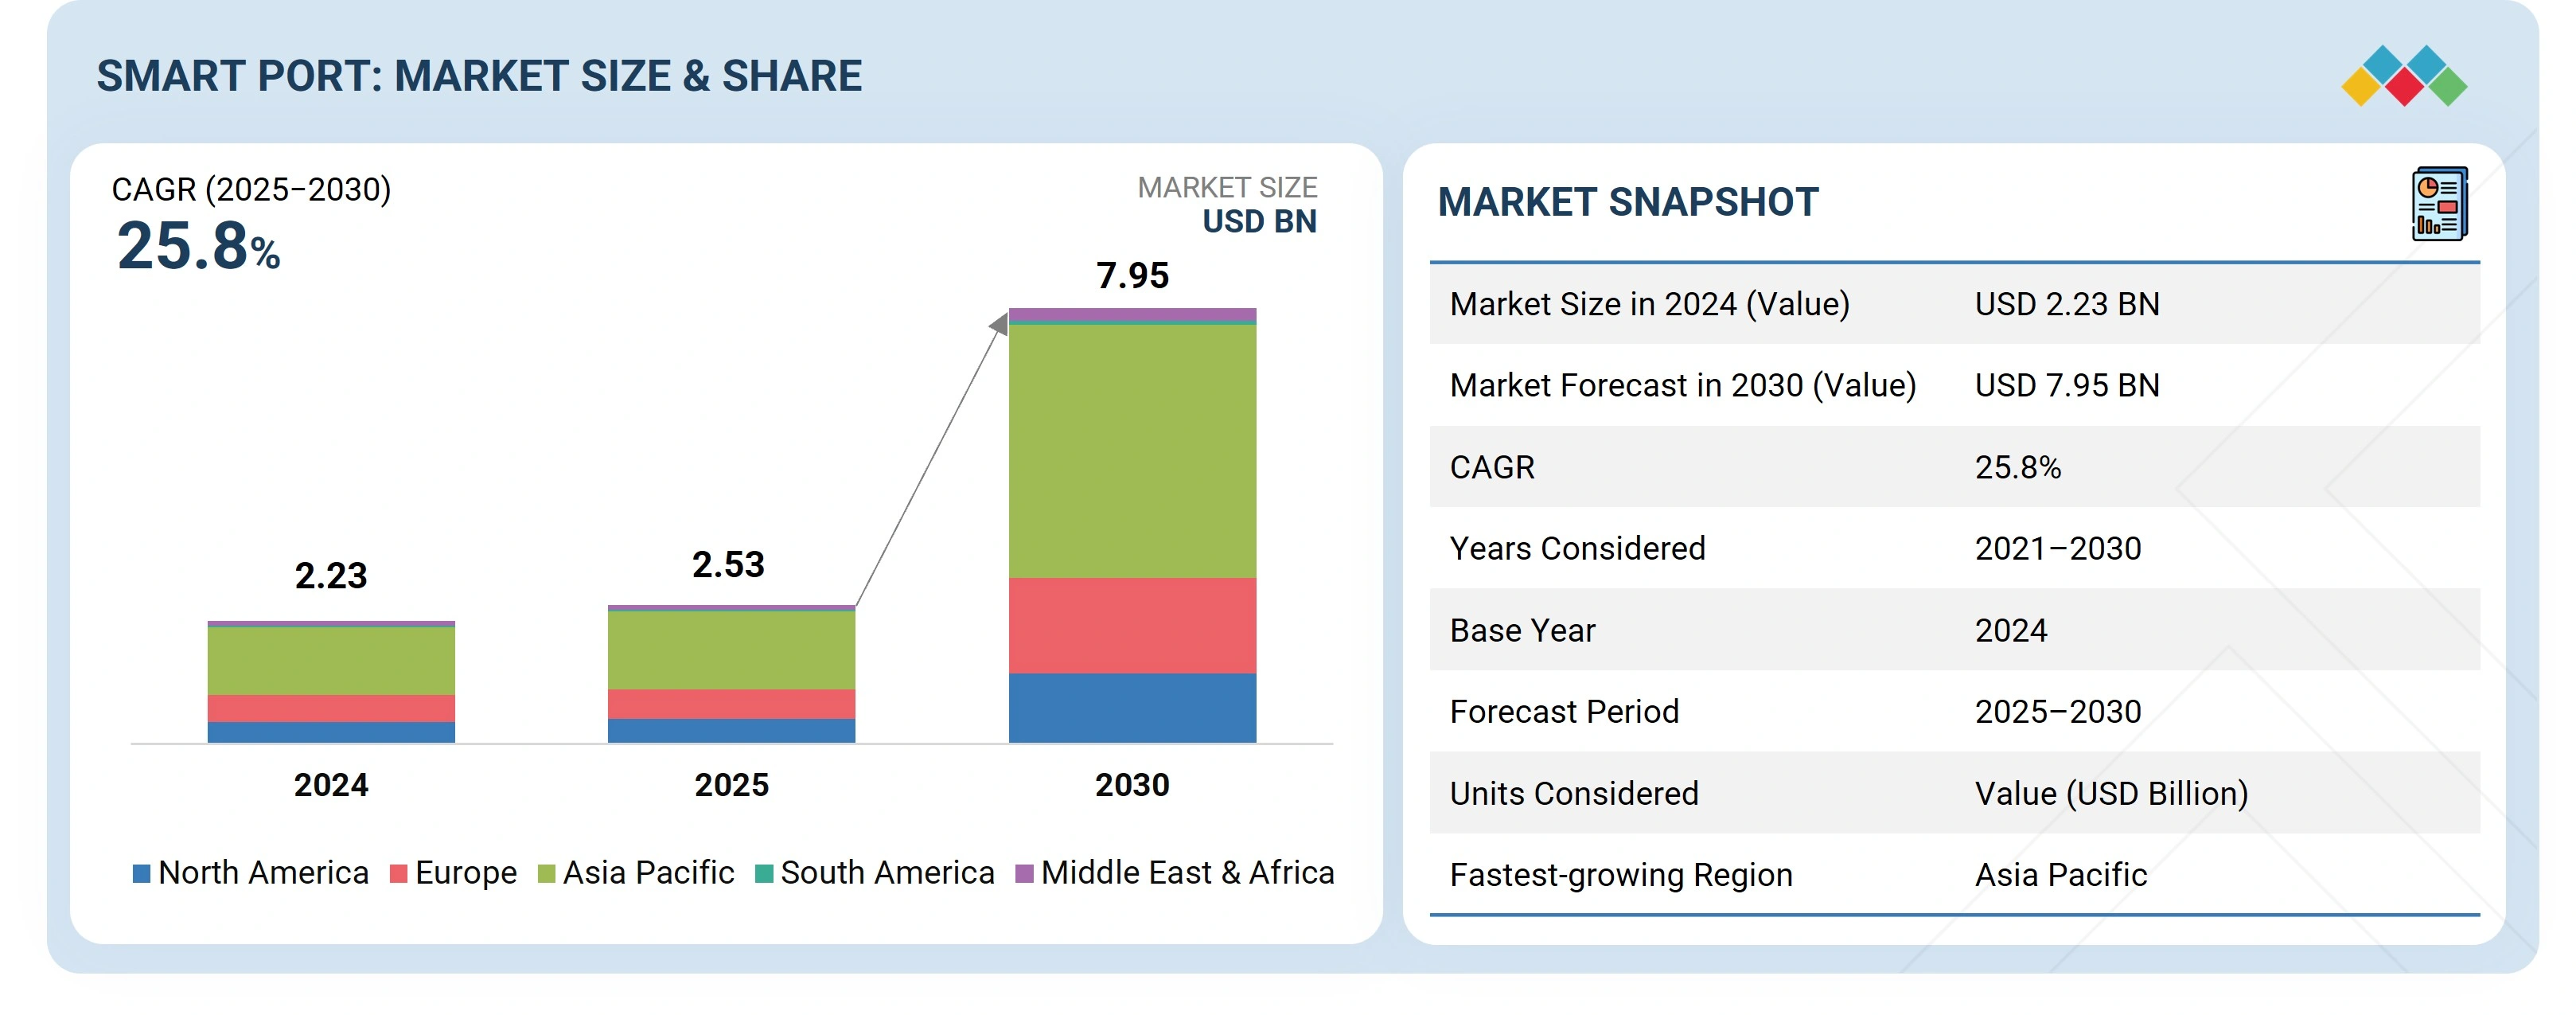
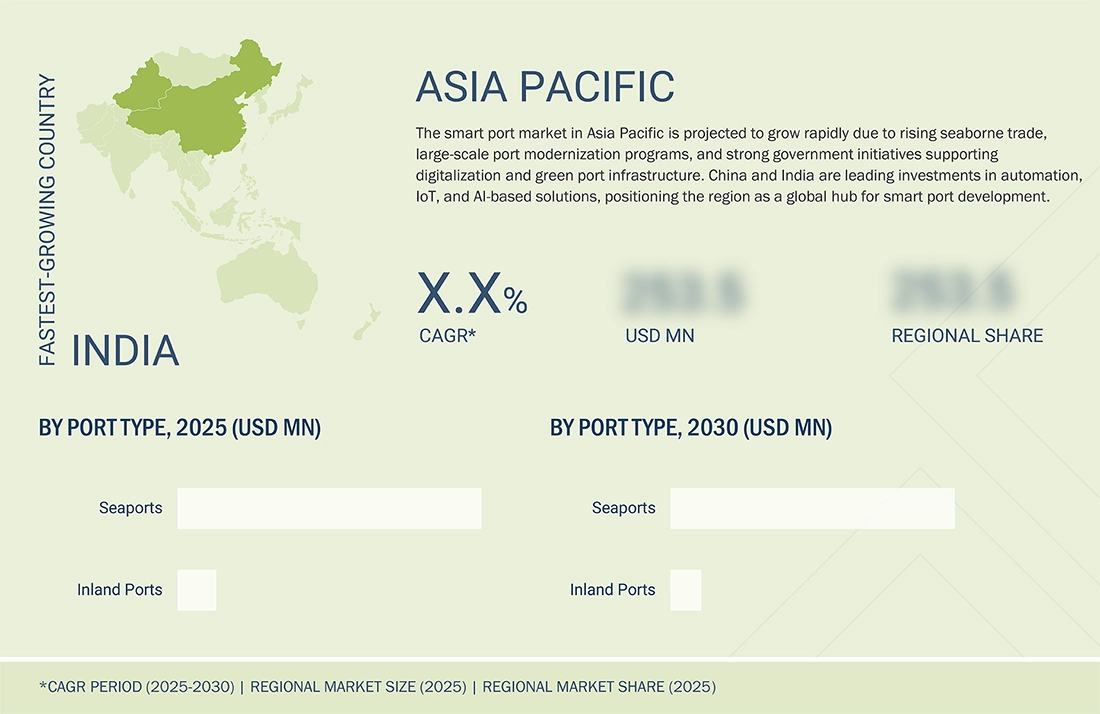
The global smart port market is expected to grow at a CAGR of 25.8% from 2025 to 2030, reaching USD 2.53 billion in 2025 and increasing to USD 7.95 billion by 2030. This growth is driven by the increasing need for efficient, secure, and environmentally friendly port operations. Using smart ports enables real-time management, streamlined cargo handling, shorter turnaround times, and reduced operational costs, making them essential to current maritime trade. Traditional ports are evolving into intelligent ecosystems through the gradual adoption of technologies such as AI, IoT, blockchain, and digital twin systems, allowing various interventions. Additionally, demand is rising significantly due to government initiatives to modernize and develop port facilities, especially in emerging economies. The effort to reduce carbon emissions and comply with global sustainability standards also encourages the implementation of smart energy and automation solutions at ports. As the cost of digital technologies continues to decline and integration becomes easier, smart ports are becoming more accessible and vital to the efficiency of the global supply chain.
Smart Port Market Size and Forecast:
- Market Size Value in 2024: USD 2.23 Billion
- Market Size Value in 2025: USD 2.53 Billion
- Revenue Forecast in 2030: USD 7.95 Billion
- Growth Rate: CAGR of 25.8% from 2025 to 2030
- Data available from 2021 to 2030
- The smart port infrastructure segment holds the largest market share due to increasing investments in digitalization, automation, and sustainable port operations.
Key Market Trends and Insights
- Market Growth: Driven by rising maritime trade volumes, increasing focus on reducing carbon emissions, and the growing need to improve operational efficiency across ports.
- Growing Trends: Adoption of IoT, artificial intelligence, blockchain, digital twins, and process automation technologies is transforming traditional ports into intelligent, connected ecosystems.
- Growth Opportunities: Government-led port modernization initiatives, investments in green infrastructure, and the renovation of existing ports are creating significant growth opportunities for market participants.
- Market Share Analysis: The smart port infrastructure segment accounts for the largest market share in 2025 owing to its critical role in enabling digital port operations, while the seaports segment remains the leading port type due to its dominance in global trade and cargo handling activities.
KEY TAKEAWAYS
-
BY TECHNOLOGYThe technology segment includes IoT, blockchain, process automation, and AI. IoT enables real-time tracking of vessels, cargo, and equipment. Blockchain ensures secure, paperless trade documentation. Process automation covers automated cranes, AGVs, and robotics for container handling. Artificial intelligence supports predictive analytics, vessel scheduling, and digital twin applications, enhancing overall operational efficiency.
-
BY THROUGHPUT CAPACITYThe throughput capacity segment includes high-throughput capacity ports, medium-throughput capacity ports, and low-throughput capacity ports. High-throughput ports manage large cargo volumes using advanced automation and digital infrastructure. Medium-throughput ports strike a balance between efficiency and scalability by implementing selective automation solutions. Low-throughput ports focus on cost-effective upgrades, such as basic traffic management and IoT-based monitoring.
-
BY ELEMENTThe element segment includes port traffic management systems, port community systems, terminal automation & cargo handling, smart port infrastructure, and smart port safety & security. Traffic management systems streamline vessel movements and berth allocation. Port community systems connect customs, logistics providers, and shipping lines. Terminal automation improves cargo handling with robotics and autonomous vehicles. Smart infrastructure integrates IoT sensors, renewable energy, and electrification. Safety and security solutions enhance surveillance, cyber protection, and predictive maintenance.
-
BY PORT TYPEThe port type segment includes seaports and inland ports. Seaports are the main hubs for global trade and are rapidly adopting smart technologies to optimize turnaround time, reduce congestion, and cut emissions. Inland ports leverage smart port solutions for seamless multimodal connectivity, efficient customs processes, and improved cargo visibility.
-
BY REGIONThe regions considered are North America, Europe, Asia Pacific, South America, and Middle East & Africa. Asia Pacific leads due to rising seaborne trade, large-scale port modernization projects, and strong government initiatives supporting digitalization and green port infrastructure. China and India are at the forefront of investments in automation, IoT, and AI-based solutions, positioning the region as a global hub for smart port development.
-
COMPETITIVE LANDSCAPEMajor market players use organic and inorganic strategies like partnerships and investments to drive growth in smart port applications. Companies such as GE, ABB, IBM, Wipro, and Siemens, have entered various agreements, contracts and product launches to meet the increasing demand for ports in innovative uses.
The projected increase in demand for smart ports results from port authorities, logistics operators, and government agencies working to improve operational efficiency, reduce energy use, lower carbon emissions, and meet stricter environmental and performance standards. Faster growth in global trade, urbanization, and e-commerce expansion further drive adoption, aided by sustainability efforts, digitalization policies, and quick advances in automation and AI-powered port solutions.
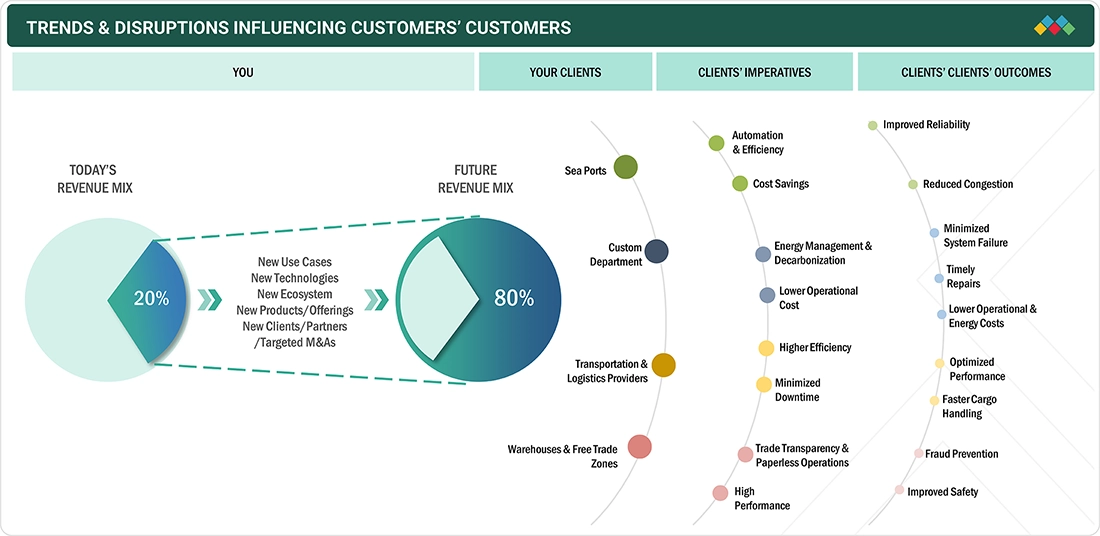
TRENDS & DISRUPTIONS IMPACTING CUSTOMERS' CUSTOMERS
The smart port market is expected to grow at a CAGR of 25.8% during the forecast period by value. The push for decarbonization, growing reliance on IoT, AI, and blockchain for port operations, and increasing demand for real-time visibility in global supply chains are driving market growth. Government-supported port modernization initiatives, along with private sector investments in digital and green infrastructure, are likely to create significant opportunities for technology providers and port operators.
Source: Secondary Research, Interviews with Experts, MarketsandMarkets Analysis
MARKET DYNAMICS
Level
-
•Rising maritime trade volumes

-
•Growing focus of maritime industry on reducing emissions

Level
-
Data breach issues reported by seaport clients

Level
-
•Government initiatives to develop smart port infrastructure

-
•Renovation of existing ports and development of new ports

Level
-
Technological complexity and system interoperability issues in port operations

Source: Secondary Research, Interviews with Experts, MarketsandMarkets Analysis
Driver: Rising maritime trade volumes
The growing volume and complexity of global maritime trade, especially in developing economies, significantly increases the demand for smarter, more flexible port infrastructure. Today, ports must handle longer shipping routes, changing trade patterns, and increased cargo traffic caused by climate-related disruptions and geopolitical tensions. These developments are prompting shipping companies to reconsider capacity and routing strategies, adding more operational pressure on ports. Meanwhile, regions like Asia Pacific have become key trade hubs, managing a substantial share of global imports and exports. This regional dominance urgently calls for intelligent port solutions that provide greater visibility, real-time decision-making, and better throughput management. Consequently, the adoption of technologies such as AI-driven logistics, IoT-based tracking, digital twins, and automated handling systems is accelerating, helping ports stay competitive, resilient, and sustainable amid changing global trade dynamics.
Restraint: Data breach issues reported by seaport clients
During the shift toward smart infrastructure, where IoT devices are widely used, AI systems, blockchain, cloud platforms, and other technologies are increasingly targeted by advanced cyberattacks that are harder to detect. These systems handle large amounts of data, making shipping manifests, cargo tracking information, and financial transactions especially appealing to cybercriminals. According to the Cost of a Data Breach Report 2024 by IBM, the average global cost of a data breach was USD 4.45 million, which is 15% higher than three years ago. The scale of the threat is evident in ports like the Port of Los Angeles, where about 40 million cyber intrusion attempts are recorded each month. A ransomware attack on Transnet in South Africa in 2021 caused major disruptions to its operations, demonstrating the real-world impact such cyberattacks can have on maritime logistics. As digital transformation advances, protecting cybersecurity and maintaining information integrity has become more critical. Concerns about data governance and compliance with international regulations like GDPR increase the risk of exposing client or shipper data. This threat could slow down the adoption of smart technologies, especially at smaller or underfunded ports. Therefore, effective cybersecurity measures are quickly becoming a key barrier to the fast deployment of smart port solutions.
Opportunity: Government initiatives to develop smart port infrastructure
The governments of various countries are making significant efforts to modernize port infrastructure, which has generated a tremendous opportunities in the smart port market. With the growth of global trade volume and the drive toward digital change, ports need to improve the efficiency with which they operate, lower their costs, and drive greater throughput levels without significant increases in physical footprint. To facilitate this change, governments are coming up with extensive funding programs. For instance, in 2024, the US Department of Transportation provided grants totaling USD 662 million under the Port Infrastructure Development Program (PIDP) to 41 smart port projects, and the UK government has committed more than 78 m in seed funding to Freeports in Scotland and Wales, and is investing further in its Freeports, with over 78 m in the UK SHORE program that aims to digitalize and automate maritime logistics. Such combined initiatives in the public sector stimulate advancements in the adaptation of technologies such as the IoT, AI-based logistics, digital twin platforms, and port community systems, setting a firm background for the evolution of smart ports on a global scale.
Challenge: Technological complexity and system interoperability issues in port operations
Heavy infrastructure development and technological upgrades pose one of the biggest threats to the smart port market. While digital transformation is essential to handle these changes in global shipping, as vessels grow larger, there’s a need to decarbonize, automate, and develop intelligent logistics, which usually require high capital costs. Most port authorities struggle to justify these investments, especially since they might not provide immediate financial returns and are less attractive to private investors, despite offering many societal and economic benefits. A well-funded port can use its resources to modernize, but many ports rely on public funding, partnerships, or government subsidies for updates. The fundamental infrastructure needs are inherently costly. When these costs are combined with the adoption of smart technologies, such as the Internet of Things (IoT), AI-powered platforms, digital twin systems, and enhanced cybersecurity, the financial burden increases significantly. This is further complicated by urbanization pressures, climate resilience demands, and environmental regulations, all requiring additional investment. Therefore, the transition of ports in developing regions toward smart and connected operations depends heavily on external funding.
Smart Port Market: COMMERCIAL USE CASES ACROSS INDUSTRIES
| COMPANY | USE CASE DESCRIPTION | BENEFITS |
|---|---|---|
 |
Uses smart port logistics platforms to optimize cargo tracking, automate customs clearance, and improve intermodal container movement | Leverages IoT sensors and AI for predictive supply chain visibility | Faster cargo turnaround, reduced delays, improved shipment transparency |
 |
Implements digital twin technology, IoT-enabled quay sensors, and AI-driven traffic management to enhance vessel scheduling, berth allocation, and real-time monitoring of port operations | Higher operational efficiency, reduced congestion, better energy/resource management |
 |
Deploys blockchain-enabled trade platforms (e.g., TradeLens), automated container handling systems, and shore-power electrification to make port operations greener and more efficient | Increased transparency in trade, reduced paperwork, lower emissions, faster container handling |
Logos and trademarks shown above are the property of their respective owners. Their use here is for informational and illustrative purposes only.
MARKET ECOSYSTEM
The smart port ecosystem represents a highly interconnected framework where technology providers, component suppliers, service distributors, and end users work in synergy. By integrating automation, digital platforms, and data-driven insights, ports can enhance operational efficiency, sustainability, and competitiveness in the global shipping and logistics landscape.
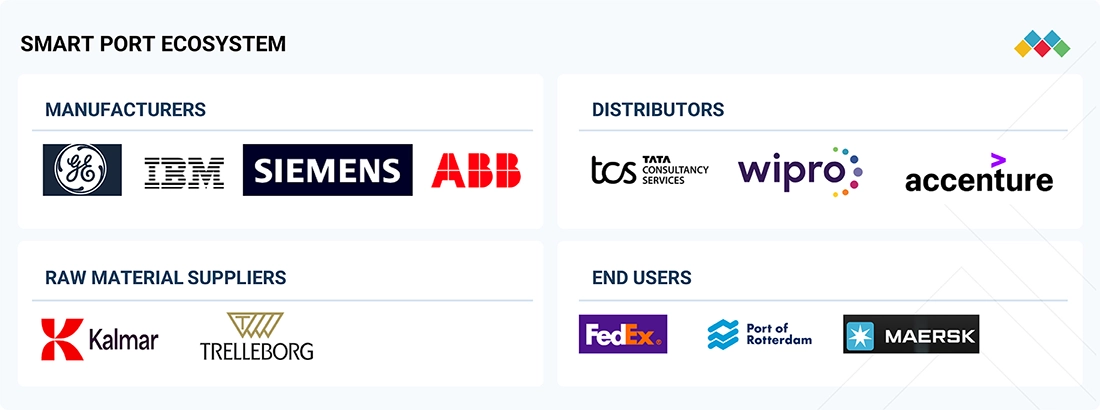
Logos and trademarks shown above are the property of their respective owners. Their use here is for informational and illustrative purposes only.
MARKET SEGMENTS
Source: Secondary Research, Interviews with Experts, MarketsandMarkets Analysis
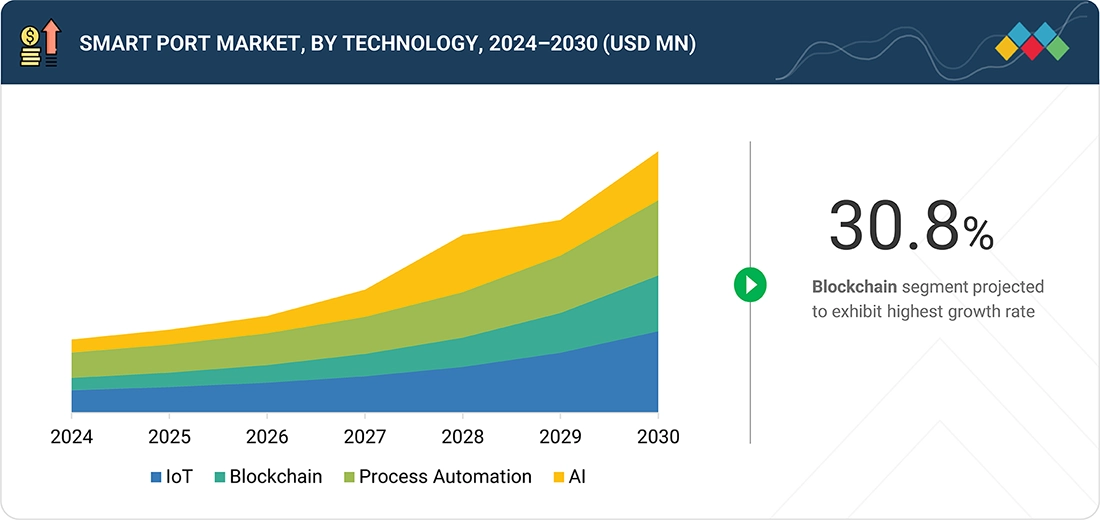
Smart Port Market, By Technology
The smart port market is segmented by technology into IoT, blockchain, process automation, and AI. IoT leads the market because it enables real-time monitoring of port assets, predictive maintenance, and efficient cargo tracking. IoT systems enhance operational visibility, reduce delays, and improve resource utilization, making them key to smart port transformation. Blockchain is gaining popularity for secure, transparent documentation and trade finance, while AI and automation are increasingly used for predictive analytics, traffic flow management, and robotic container handling.
Smart Port Market, By Throughput Capacity
The smart port market is segmented by throughput capacity into high, medium, and low throughput ports. High throughput capacity ports dominate the market as they handle the largest share of global container and bulk cargo. These ports face intense pressure to optimize turnaround times, reduce congestion, and enhance sustainability. smart technologies such as digital twins, automated container yards, and AI-based logistics coordination are widely deployed in this segment. Medium throughput ports are gradually adopting digital solutions, while low throughput ports remain in the early stages of adoption, primarily focusing on cost-effective IoT and automation systems.
Smart Port Market, By Port Type
The smart port market is divided by port type into seaports and inland ports. Seaports hold the largest market share as they serve as the main centers for international trade and container movement. With increasing global maritime trade, seaports are focusing on automation, IoT-powered asset monitoring, and blockchain-based customs processes to boost efficiency. Although smaller, inland ports are also adopting smart systems to enhance intermodal connections and reduce bottlenecks in regional trade networks.
Smart Port Market, By Element
The smart port market is divided by element into smart port infrastructure, terminal automation and cargo handling, port community systems, port traffic management systems, and smart port safety and security. Smart port infrastructure dominates the segment, including the digital and physical systems needed for port modernization. This includes smart grids, electrified equipment, automated quay cranes, and IoT-enabled cargo management systems. Terminal automation and port community systems are gaining popularity as ports aim to improve cargo flow and foster collaboration among stakeholders. Safety and security measures, such as surveillance systems and cybersecurity platforms, are also essential for ensuring resilient and efficient port operations.
REGION
Asia Pacific to be fastest-growing region in global smart port market during forecast period
The Asia Pacific is expected to be the fastest-growing market due to the rapid expansion of trade and port infrastructure development, along with the adoption of advanced digital technologies in both developed and emerging economies. Regional growth is accelerating as governments actively participate, exemplified by initiatives like the Sagarmala Program in India, the Digital Silk Road in China, and the development of integrated port networks across the ASEAN region. Additionally, investments in green and smart port infrastructure are increasing, driven by a focus on lower emissions, sustainability, and smarter logistics. These factors collectively establish Asia Pacific as the most dynamic and fastest-growing region in the smart port market.
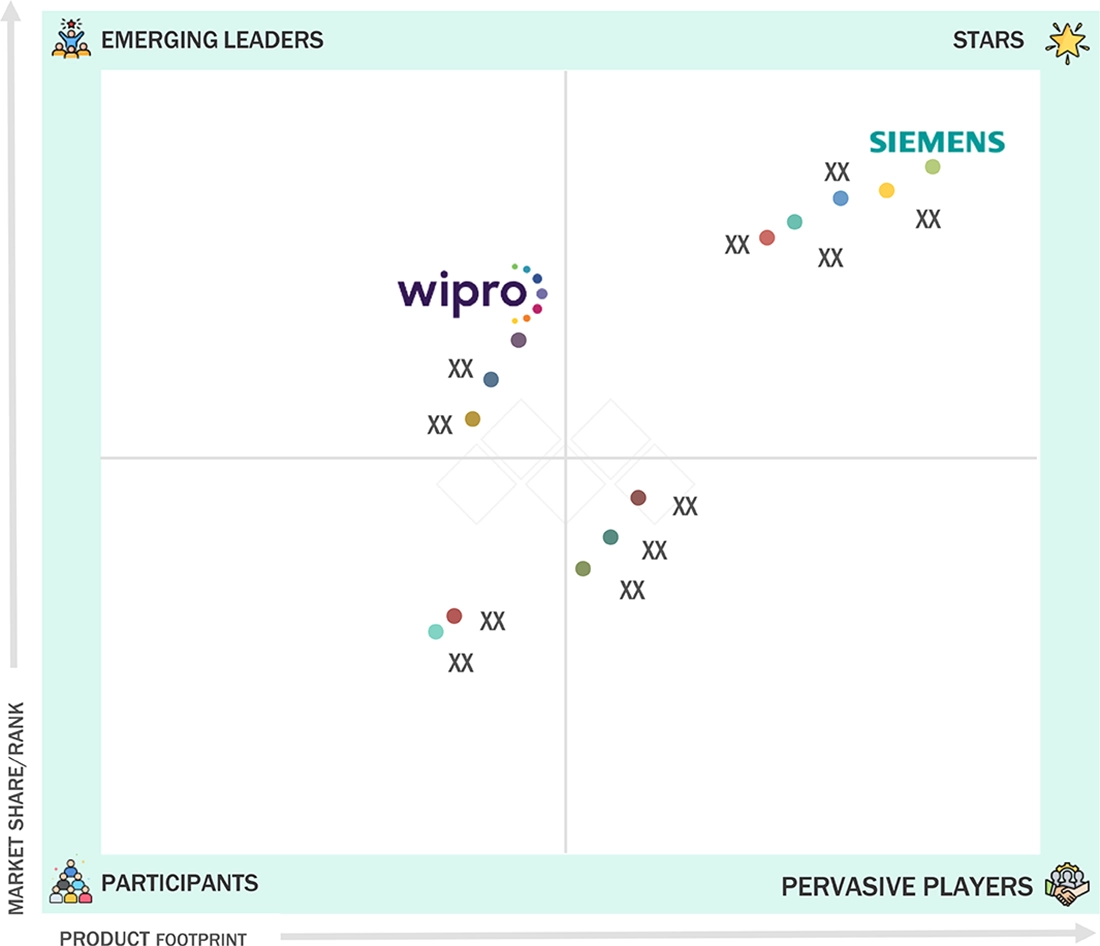
Smart Port Market: COMPANY EVALUATION MATRIX
In the smart port market matrix, Siemens (Star) leads with a strong market presence and a broad product portfolio, driving large-scale adoption across the industrial and commercial sectors. Wipro (Emerging Leader) is gaining traction with high efficiency in smart port solutions. While Siemens maintains dominance with scale, Wipro shows strong growth potential to move toward the leaders' quadrant.
Source: Secondary Research, Interviews with Experts, MarketsandMarkets Analysis
KEY MARKET PLAYERS
MARKET SCOPE
| REPORT METRIC | DETAILS |
|---|---|
| Market Size in 2024 (Value) | USD 2.23 BN |
| Market Forecast in 2030 (Value) | USD 7.95 BN |
| Growth Rate | CAGR 25.8% from 2025-2030 |
| Years Considered | 2021-2030 |
| Base Year | 2024 |
| Forecast Period | 2025-2030 |
| Units Considered | Value (USD Million/Billion) |
| Report Coverage | Revenue forecast, company ranking, competitive landscape, growth factors, and trends |
| Segments Covered |
|
| Regions Covered | North America, Europe, Asia Pacific, South America, Middle East & Africa |
WHAT IS IN IT FOR YOU: Smart Port Market REPORT CONTENT GUIDE
DELIVERED CUSTOMIZATIONS
We have successfully delivered the following deep-dive customizations:
| CLIENT REQUEST | CUSTOMIZATION DELIVERED | VALUE ADDS |
|---|---|---|
| US-based Smart port Solutions Providers | Detailed company profiles of competitors (financials, product portfolio)\ | Identify interconnections and supply chain blind spots |
| End User Segmentation | Comprehensive list of customers with segmentation by end user | Insights on revenue shifts towards emerging composite applications |
| Smart Port System | Transformative improvements in efficiency and performance, balancing initial cost challenges with long-term operational and system-level economic advantages | Support entry into utilities value chain with tailored opportunity mapping |
| US-based Smart Port Technology Supplier | Global & regional capacity benchmarking | Strengthen forward integration strategy |
| Smart Port Customer | Patent landscape & IP strength mapping in smart port system in various ports | Support backward integration into smart port sourcing |
RECENT DEVELOPMENTS
- June 2025 : IBM introduced a software tool aimed at uniting AI security and governance teams within an organization. This innovative solution combines watsonx.governance and Guardium AI Security, offering comprehensive insights into the enterprise's risk landscape. By considering future developments, the program improves the security and accountability of AI systems. As a result, AI becomes safer and more responsible as it is integrated into various operations.
- June 2025 : Accenture announced the AI Refinery distiller agentic framework and SDKs, which offer developers an enterprise-ready platform to easily create, deploy, and scale high-quality AI agents. This framework supports the entire agent lifecycle, including memory management, multi-agent collaboration, workflow management, model customization, governance, observability, and cross-platform interoperability.
- February 2025 : Accenture teamed up with Google Cloud to promote cloud and generative AI solutions in Saudi Arabia. This partnership aims to meet local needs related to data, operations, and software sovereignty. It focuses on helping companies build a modern digital foundation, discover new business opportunities, and enhance customer interactions by scaling generative AI agents for better efficiency and intelligence.
- July 2025 : Siemens acquired ebm-papst's industrial drive technology business, now sold as Mechatronic Systems. The portfolio includes built-in, smart drive systems like autonomous transport and extra-low-voltage protection systems. The acquisition is said to expand the capabilities of the Siemens Xcelerator platform, offering increased automation and market reach for battery-powered drive and robotic solutions.
- April 2023 : GE Power Conversion secured a contract to design and deliver electrical modules to Keppel Shipyard for installation on the Petrobras FPSO vessels P-80 and P-83. The modules for powering and controlling the vessels will be built in Asia and assembled in Singapore. This contract leverages GE's expertise from Asia and Brazil to support offshore energy generation in Brazil. GE Power Conversion will design and supply medium- and low-voltage switchboards, motor control centers, transformers, and UPS systems, manufactured in Asia and integrated in Singapore. The project aims to improve offshore energy production in Brazil.
Table of Contents
![]() Exclusive indicates content/data unique to MarketsandMarkets and not available with any competitors.
Exclusive indicates content/data unique to MarketsandMarkets and not available with any competitors.
Methodology
The study involved major activities in estimating the current size of the smart port market. Exhaustive secondary research was done to collect information on the peer and parent markets. The next step was to validate these findings, assumptions, and sizing with industry experts across the value chain through primary research. Both top-down and bottom-up approaches were employed to estimate the complete market size. Thereafter, market breakdown and data triangulation techniques were used to estimate the market size of the segments and subsegments.
Secondary Research
This research study on the smart port market involved the use of extensive secondary sources, directories, and databases, such as Hoovers, Bloomberg, Businessweek, Factiva, International Energy Agency, and BP Statistical Review of World Energy, to identify and collect valuable information for a technical, market-oriented, and commercial study of the global smart port market. Other secondary sources included annual reports, press releases, and investor presentations of companies, white papers, certified publications, articles by recognized authors, manufacturer associations, trade directories, and databases.
Primary Research
The smart port market comprises stakeholders such as smart port technology providers, infrastructure developers, and support service providers in the supply chain. The demand side of this market is characterized by the rising demand for smart port solutions in nations due to the increasing need for port efficiency, real-time data analytics, and predictive operations in aging port infrastructure and expanding global trade volumes. The supply side is characterized by rising demand for smart infrastructure contracts from port authorities and operators, and mergers and acquisitions among major industry players. Various primary sources from both the supply and demand sides of the market were interviewed to obtain qualitative and quantitative information. The following is the breakdown of primary respondents:

Note: Other designations include sales managers, engineers, and regional managers.
The tiers of the companies are defined based on their total revenue as of 2024: Tier 1: >USD 1 billion, Tier 2:
USD 500 million–1 billion, and Tier 3:
To know about the assumptions considered for the study, download the pdf brochure
Market Size Estimation
Both the top-down and bottom-up approaches were used to estimate and validate the size of the smart port market and its dependent submarkets. The key players in the market were identified through secondary research, and their market share in the respective regions was obtained through primary and secondary research. The research methodology includes studying the annual and financial reports of top market players and interviews with industry experts, such as chief executive officers, vice presidents, directors, sales managers, and marketing executives, for key quantitative and qualitative insights related to the smart port market.
Smart Port Market : Top-Down and Bottom-Up Approach

Data Triangulation
After arriving at the overall market size from the estimation process explained above, the total market was split into several segments and subsegments. The data triangulation and market breakdown processes were employed to complete the overall market engineering process and arrive at the exact statistics for all the segments and subsegments, wherever applicable. The data was triangulated by studying various factors and trends from both the demand and supply sides. The market was also validated using both the top-down and bottom-up approaches.
Market Definition
According to the Asian Development Bank, a smart port is equipped with sensors, cameras, and different types of devices, which help eliminate wastage of space, time, capital, and natural resources. Smart ports use smart technologies such as the Internet of Things (IoT), blockchain, artificial intelligence (AI), and process automation, which help enhance operational efficiency, cargo handling, passenger services, and port performance, ultimately reducing costs. These technologies allow the connection of the digital and physical worlds by providing real-time data and optimizing resources. A few major advantages associated with smart ports include eliminating human errors, faster turnaround time (increased productivity), and reduced port congestion. The smart port concept has been heavily influenced by the rise of Industry 4.0 (the Fourth Industrial Revolution) and its confluence with the Internet of Things (IoT). The manufacturing industry initially led industry 4.0. Since the port sector is an integral part of a manufacturer’s value chain, Industry 4.0 and IoT have been introduced into port operations as well, aiming at more efficient operations with less waste of space, time, and resources, resulting in the smart port concept. The flow of goods in the supply chain is a key focus of smart ports, but the other roles a port plays can equally benefit from smart initiatives—asset management, environmental protection, and staff support.
Stakeholders
- Maritime associations
- Port authorities and operators
- IoT and cloud-based solution providers
- Research and consulting companies in the marine sector
- Ship manufacturers
- Smart port equipment manufacturers
- AI solution providers
- Technology providers
- Banks and financial institutions
- Government organizations
- Investors/shareholders
- Logistic companies
- Barge operators
- Rail operators
- Terminal operators
- Cargo owners
Report Objectives
- To define, describe, segment, and forecast the smart port market based on element, technology, throughput capacity, port type, and region, in terms of value
- To describe and forecast the smart port market for various segments with respect to five main regions: North America, Europe, Asia Pacific, South America, and the Middle East & Africa, in terms of value
- To provide detailed information regarding drivers, restraints, opportunities, and challenges influencing the growth of the market
- To provide a detailed overview of the smart port value chain analysis, use case analysis, key stakeholders, buying criteria, patent analysis, trade analysis, tariff analysis, regulations and codes, pricing analysis, Porter’s five forces analysis, and impact of AI and 2025 US tariff on the market under study
- To strategically analyze micromarkets1 with respect to individual growth trends, prospects, and contributions to the total market
- To analyze opportunities in the market for various stakeholders by identifying high-growth segments
- To strategically profile key players and comprehensively analyze their market position regarding ranking and core competencies2, along with detailing the market’s competitive landscape.
- To analyze growth strategies adopted by market players, such as joint ventures, partnerships, mergers and acquisitions, contracts, agreements, and product launches in the smart port market
1. Micromarkets are defined as the segments and subsegments of the smart port market included in the report.
2. Core competencies of companies are defined in terms of the key developments and strategies adopted to sustain their position in the smart port market.
Available Customizations
MarketsandMarkets offers customizations according to the specific needs of the companies with the given market data.
The following customization options are available for the report:
Product Analysis
- Product matrix, which gives a detailed comparison of the product portfolio of each company
Geographic Analysis as per Feasibility
- Further breakdown of the smart port, by country
Company Information
- Detailed analysis and profiling of additional market players (up to five)
Key Questions Addressed by the Report
What was the smart port market size in 2024?
The smart port market size was USD 2.23 billion in 2024.
What are the major drivers for the smart port market?
The smart port market is mainly driven by the growing need to enhance the efficiency of port operations, reduce carbon footprint, and the surge in the adoption of Industry 4.0 technologies.
Which region is projected to be the fastest-growing smart port market during the forecast period?
Asia Pacific is expected to be the fastest-growing market between 2025 and 2030, fueled by rapid trade growth, major port modernization initiatives, and strong government-led digitalization efforts.
Which segment, by port type, will hold a larger market share during the forecast period?
Seaports are expected to hold a larger share of the smart port market.
Which segment is projected to be the largest, by technology, in the smart port market throughout the forecast period?
The Internet of Things is likely to account for the largest market share throughout the forecast period.


Growth opportunities and latent adjacency in Smart Port Market