
Asia Pacific AI Infrastructure Market (2024-2029)

The Asia Pacific AI Infrastructure Market was valued at $46182.4 Million in 2024 and projected to reach to $156607.6 Million by 2029, representing a compound annual growth rate of 22.6%. Asia Pacific's AI Infrastructure Market is poised for explosive growth, expanding from $46,182.4 million in 2024 to $156,607.6 million by 2029.


| Market Size in | USD 26.32 MN |
| Market Forecast in | |
| CAGR | |
| Forecast Period | |
| Units Considered | Value (USD MN) |
Asia Pacific AI Infrastructure Market Trends and Insights
- This represents a compound annual growth rate of 22.6%, outpacing the global average and reflecting the region's accelerating investment in AI-driven technologies, data centers, and semiconductor manufacturing.
- Asia Pacific's dominance is driven by major economies including China, India, Japan, and South Korea, which are rapidly scaling AI capabilities across cloud computing, edge computing, and enterprise applications. The robust growth trajectory in Asia Pacific is underpinned by increasing government initiatives, substantial venture capital funding, and the region's position as a global manufacturing hub for semiconductors and computing hardware.
- Asia Pacific's AI infrastructure investments are concentrated in GPU clusters, TPUs, networking equipment, and cooling solutions required to support large language models and generative AI workloads.
- By 2029, Asia Pacific is expected to solidify its role as a critical engine for global AI infrastructure deployment, with emerging markets contributing alongside established tech leaders..
Key Market Statistics
- CAGR (2024-2029) 22.6% CAGR
- Market Size, 2024 ~USD 46182.4 Million
- Forecast, 2029 ~USD 156607.6 Million
- Geography Asia Pacific
Asia Pacific AI Infrastructure Market Overview
Regional Market Leadership :
Asia Pacific's AI Infrastructure Market is valued at $46,182.4 million in 2024, commanding a substantial share of global AI infrastructure investments and positioning the region as a critical hub for semiconductor and data center development.
Accelerated Growth Trajectory :
With a CAGR of 22.6% through 2029, Asia Pacific significantly outpaces the global average of 19.4%, driven by massive investments in AI chip manufacturing, cloud infrastructure, and enterprise AI adoption across the region.
China & Japan Dominance :
China ($62,121 million) and Japan ($45,938.2 million) are the market powerhouses, collectively representing over 70% of Asia Pacific's AI infrastructure spending, fueled by government initiatives and tech industry expansion.
Emerging Growth Opportunities :
India ($21,142 million) and South Korea ($9,761.9 million) represent high-growth emerging markets within Asia Pacific, with rapidly expanding AI ecosystems and increasing foreign direct investment in semiconductor and data center infrastructure.
Asia Pacific AI Infrastructure Market Dynamics
- This 22.6% CAGR reflects the region's strategic positioning as the global leader in semiconductor manufacturing, data center deployment, and AI technology adoption.
- Government initiatives across China, Japan, and India, combined with private sector investments, are accelerating infrastructure buildout to support AI workloads and edge computing capabilities. The region's growth is underpinned by increasing demand for GPUs, AI accelerators, and specialized chips from tech giants and emerging startups.
- Supply chain resilience efforts and geopolitical factors are driving localized manufacturing and infrastructure investments.
- Asia Pacific's dominance in electronics manufacturing, coupled with rising AI adoption in financial services, healthcare, and manufacturing sectors, ensures sustained momentum through 2029 and beyond..
Market Ecosystem
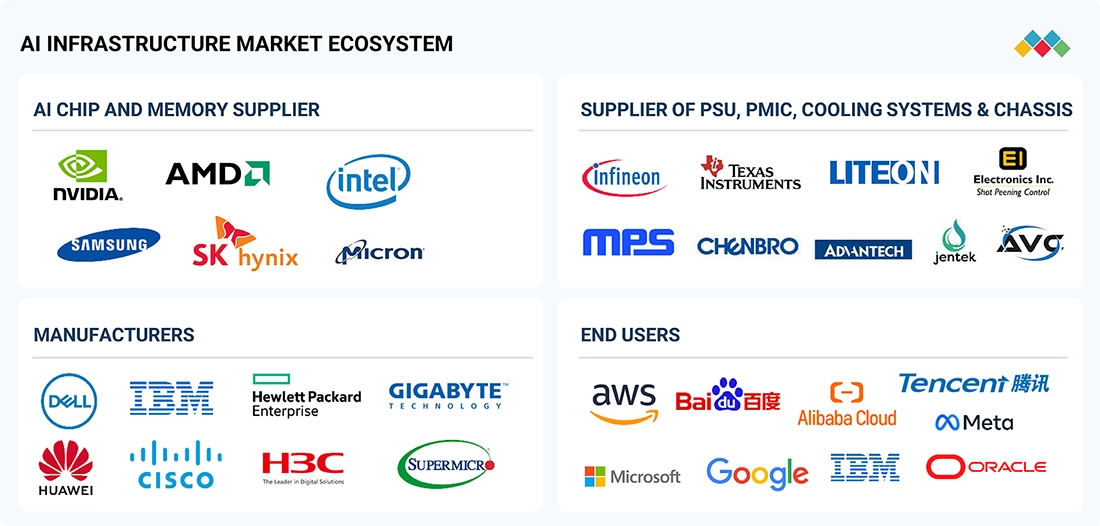
AI INFRASTRUCTURE MARKET SIZE, SHARE AND TRENDS: COMMERCIAL USE CASES ACROSS INDUSTRIES
| COMPANY | USE CASE DESCRIPTION | BENEFITS |
|---|---|---|
 |
DGX H100 AI servers deployed by Meta for Llama training clusters. | DGX H100 AI servers deployed by Meta for Llama training clusters. |
 |
Liquid-cooled GPU servers used by Oracle Cloud for cloud-scale AI training. | Liquid-cooled GPU servers used by Oracle Cloud for cloud-scale AI training. |
 |
XE9680 AI servers used in healthcare for imaging diagnostics and radiology AI. | XE9680 AI servers used in healthcare for imaging diagnostics and radiology AI. |
 |
Cray AI servers deployed at NASA for climate simulation and deep learning workloads. | Cray AI servers deployed at NASA for climate simulation and deep learning workloads. |
 |
AI servers running edge inference models for smart manufacturing plants (Foxconn case). | Real-time defect detection, higher productivity, reduced downtime. |
Logos and trademarks shown above are the property of their respective owners. Their use here is for informational and illustrative purposes only.
Related Ecosystem
Electronics System And Components
- Sensors
- Temperature Sensors
- Pressure Sensors
- Actuators
- Image Sensors
- Lenovo
- Samsung
- Texas Instruments Incorporated
- HONEYWELL INTERNATIONAL INC.
- Teledyne Technologies Incorporated
Information System And Analytics
- Machine Learning
- Natural Language Processing (NLP)
- Sensors
- Software as A Service (SaaS)
- Data Loss Prevention (DLP)
- International Business Machines Corporation
- MICROSOFT CORPORATION
- Amazon.com, Inc.
- Oracle Corporation
Key Takeaways
- Asia Pacific's AI Infrastructure Market is projected to grow from $46.2B in 2024 to $156.6B by 2029, representing a 22.6% CAGR that exceeds global growth rates.
- Asia Pacific's semiconductor manufacturing dominance and government AI initiatives position the region as the fastest-growing market for AI infrastructure globally.
- Major Asia Pacific economies including China, India, Japan, and South Korea are driving demand for GPUs, data center capacity, and edge computing infrastructure.
- Asia Pacific's AI infrastructure investments are critical to supporting generative AI, cloud computing, and enterprise digital transformation across the region.
AI Infrastructure Market Report Scope
| Report Metric | Details |
|---|---|
| Base Year | 2024 |
| Fastest Growing Segment | NETWORK (Offering) |
| Forecast Period | 2024-2029 |
| Growth Rate | CAGR of 19.4% from 2024 to 2029 |
| Largest Segment | COMPUTE (Offering) |
| Market Size Base Year (Billions) | ~USD 136.14 (2024) |
| Revenue Forecast (Billions) | ~USD 330.37 (2029) |
| Segments Covered | Processor Type, Function, Offering, Compute, Type, Deployment, Application, End User, Enterprise Type, Memory Type, Network Type |
Asia Pacific AI Infrastructure Market Report Segmentation
11 segment dimensions are covered across the global market.
By Processor Type
- Asic-Based Servers
- Fpga-Based Servers
- Gpu-Based Servers
By Function
- Inference
- Training
By Offering
- Compute
- Memory
- Network
- Server Software
- Storage
By Compute
- Athena
- Cpu
- Dojo & Fsd
- Fpga
- Gpu
- Lpu
- Mtia
- Other Asic
- T-Head
- Tpu
- Trainium & Inferentia
By Type
- Autoencoders
- Convolutional Neural Networks (Cnns)
- Ddr
- Deep Learning
- Ethernet
- Generative Adversarial Networks (Gans)
- Hbm
- Infiniband
- Interconnects
- Nic/Network Adapters
- Rule-Based Models
- Statistical Models
- Transformer Models
By Deployment
- Cloud
- Hybrid
- On-Premises
By Application
- Computer Vision
- Generative AI
- Machine Learning
- Natural Language Processing
By End User
- Cloud Service Providers
- Enterprises
- Government Organizations
By Enterprise Type
- Automotive
- Bfsi
- Healthcare
- Media & Entertainment
- Other Enterprises
- Retail & E-Commerce
By Memory Type
- Ddr
- Hbm
By Network Type
- Interconnects
- Nic/Network Adapters
Target Audience
- Semiconductor Manufacturers : Semiconductor companies need Asia Pacific market intelligence to optimize chip design portfolios, identify regional demand patterns for AI accelerators and GPUs, and plan manufacturing capacity expansion across China, Taiwan, and South Korea.
- Data Center Operators & Cloud Providers : Cloud infrastructure providers require detailed Asia Pacific market data to guide data center site selection, infrastructure investment prioritization, and competitive positioning in high-growth markets like India and Southeast Asia.
- Enterprise Technology Leaders : CIOs and enterprise IT decision-makers need Asia Pacific-specific insights to benchmark AI infrastructure spending, evaluate regional vendor ecosystems, and plan digital transformation initiatives aligned with regional market trends.
- Investment & Private Equity Firms : Investors targeting Asia Pacific's AI infrastructure sector require market sizing, growth forecasts, and country-level opportunity analysis to identify acquisition targets, fund allocation strategies, and portfolio company expansion opportunities.
- Government & Policy Makers : Regional government agencies and policy bodies need comprehensive market intelligence to inform AI infrastructure investment strategies, semiconductor industry development programs, and technology sovereignty initiatives across Asia Pacific.
Countries within Asia Pacific - compare and drill down
| Country | 2025 size (native) |
|---|---|
| China | USD 62121 Million |
| Japan | USD 45938.2 Million |
| India | USD 21142 Million |
| South Korea | USD 9761.9 Million |
| Rest Of Asia Pacific | USD 17644.5 Million |
Country market size visualization
Reasons to Buy this Report
- Regional Market Sizing & Forecasts : Gain precise market valuations for Asia Pacific ($46.2B in 2024) and country-level breakdowns for China, Japan, India, and South Korea, enabling targeted investment and expansion strategies in high-growth AI infrastructure segments.
- Competitive Landscape Intelligence : Understand regional competitive dynamics, key players in semiconductor manufacturing and data center operations, and market share distribution across Asia Pacific's fragmented but rapidly consolidating AI infrastructure ecosystem.
- Growth Driver Analysis : Identify region-specific catalysts including government AI initiatives, semiconductor supply chain localization, enterprise AI adoption rates, and infrastructure investment trends unique to Asia Pacific markets.
- Country-Level Opportunity Assessment : Evaluate market potential across individual Asia Pacific nations with differentiated growth profiles, regulatory environments, and infrastructure maturity levels to prioritize market entry and partnership strategies.
- Strategic Planning & Risk Mitigation : Leverage Asia Pacific-specific insights on geopolitical factors, supply chain resilience, technology standards, and investment trends to inform long-term business strategy and capital allocation decisions in the region.
Frequently asked questions
What is the current size of the AI Infrastructure Market in Asia Pacific?
Asia Pacific's AI Infrastructure Market was valued at $46,182.4 million in 2024 and is expected to reach $156,607.6 million by 2029.
What is the growth rate for AI Infrastructure in Asia Pacific?
Asia Pacific's AI Infrastructure Market is growing at a compound annual growth rate (CAGR) of 22.6% from 2024 to 2029.
Which countries are driving AI Infrastructure growth in Asia Pacific?
China, India, Japan, and South Korea are the primary drivers of AI Infrastructure growth in Asia Pacific, supported by government initiatives and substantial private investment.
What types of AI Infrastructure are in highest demand in Asia Pacific?
Asia Pacific demand is concentrated on GPUs, TPUs, data center capacity, networking equipment, and cooling solutions required for large language models and generative AI workloads.
How does Asia Pacific's growth compare to the global AI Infrastructure Market?
Asia Pacific's 22.6% CAGR outpaces the global average of 19.4%, making it the fastest-growing region for AI Infrastructure investment.
RESEARCH METHODOLOGY
The research process for this technical, market-oriented, and commercial study of the AI infrastructure market included the systematic gathering, recording, and analysis of data about companies operating in the market. It involved the extensive use of secondary sources, directories, and databases (Factiva, Oanda, and OneSource) to identify and collect relevant information. In-depth interviews were conducted with various primary respondents, including experts from core and related industries and preferred manufacturers, to obtain and verify critical qualitative and quantitative information as well as to assess the growth prospects of the market. Key players in the AI infrastructure market were identified through secondary research, and their market rankings were determined through primary and secondary research. This included studying annual reports of top players and interviewing key industry experts, such as CEOs, directors, and marketing executives.
Secondary Research
In the secondary research process, various secondary sources were used to identify and collect information for this study. These include annual reports, press releases, and investor presentations of companies, whitepapers, certified publications, and articles from recognized associations and government publishing sources. Research reports from a few consortiums and councils were also consulted to structure qualitative content. Secondary sources included corporate filings (such as annual reports, investor presentations, and financial statements); trade, business, and professional associations; white papers; Journals and certified publications; articles by recognized authors; gold-standard and silver-standard websites; directories; and databases. Data was also collected from secondary sources, such as the International Trade Centre (ITC) (Switzerland), and the International Monetary Fund (IMF).
List of key secondary sources
|
Source |
Web Link |
|
Generative AI Association (GENAIA) |
https://www.generativeaiassociation.org/ |
|
Association for Machine Learning and Application (AMLA) |
https://www.icmla-conference.org/ |
|
Association for the Advancement of Artificial Intelligence |
https://aaai.org/ |
|
European Association for Artificial Intelligence |
https://eurai.org/ |
|
International Monetary Fund |
https://www.umaconferences.com/ |
|
Institute of Electrical and Electronics Engineers (IEEE) |
https://ieeexplore.ieee.org/ |
Primary Research
Extensive primary research was accomplished after understanding and analyzing the AI infrastructure market scenario through secondary research. Several primary interviews were conducted with key opinion leaders from both demand- and supply-side vendors across four major regions—North America, Europe, Asia Pacific, and RoW. Approximately 30% of the primary interviews were conducted with the demand side, and 70% with the supply side. Primary data was collected through questionnaires, emails, and telephonic interviews. Various departments within organizations, such as sales, operations, and administration, were contacted to provide a holistic viewpoint in the report.
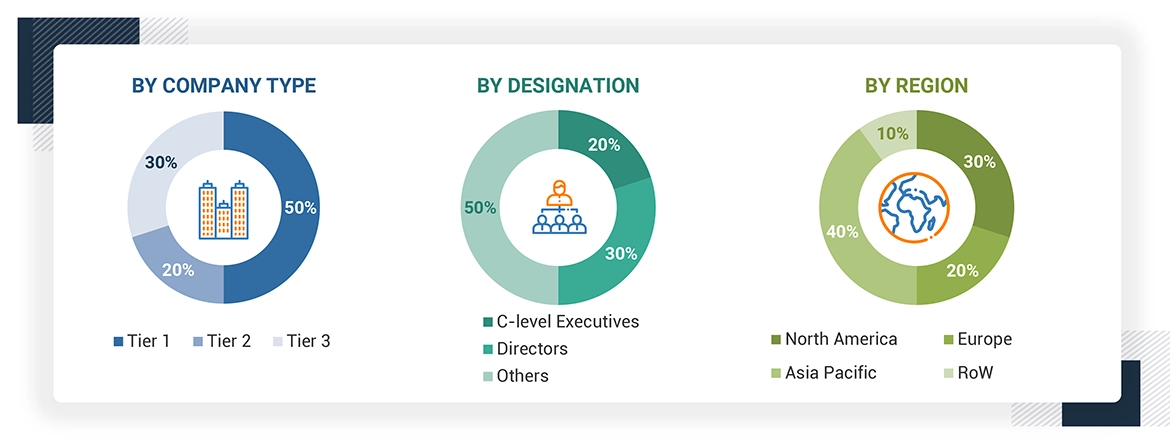
Note: Other designations include technology heads, media analysts, sales managers, marketing managers, and product managers.
The three tiers of the companies are based on their total revenues as of 2023 ? Tier 1: >USD 1 billion, Tier 2: USD 500 million–1 billion, and Tier 3: USD 500 million.
To know about the assumptions considered for the study, download the pdf brochure
Market Size Estimation
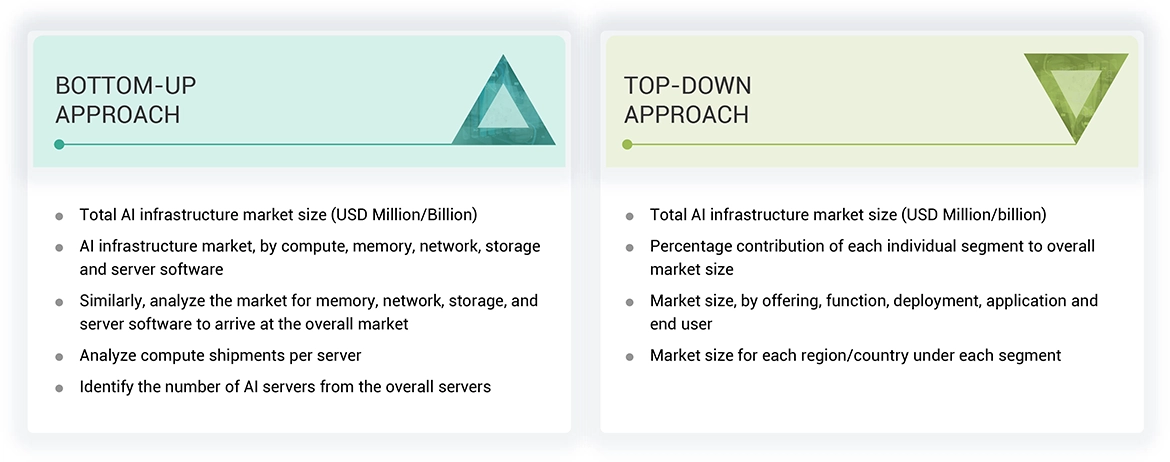
In the complete market engineering process, top-down and bottom-up approaches and several data triangulation methods have been used to perform the market size estimation and forecasting for the overall market segments and subsegments listed in this report. Extensive qualitative and quantitative analyses have been performed on the complete market engineering process to list the key information/insights throughout the report. The following table explains the process flow of the market size estimation.
The key players in the market were identified through secondary research, and their rankings in the respective regions determined through primary and secondary research. This entire procedure involved the study of the annual and financial reports of top players, and interviews with industry experts such as chief executive officers, vice presidents, directors, and marketing executives for quantitative and qualitative key insights. All percentage shares, splits, and breakdowns were determined using secondary sources and verified through primary sources. All parameters that affect the markets covered in this research study were accounted for, viewed in extensive detail, verified through primary research, and analyzed to obtain the final quantitative and qualitative data. This data was consolidated, supplemented with detailed inputs and analysis from MarketsandMarkets, and presented in this report.
AI Infrastructure Market : Top-Down and Bottom-Up Approach
Bottom-Up Approach
- Initially, the companies offering AI infrastructure were identified. Their products were mapped based on offering, function, deployment, application, and end user.
- After understanding the different types of AI infrastructure offering by various manufacturers, the market was categorized into segments based on the data gathered through primary and secondary sources.
- To derive the global AI infrastructure market, global server shipments of top players for AI servers considered in the report's scope were tracked
- A suitable penetration rate was assigned for computing, memory, network, storage, and server software offerings to derive the shipments of AI infrastructure.
- We derived the AI infrastructure market based on different offerings using the average selling price (ASP) at which a particular company offers its devices. The ASP of each offering was identified based on secondary sources and validated from primaries.
- For the CAGR, the market trend analysis was carried out by understanding the industry penetration rate and the demand and supply of AI infrastructure offerings for different end users.
- The AI infrastructure market is also tracked through the data sanity method. The revenues of key providers were analyzed through annual reports and press releases and summed to derive the overall market.
- For each company, a percentage is assigned to its overall revenue or, in a few cases, segmental revenue to derive its revenue for the AI Infrastructure. This percentage for each company is assigned based on its product portfolio and range of AI infrastructure offerings.
- The estimates at every level, by discussing them with key opinion leaders, including CXOs, directors, and operation managers, have been verified and cross-checked, and finally, with the domain experts at MarketsandMarkets.
- Various paid and unpaid sources of information, such as annual reports, press releases, white papers, and databases, have been studied.
Top-Down Approach
- The global market size of AI infrastructure was estimated through the data sanity of major companies.
- The growth of the AI infrastructure market witnessed an upward trend during the studied period, as it is currently in the initial stage of the product cycle, with major players beginning to expand their business into various application areas of the market.
- Types of AI infrastructure offerings, their features and properties, geographical presence, and key applications served by all players in the AI infrastructure market were studied to estimate and arrive at the percentage split of the segments.
- Different types of AI infrastructure offerings, such as compute, memory, and network, storage and server software and their penetration for end users were also studied.
- The market split for AI infrastructure by offering, function, deployment, application, and end user was estimated based on secondary research.
- The demand generated by companies operating in different end-use application segments was analyzed.
- Multiple discussions with key opinion leaders across major companies involved in developing the AI Infrastructure offerings and related components were conducted to validate the offering, function, deployment, application, and end user market split.
- The regional splits were estimated using secondary sources based on factors such as the number of players in a specific country and region and the adoption and use cases of each implementation type with respect to applications in the region.
Data Triangulation
After arriving at the overall size of the AI infrastructure market through the process explained above, the overall market has been split into several segments. Data triangulation procedures have been employed to complete the overall market engineering process and arrive at the exact statistics for all the segments, wherever applicable. The data has been triangulated by studying various factors and trends from both the demand and supply sides. The market has also been validated using both top-down and bottom-up approaches.
Market Definition
AI infrastructure refers to the foundational technological ecosystem required to develop, deploy, and scale artificial intelligence applications. It encompasses a combination of high-performance computing resources (e.g., GPUs, CPUs, FPGAs, etc.), memory solutions (e.g., DDR, HBM), networking components (e.g., network adapters, interconnects), software, and storage systems optimized for handling AI workloads. AI infrastructure supports both training and inference functions across diverse deployment models, including on-premises, cloud, and hybrid environments. It is utilized in generative AI, machine learning, natural language processing (NLP), and computer vision applications.
Key Stakeholders
- Government and financial institutions and investment communities
- Analysts and strategic business planners
- Semiconductor product designers and fabricators
- Application providers
- AI solution providers
- AI platform providers
- AI system providers
- Manufacturers and AI technology users
- Business providers
- Component and device suppliers and distributors
- Professional service/solution providers
- Research organizations
- Technology standard organizations, forums, alliances, and associations
- Technology investors
- Investors (private equity firms, venture capitalists, and others)
Report Objectives
- To define, describe, segment, and forecast the size of the AI infrastructure market, in terms of value, based on offering, function, deployment, application, end user, and region
- To forecast the size of the market segments for four major regions—North America, Europe, Asia Pacific, and RoW
- To define, describe, segment, and forecast the size of the AI infrastructure market, in terms of volume, based on offering.
- To give detailed information regarding drivers, restraints, opportunities, and challenges influencing the growth of the market
- To provide an value chain analysis, ecosystem analysis, case study analysis, patent analysis, Trade analysis, technology analysis, pricing analysis, key conferences and events, key stakeholders and buying criteria, Porter's five forces analysis, investment and funding scenario, and regulations pertaining to the market
- To provide a detailed overview of the value chain analysis of the AI infrastructure ecosystem
- To strategically analyze micromarkets1 with regard to individual growth trends, prospects, and contributions to the total market
- To analyze opportunities for stakeholders by identifying high-growth segments of the market
- To strategically profile the key players, comprehensively analyze their market positions in terms of ranking and core competencies2, and provide a competitive market landscape.
- To analyze strategic approaches such as product launches, acquisitions, agreements, and partnerships in the AI infrastructure market
Available Customizations
With the given market data, MarketsandMarkets offers customizations according to the company’s specific needs. The following customization options are available for the report:
Company Information:
- Detailed analysis and profiling of additional market players (up to 7)
Get the Full AI Infrastructure Market Report
Full forecast, segment splits, and company analysis for all AI Infrastructure Market.
- US AI Infrastructure Market
- Canada AI Infrastructure Market
- Mexico AI Infrastructure Market
- UK AI Infrastructure Market
- Germany AI Infrastructure Market
- France AI Infrastructure Market
- Spain AI Infrastructure Market
- Italy AI Infrastructure Market
- Rest Of Europe AI Infrastructure Market
- China AI Infrastructure Market
- Japan AI Infrastructure Market
- South Korea AI Infrastructure Market
- India AI Infrastructure Market
- Rest Of Asia Pacific AI Infrastructure Market
- GCC AI Infrastructure Market
- Rest Of Middle East AI Infrastructure Market
Need a Tailored Report?
Customize this report to your needs
Get 10% FREE Customization
Customize This Report
