
Asia Pacific Distribution Automation Market (2025-2030)

The Asia Pacific Distribution Automation Market was valued at $8840.4 Million in 2025 and projected to reach to $17216.7 Million by 2030, representing a compound annual growth rate of 14.3%. The Asia Pacific distribution automation market is positioned for exceptional growth through 2030, driven by accelerating urbanization, infrastructure modernization, and digital transformation initiatives across the region.


| Market Size in | USD 26.32 MN |
| Market Forecast in | |
| CAGR | |
| Forecast Period | |
| Units Considered | Value (USD MN) |
Asia Pacific Distribution Automation Market Trends and Insights
- Asia Pacific's rapid urbanization, aging grid infrastructure, and increasing demand for reliable electricity supply are driving significant investments in automation technologies across the region.
- The market in Asia Pacific is benefiting from government initiatives promoting smart grid deployment and renewable energy integration, particularly in countries like China, India, and Japan. Asia Pacific's distribution automation sector is characterized by rising electricity consumption and the need for operational efficiency in power distribution networks.
- Between 2025 and 2030, Asia Pacific is expected to witness accelerated adoption of advanced metering infrastructure, real-time monitoring systems, and IoT-enabled solutions.
- The region's competitive landscape reflects diverse regulatory environments and varying levels of technological maturity, with Asia Pacific emerging as a critical growth hub for global distribution automation vendors seeking to capitalize on infrastructure modernization trends..
Key Market Statistics
- CAGR (2025-2030) 14.3% CAGR
- Market Size, 2025 ~USD 8840.4 Million
- Forecast, 2030 ~USD 17216.7 Million
- Geography Asia Pacific
Asia Pacific Distribution Automation Market Overview
Rapid Market Expansion :
Asia Pacific distribution automation market is projected to nearly double from USD 8,840.4 million in 2025 to USD 17,216.7 million by 2030, representing a strong 14.3% CAGR, outpacing many global regions.
China's Market Dominance :
China leads the Asia Pacific region with a market size of USD 12,875.1 million, driven by massive grid modernization initiatives and smart city development across urban centers.
Urbanization & Infrastructure Demands :
Rapid urbanization across Asia Pacific is creating urgent need for grid modernization, reliability improvements, and automation technologies to support growing electricity demand in emerging economies.
Aging Grid Infrastructure :
Aging electrical grids across Japan, South Korea, and India require significant automation upgrades to enhance operational efficiency, reduce losses, and improve service reliability for growing populations.
Asia Pacific Distribution Automation Market Dynamics
- China's substantial market presence, combined with emerging opportunities in India and Southeast Asia, creates a dynamic landscape for automation technology adoption.
- Governments are increasingly prioritizing grid reliability and renewable energy integration, spurring investments in advanced distribution management systems and IoT-enabled solutions. Key growth catalysts include aging infrastructure replacement cycles, rising electricity consumption, and regulatory mandates for grid modernization.
- The region's focus on smart cities and sustainable energy solutions further accelerates demand for distribution automation technologies.
- Strategic partnerships between local utilities and technology providers are expanding market penetration, while competitive pricing and localized solutions enhance accessibility across diverse economic markets in Asia Pacific..
Market Ecosystem
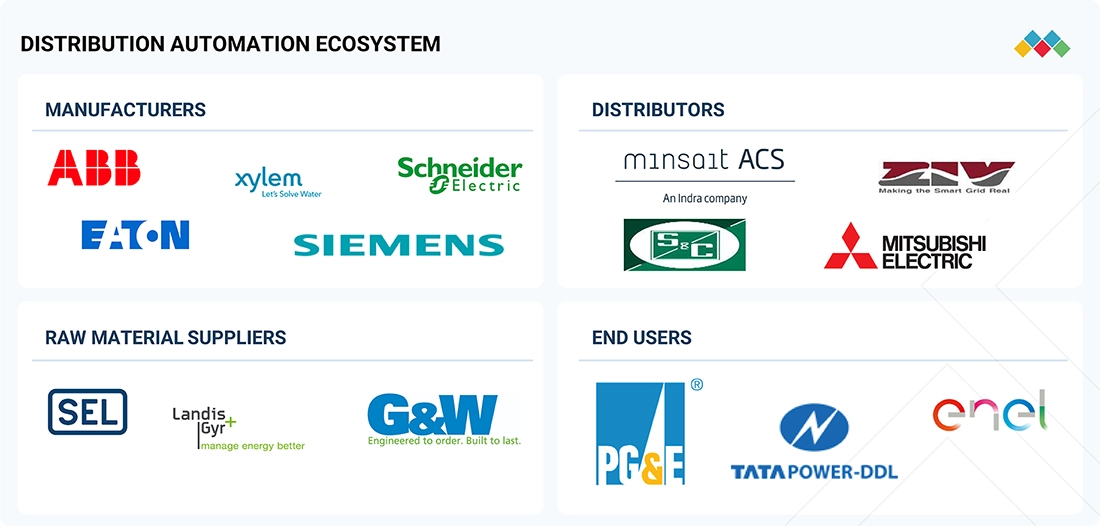
Distribution Automation Market: COMMERCIAL USE CASES ACROSS INDUSTRIES
| COMPANY | USE CASE DESCRIPTION | BENEFITS |
|---|---|---|
 |
TATA POWER Delhi Distribution Limited Adopts automated solutions to improve efficiency and reduce aggregate technical and commercial losses | TPDD implemented automation in its operations to improve efficiency and reduce losses. The company has established a separate training center, the Center for Power Efficiency in Distribution, which offers training to its employees and other power companies. TPDD has also established the Rithala captive power plant to serve as a backup in the event of breakdowns, particularly for essential services such as hospitals and streetlights. |
 |
US DOE grants Chattanooga Electric Power Board contract to deploy smart grid technologies for transformers | Itron’s distribution automation solutions leverage industrial IoT-enabled edge devices to communicate, coordinate, and control equipment across the distribution network in real-time, improving distribution system reliability by reducing outage duration and the number of customers affected. Intelligently connected devices, such as capacitor bank controllers, smart meters, line sensors, and reclosers that leverage peer-to-peer communication, can quickly pinpoint and isolate outages, protecting equipment and helping keep the lights on. |
Logos and trademarks shown above are the property of their respective owners. Their use here is for informational and illustrative purposes only.
Related Ecosystem
Power Infrastructure
- Geographical Information System (GIS)
- Cogeneration
- Battery Electric Vehicle (BEV)
- Cellular Network
- Fuel Cell
- Siemens ag
- ABB India Limited
- SCHNEIDER ELECTRIC SE
- General Electric Company
- Eaton Corporation plc
Smart Energy And Digital Solutions
- Cellular Network
- Analytics Software
- Geographical Information System (GIS)
- Meter Data Management (MDM)
- Smart Meters
- Siemens ag
- SCHNEIDER ELECTRIC SE
- ABB India Limited
- General Electric Company
- Eaton Corporation plc
Key Takeaways
- Asia Pacific's distribution automation market will nearly double from USD 8,840.4 million in 2025 to USD 17,216.7 million by 2030, representing a 14.3% CAGR.
- Smart grid initiatives and renewable energy integration policies across Asia Pacific are primary catalysts for market expansion and technology adoption.
- Asia Pacific's aging power distribution infrastructure creates substantial opportunities for modernization and automation investments through 2030.
- Diverse regulatory frameworks and varying technological maturity levels across Asia Pacific nations shape competitive dynamics and vendor strategies in the region.
Distribution Automation Market Report Scope
| Report Metric | Details |
|---|---|
| Base Year | 2025 |
| Fastest Growing Segment | PRIVATE UTILITIES (Utility) |
| Forecast Period | 2025–2030 |
| Growth Rate | CAGR of 14.5% from 2025 to 2030 |
| Largest Segment | FIELD DEVICES (Offering) |
| Market Size Base Year (Billions) | ~USD 20.53 (2025) |
| Revenue Forecast (Billions) | ~USD 40.4 (2030) |
| Segments Covered | Communication Technology, Type, Offering, Utility, Field Devices, Wired Communication Technology, Wireless Communication Technology |
Asia Pacific Distribution Automation Market Report Segmentation
7 segment dimensions are covered across the global market.
By Communication Technology
- Wired Communication Technology
- Wireless Communication Technology
By Type
- Automated Capacitors
- Automated Feeder Switches/Reclosers
- Automated Voltage Regulators
- Cellular Network
- Ethernet
- Feeder Monitors
- Fiber Optic
- Ip
- Powerline Carrier
- Radio Frequency Mesh
- Remote Fault Indicators
- Remote Terminal Units
- Smart Relays
- Transformer Monitors
- Wimax
By Offering
- Field Devices
- Services
- Software
By Utility
- Private Utilities
- Public Utilities
By Field Devices
- Automated Capacitors
- Automated Feeder Switches/Reclosers
- Automated Voltage Regulators
- Feeder Monitors
- Remote Fault Indicators
- Remote Terminal Units
- Smart Relays
- Transformer Monitors
By Wired Communication Technology
- Ethernet
- Fiber Optic
- Fiber Optics
- Ip
- Powerline Carrier
By Wireless Communication Technology
- Cellular Network
- Radio Frequency Mesh
- Wimax
Target Audience
- Utility Companies & Grid Operators : Asia Pacific utilities need detailed market insights to plan grid modernization investments, evaluate automation technology solutions, and benchmark competitive offerings in their regional markets.
- Technology & Equipment Manufacturers : Distribution automation equipment providers require Asia Pacific-specific data to identify growth opportunities, assess market demand, and develop localized product strategies for diverse regional markets.
- Investment & Private Equity Firms : Investors evaluating opportunities in Asia Pacific energy infrastructure need comprehensive market analysis to assess growth potential, identify acquisition targets, and make informed capital allocation decisions.
- Consulting & Systems Integrators : System integrators and consultants serving Asia Pacific utilities require regional market intelligence to advise clients on technology adoption, competitive positioning, and digital transformation roadmaps.
- Government & Regulatory Bodies : Policy makers and regulatory agencies across Asia Pacific need market data to inform grid modernization policies, renewable energy integration strategies, and infrastructure investment priorities.
Key Companies in the Asia Pacific Distribution Automation Market
| Company | HQ | Ownership | Strongest segments |
|---|---|---|---|
| MAXWELL TECHNOLOGIES, INC. | United States | Private Company | Field Devices – High-Voltage Capacitors and Instrument Transformers,Field Devices – Ultracapacitor Modules for Grid and Industrial,Services and Engineering Support, |
| EMERSON ELECTRIC CO. | United States | Public Company | Field Devices,Software,Services, |
| EMERA INCORPORATED | Canada | Public Company | Field Devices,Software,Services, |
| BOREALIS AG | United States | Private Company | Field Devices – Cable, Conduit, and Enclosure Materials,Communication Technology – Wired Infrastructure Materials,Services and Technical Support to Utilities and OEMs, |
| ENGIE | France | Public Company | Field Devices,Software,Services, |
| ADANI GREEN ENERGY | India | Public Company | Field Devices,Software,Services, |
| ABB | India | Public Company | Field Devices,Software,Services, |
| SIEMENS | Germany | Public Company | Field Devices,Software,Services, |
| SCHNEIDER ELECTRIC | Canada | Public Company | Field Devices,Software,Services, |
| EATON | Ireland | Public Company | Field Devices,Software,Services, |
| GE VERNOVA | United States | Public Company | Field Devices,Software,Services, |
| XYLEM | United States | Public Company | Field Devices,Software,Services, |
| TOSHIBA CORPORATION | Japan | Private Company | Field Devices,Software,Services, |
| ITRON INC. | United States | Public Company | Field Devices,Software,Services, |
| HUBBELL | United States | Public Company | Field Devices,Software,Services, |
MAXWELL TECHNOLOGIES, INC.
Maxwell Technologies, Inc. is a private company founded in 1965 in the United States with 368 employees.
EMERSON ELECTRIC CO.
Emerson Electric Co. is a public company founded in 1890 in the United States with 71,000 employees.
EMERA INCORPORATED
Emera Incorporated is a public company founded in 1998 in Canada with 7,812 employees.
BOREALIS AG
Borealis AG is a private company founded in 1994 in the United States with 5,887 employees.
ENGIE
ENGIE is a public company founded in 1880 in France with 84,809 employees.
ADANI GREEN ENERGY
Adani Green Energy is a public company founded in 2015 in India with 976 employees.
ABB
ABB is a public company founded in 1883 in India with 111,900 employees.
SIEMENS
Siemens is a public company founded in 1847 in Germany with 310,312 employees.
SCHNEIDER ELECTRIC
Schneider Electric is a public company founded in 1836 in Canada with 158,122 employees.
EATON
Eaton is a public company founded in 1911 in Ireland with 97,303 employees.
GE VERNOVA
GE Vernova is a public company founded in 2023 in the United States with 78,000 employees.
XYLEM
Xylem is a public company founded in 2011 in the United States with 22,000 employees.
TOSHIBA CORPORATION
Toshiba Corporation is a private company founded in 1875 in Japan with 106,648 employees.
ITRON INC.
Itron Inc. is a public company founded in 1977 in the United States with 4,987 employees.
HUBBELL
Hubbell is a public company founded in 1888 in the United States with 18,200 employees.
Countries within Asia Pacific - compare and drill down
| Country | 2025 size (native) |
|---|---|
| China | USD 12875.1 Million |
| Japan | USD 1490.9 Million |
| India | USD 507.6 Million |
| Australia | USD 574.8 Million |
| South Korea | USD 1346.7 Million |
Country market size visualization
Reasons to Buy this Report
- Regional Market Sizing & Forecasts : Obtain precise market valuations for Asia Pacific and individual country-level data, enabling accurate investment planning and resource allocation decisions specific to this high-growth region.
- Competitive Landscape Intelligence : Understand key players, market share dynamics, and competitive strategies tailored to Asia Pacific's unique regulatory environment and customer preferences.
- Growth Driver Analysis : Identify region-specific growth catalysts including urbanization trends, infrastructure aging cycles, renewable energy integration, and government modernization initiatives driving market expansion.
- Country-Level Opportunity Assessment : Evaluate market potential across China, Japan, India, South Korea, and Australia to prioritize market entry strategies and identify high-potential segments within Asia Pacific.
- Technology & Solution Trends : Discover emerging automation technologies, IoT integration patterns, and digital transformation trends specific to Asia Pacific utilities and grid operators.
Frequently asked questions
What is the current market size of distribution automation in Asia Pacific?
The Asia Pacific distribution automation market is valued at USD 8,840.4 million in 2025 and is projected to reach USD 17,216.7 million by 2030.
What is the expected growth rate for distribution automation in Asia Pacific?
Asia Pacific's distribution automation market is expected to grow at a compound annual growth rate (CAGR) of 14.3% from 2025 to 2030.
Which countries are driving growth in Asia Pacific's distribution automation market?
Key markets in Asia Pacific include China, India, and Japan, where government smart grid initiatives and renewable energy policies are accelerating distribution automation adoption.
What technologies are most in demand in Asia Pacific's distribution automation sector?
Advanced metering infrastructure (AMI), real-time monitoring systems, IoT-enabled solutions, and smart grid technologies are experiencing strong demand across Asia Pacific.
What factors are limiting distribution automation adoption in Asia Pacific?
Challenges in Asia Pacific include varying regulatory frameworks, infrastructure investment constraints in developing nations, and differing levels of technological maturity across the region.
RESEARCH METHODOLOGY
This study involved major activities in estimating the current size of the distribution automation market. Comprehensive secondary research was done to collect information on the market, peer market, and parent market. The next step involved the validation of these findings, assumptions, and market sizing with industry experts across the value chain through primary research. The total market size was estimated through country-wise analysis. Then, the market breakdown and data triangulation were performed to estimate the market size of the segments and sub-segments.
Secondary Research
The secondary research involved the extensive use of secondary sources, directories, and databases, such as Hoover’s, Bloomberg BusinessWeek, Factiva, IEA, and OneSource, to identify and collect information useful for a technical, market-oriented, and commercial study of the global distribution automation market. The other secondary sources comprised press releases & investor presentations of companies, white papers, certified publications, articles by recognized authors, manufacturers, associations, trade directories, and databases.
Primary Research
The distribution automation market comprises several stakeholders, such as project developers, exchanges, traders/brokers, auction platforms, and end users/carbon emitters in the supply chain. The demand side of this market is characterized by end users. Moreover, the market growth is also fueled by the growing demand for industrial and utility services. The supply side is characterized by an increase in the number of contracts in the industrial sector and acquisitions among big players. Various primary sources from both the supply and demand sides of the market were interviewed to obtain qualitative and quantitative information. The breakdown of primary respondents is given below:
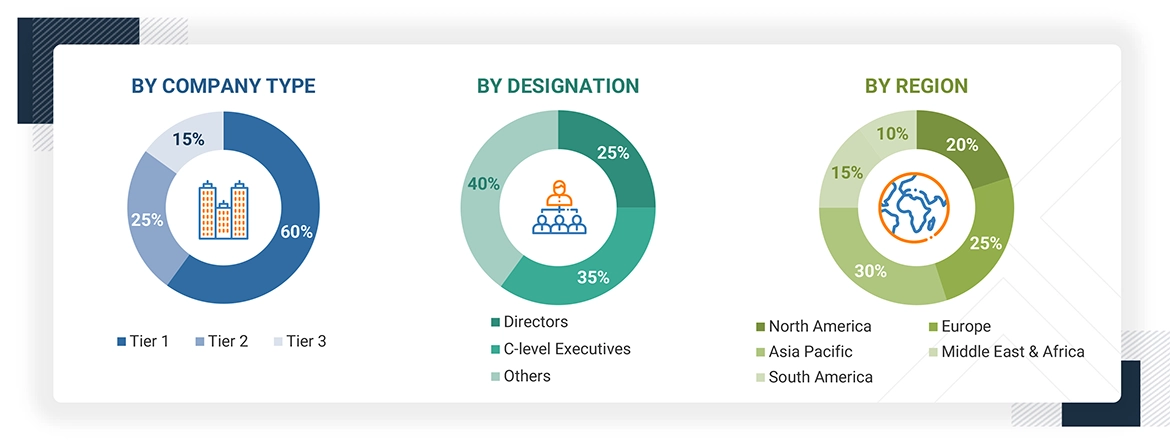
Note 1: Others include sales managers, marketing managers, and product managers.
Note 2: Tier 1 companies’ revenues are more than USD 10 billion; tier 2 companies’ revenues range between USD 1 and 10 billion; and tier 3 companies’ revenues range between USD 500 million and USD 1 billion.
Source: Industry Experts
To know about the assumptions considered for the study, download the pdf brochure
Market Size Estimation
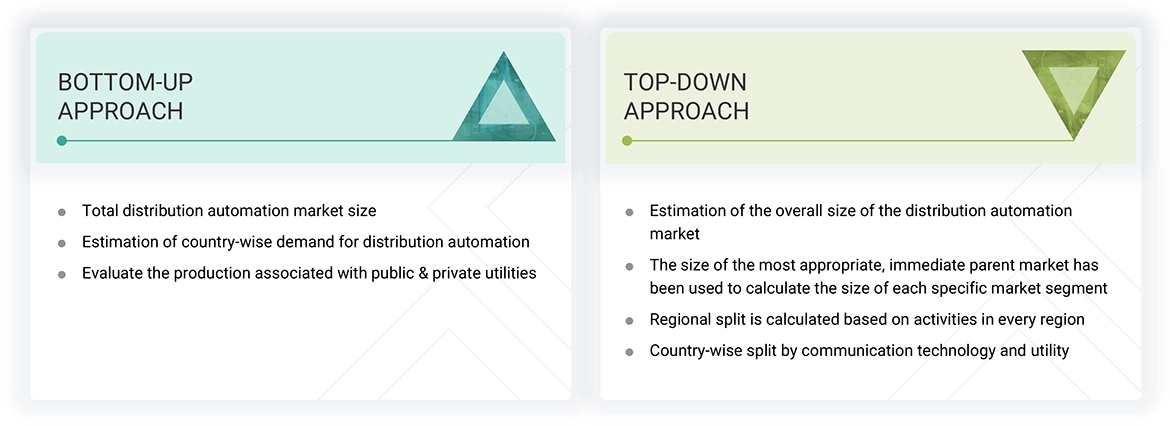
Both top-down and bottom-up approaches were used to estimate and validate the total size of the distribution automation market. These methods were also extensively used to estimate the size of various subsegments in the market. The research methodology used to estimate the market size includes the following:
- The key players in the industry and market have been identified through extensive secondary research, and their market share has been determined through primary and secondary research.
- The industry’s value chain and market size, in terms of value, have been determined through both primary and secondary research processes.
- All percentage shares, splits, and breakdowns have been determined using secondary sources and verified through primary sources.
Distribution Automation Market : Top-Down and Bottom-Up Approach
Data Triangulation
After arriving at the overall market size from the estimation process explained above, the total market has been split into several segments and subsegments. Data triangulation and market breakdown processes have been employed to complete the overall market engineering process and arrive at the exact statistics for all the segments and sub-segments, wherever applicable. The data has been triangulated by studying various factors and trends from both the demand and supply sides. Along with this, the market has been validated using both the top-down and bottom-up approaches.
Market Definition
Distribution automation is a key component of modern grid infrastructure as it enables the real-time monitoring and control of distribution assets to maximize grid efficiency and reliability. It uses digital sensors and switches with advanced control and communication technologies to automate feeder switching, voltage monitoring and control, outage management, reactive power management, preventative equipment maintenance for critical substation equipment, and grid integration of distributed energy resources. This helps utilities in collecting and analyzing data to improve the operational efficiency of power distribution systems.
The distribution automation market refers to the year-on-year investments in distribution automation across the five main regions, namely, North America, South America, Europe, Asia Pacific, and the Middle East & Africa.
Stakeholders
- Field device manufacturers
- Public and private electric utilities
- Distribution companies (DISCOMS)
- Energy & power sector consulting companies
- Government & research organizations
- Independent power producers
- Investment banks
- Electrical equipment associations
- Network and communication service providers
- Support and maintenance service providers
- Smart grid players
Report Objectives
- To describe and forecast the distribution automation market based on offering, communication technology, utility, and region in terms of value
- To describe and forecast the market for five key regions: Asia Pacific, North America, Europe, South America, and the Middle East & Africa, along with their country-level market sizes in terms of value
- To forecast the distribution automation market by offering and region, in terms of volume
- To provide detailed information regarding key drivers, restraints, opportunities, and challenges influencing the growth of the market
- To strategically analyze the micromarkets1 with respect to individual growth trends, prospects, and contributions to the overall market size
- To provide the supply chain analysis, trends/disruptions impacting customers’ businesses, market map, ecosystem analysis, tariffs and regulations, pricing analysis, patent analysis, case study analysis, impact of 2025 US tariff, impact of generative AI & AI on distribution automation market, global macroeconomic outlook, technology analysis, key conferences and events, trade analysis, Porter’s Five Forces analysis, key stakeholders and buying criteria, and regulatory analysis of the distribution automation market
- To analyze opportunities for stakeholders and draw a competitive landscape of the distribution automation market
- To benchmark market players using the company evaluation matrix, which analyzes market players on broad categories of business and product strategies adopted by them
- To compare key market players with respect to product specifications and applications
- To strategically profile key players and comprehensively analyze their market rankings and core competencies
- To analyze competitive developments, such as contracts & agreements, investments & expansions, mergers & acquisitions, product launches, partnerships, and joint ventures & collaborations, in the distribution automation market
Available Customizations
With the given market data, MarketsandMarkets offers customizations based on the company’s specific needs. The following customization options are available for the report:
Product Analysis
- Product Matrix, which provides a detailed comparison of the product portfolio of each company
Geographic Analysis as per Feasibility
- Further breakdown of the distribution automation market, by country
Company Information
- Detailed analyses and profiling of additional market players
Get the Full Distribution Automation Market Report
Full forecast, segment splits, and company analysis for all Distribution Automation Market.
- US Distribution Automation Market
- Canada Distribution Automation Market
- Mexico Distribution Automation Market
- Germany Distribution Automation Market
- France Distribution Automation Market
- Italy Distribution Automation Market
- UK Distribution Automation Market
- China Distribution Automation Market
- Japan Distribution Automation Market
- India Distribution Automation Market
- Australia Distribution Automation Market
- South Korea Distribution Automation Market
- Brazil Distribution Automation Market
- Argentina Distribution Automation Market
- UAE Distribution Automation Market
- Iran Distribution Automation Market
- South Africa Distribution Automation Market
- GCC Countries Distribution Automation Market
- Rest Of South America Distribution Automation Market
- Rest Of GCC Distribution Automation Market
- Saudia Arabia Distribution Automation Market
Need a Tailored Report?
Customize this report to your needs
Get 10% FREE Customization
Customize This Report
