
Australia And New Zealand Edtech and Smart Classrooms Market (2025-2030)

The Australia And New Zealand Edtech and Smart Classrooms Market was valued at $2144.4 Million in 2025 and projected to reach to $3748.6 Million by 2030, representing a compound annual growth rate of 11.8%. Australia and New Zealand's edtech and smart classrooms market is experiencing accelerated growth driven by government digital education initiatives, increased adoption of hybrid learning models, and substantial investment in educational infrastructure modernization.


| Market Size in | USD 26.32 MN |
| Market Forecast in | |
| CAGR | |
| Forecast Period | |
| Units Considered | Value (USD MN) |
Australia And New Zealand Edtech and Smart Classrooms Market Trends and Insights
- This growth trajectory reflects Latin America's increasing investment in digital learning infrastructure and technology-enabled education solutions across primary, secondary, and higher education institutions.
- Latin America is witnessing accelerating adoption of cloud-based learning platforms, interactive digital content, and AI-powered educational tools as governments and private institutions prioritize modernization of classroom environments. The 11.8% compound annual growth rate underscores Latin America's commitment to bridging the digital divide and enhancing educational accessibility in underserved regions.
- Latin America's market is driven by rising smartphone penetration, improved internet connectivity, and policy initiatives supporting digital transformation in education.
- Between 2025 and 2030, Latin America is expected to see significant deployment of smart classroom technologies, learning management systems, and virtual collaboration tools that cater to the region's diverse educational landscape and demographic needs..
Key Market Statistics
- CAGR (2025-2030) 11.8% CAGR
- Market Size, 2025 ~USD 2144.4 Million
- Forecast, 2030 ~USD 3748.6 Million
- Country Australia And New Zealand
Australia And New Zealand Edtech and Smart Classrooms Market Overview
Market Valuation :
Australia and New Zealand's edtech and smart classrooms market is valued at USD 2,144.4 million in 2025, demonstrating strong regional adoption of digital learning technologies across both countries.
Projected Growth :
The market is forecast to reach USD 3,748.6 million by 2030, representing a robust 11.8% CAGR, outpacing many developed markets in technology integration within educational institutions.
Digital Infrastructure Investment :
Both Australia and New Zealand are investing significantly in smart classroom infrastructure, learning management systems, and interactive educational platforms across primary, secondary, and tertiary education sectors.
Regional Leadership :
The ANZ region is positioning itself as a leader in edtech innovation, with strong government support for digital literacy initiatives and increasing private sector participation in educational technology solutions.
Australia And New Zealand Edtech and Smart Classrooms Market Dynamics
- Both nations are prioritizing technology-enabled learning to enhance student outcomes and prepare workforces for digital economies. The market outlook remains positive through 2030, supported by rising demand for personalized learning solutions, cloud-based educational platforms, and interactive classroom technologies.
- Increasing collaboration between educational institutions and edtech providers, combined with growing awareness of digital skill requirements, will continue to fuel market expansion across the region..
Market Ecosystem
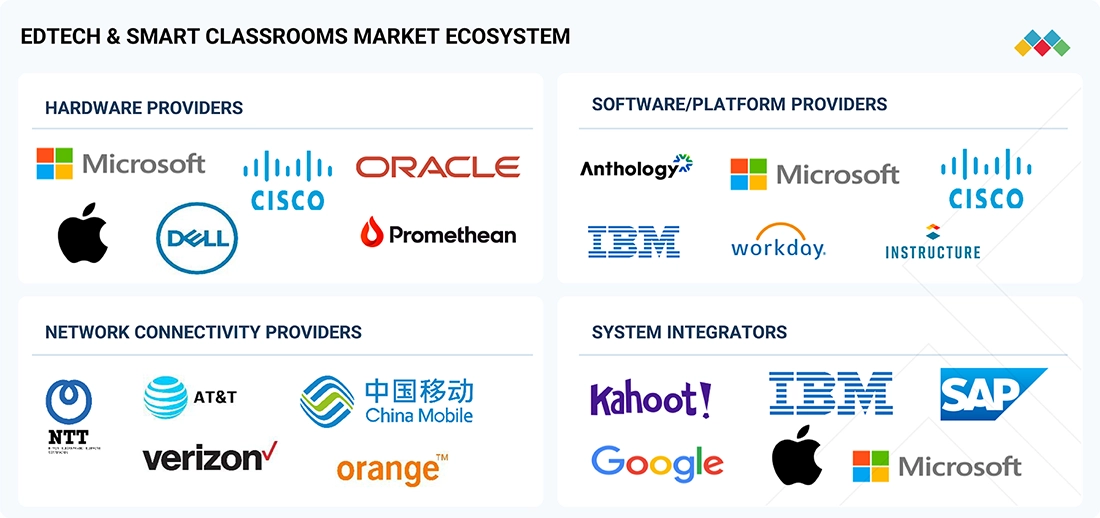
Edtech and Smart Classrooms Market: COMMERCIAL USE CASES ACROSS INDUSTRIES
| COMPANY | USE CASE DESCRIPTION | BENEFITS |
|---|---|---|
 |
You Employed, Inc. implemented Canvas LMS to transition in-person workforce training to a scalable online format across 17 countries, ensuring multilingual support and localized curriculum delivery. | Seamless transition to remote learning; improved localization and regional alignment; unified global curriculum; enhanced learner experience; strengthened platform adoption. |
 |
Agora Cyber Charter School integrated Mystery Science with LMS tools to align the virtual science curriculum with Pennsylvania STEELS standards, encouraging interactive, inquiry-based learning from grades K–5. | Improved engagement and comprehension; shift to student-led learning; reduced instructional complexity; fostered collaboration and critical thinking; established a scalable science framework. |
 |
Saanich School District deployed D2L Brightspace Core and Guardian modules to digitize student progress reporting, automate data uploads, and enhance real-time communication between parents and educators. | Secure digital reporting eliminating paper inefficiencies; increased parent engagement; improved visibility into academic performance; reduced administrative workload; supported sustainability. |
Logos and trademarks shown above are the property of their respective owners. Their use here is for informational and illustrative purposes only.
Related Ecosystem
Software And Services
- Natural Language Processing (NLP)
- Machine Learning
- Supply Chain Management
- Predictive Analytics
- Image Sensors
- International Business Machines Corporation
- MICROSOFT CORPORATION
- Oracle Corporation
- SAP SE
- Amazon.com, Inc.
Key Takeaways
- Latin America's edtech market will grow from $2,144.4M (2025) to $3,748.6M (2030), representing a 74.8% increase over five years.
- Latin America is experiencing an 11.8% CAGR, driven by government digitalization initiatives and rising demand for hybrid and remote learning solutions.
- Latin America's market expansion is fueled by increasing smartphone adoption, improved broadband infrastructure, and private sector investment in educational technology.
- Latin America's smart classroom deployments are accelerating as institutions seek to enhance student engagement, accessibility, and learning outcomes through digital tools.
Edtech and Smart Classrooms Market Report Scope
| Report Metric | Details |
|---|---|
| Base Year | 2025 |
| Fastest Growing Segment | HYBRID (Cloud Type) |
| Forecast Period | 2025–2030 |
| Growth Rate | CAGR of 12.3% from 2025 to 2030 |
| Largest Segment | CLOUD (Deployment Type) |
| Market Size Base Year (Billions) | ~USD 197.7 (2025) |
| Revenue Forecast (Billions) | ~USD 353.1 (2030) |
| Segments Covered | Solution, End User, Deployment Type, Cloud Type |
Australia And New Zealand Edtech and Smart Classrooms Market Report Segmentation
4 segment dimensions are covered across the global market.
By Solution
- Adaptive & Personalized Learning
- Assessment & Grading Tools
- Augmented Reality (Ar), Virtual Reality (Vr), And Simulations
- Classroom Interaction & Collaboration Tools
- Learning Content & Curriculum Management
- Other Solutions
- Projection & Display Systems
- Special Education & Accessibility Tools
- Student Information Systems (Sis) & School Erp
- Student Monitoring & Attendance Management
By End User
- Higher Education
- K–12
- Vocational Training Centers
By Deployment Type
- Cloud
- On-Premises
By Cloud Type
- Hybrid
- Private
- Public
Target Audience
- EdTech Solution Providers : Edtech companies need ANZ-specific market data to develop localized product strategies, identify partnership opportunities with educational institutions, and optimize market entry and expansion plans.
- Educational Institution Leaders : School administrators, university executives, and education boards require market insights to benchmark technology investments, evaluate vendor solutions, and align digital transformation initiatives with regional trends.
- Investment and Venture Capital Firms : Investors targeting the ANZ edtech sector need detailed market sizing and growth forecasts to identify promising startups, assess portfolio company performance, and make informed funding decisions.
- Government and Policy Makers : Education ministries and government agencies in Australia and New Zealand use market data to develop digital education policies, allocate funding, and evaluate the effectiveness of technology integration initiatives.
- Technology Infrastructure Providers : Hardware manufacturers, cloud service providers, and IT infrastructure companies need ANZ market intelligence to forecast demand, develop region-specific solutions, and plan distribution strategies.
Key Companies in the Australia And New Zealand Edtech and Smart Classrooms Market
| Company | HQ | Ownership | Strongest segments |
|---|---|---|---|
| GODREJ GROUP | India | Private Company | Home Appliances,Commercial Appliances & Cooling Solutions,Locks, Architectural Hardware & Security Products, |
| ZENSAR TECHNOLOGIES LTD | India | Public Company | Digital and Application Services – Experience & Product Engineering,Digital and Application Services – Data, Analytics & Gen AI,Core Application Services (SAP, Oracle, Salesforce, AMS, QE), |
| MICROSOFT | United States | Public Company | Productivity and Business Processes,Intelligent Cloud,Personal Computing, |
| United States | Public Company | Search & Other Ads,YouTube Ads & Subscriptions,Google Cloud (incl. AI & Workspace), | |
| PEARSON | United Kingdom | Public Company | Assessment & Qualifications,Higher Education,Virtual Learning, |
| INSTRUCTURE | United States | Private Company | Canvas LMS core subscriptions,Assessment and analytics solutions,Digital credentialing and student pathways, |
| CISCO | United States | Public Company | Enterprise networking (campus, branch, wireless, routing),Data center switching and webscale products,Security (network, SASE, identity, threat detection/response), |
| IBM | United States | Public Company | Software (Hybrid Cloud and AI Platforms),Consulting (Strategy, Technology, Managed Services),Infrastructure (Servers, Storage, Lifecycle Services), |
| MCGRAW HILL | United States | Public Company | K-12 (core, supplemental, intervention),Higher Education (courseware and materials),Global Professional (medical and engineering), |
| ORACLE | United States | Public Company | Cloud Applications (Fusion ERP/EPM/SCM/HCM, NetSuite, Oracle Health, CX),Cloud Infrastructure & Autonomous Database,On-Premise Licenses & License Support (Database, Middleware, Java), |
| POWERSCHOOL | United States | Private Company | Student Information & Enrollment Management,Learning Management & Classroom Solutions,Assessment & Analytics, |
| 2U INC | United States | Private Company | Degree Program,Alternative Credential, |
| KAHOOT! | Norway | Private Company | Kahoot! Learning Platform (core quizzes and EDU/corporate subscriptions),Employee engagement and learning (Actimo, Motimate, Kahoot! 360 Spirit),Consumer learning apps (Drops, DragonBox, Poio Read), |
| SMART TECHNOLOGIES | Canada | Private Company | Interactive displays (SMART Board and panels),Collaboration and education software,Services, training, and implementation, |
GODREJ GROUP
Godrej Group is a private Indian conglomerate founded in 1897 with 13,316 employees. The company operates across multiple business sectors in India.
ZENSAR TECHNOLOGIES LTD
Zensar Technologies Ltd is a public Indian technology company founded in 1963 with 10,066 employees. The company provides IT services and solutions.
MICROSOFT
Microsoft is a public American technology company founded in 1975 with 228,000 employees. The company develops software, cloud services, and hardware products globally.
Google is a public American technology company founded in 1998 with 194,668 employees. The company operates search engines, advertising platforms, and cloud services worldwide.
PEARSON
Pearson is a public British education and publishing company founded in 1844 with 15,165 employees. The company provides educational content, assessments, and learning solutions globally.
INSTRUCTURE
Instructure is a private American education technology company founded in 2008 with 1,496 employees. The company provides learning management and educational software platforms.
CISCO
Cisco is a public American technology company founded in 1984 with 86,200 employees. The company designs and sells networking equipment and IT infrastructure solutions.
IBM
IBM is a public American technology company founded in 1911 with 264,300 employees. The company provides IT services, cloud computing, and enterprise software solutions globally.
MCGRAW HILL
McGraw Hill is a public American education and publishing company founded in 1888 with 4,400 employees. The company develops educational content and learning solutions.
ORACLE
Oracle is a public American software company founded in 1977 with 141,000 employees. The company develops database software, cloud services, and enterprise applications.
POWERSCHOOL
PowerSchool is a private American education technology company founded in 1997 with 3,563 employees. The company provides cloud-based school management and student information systems.
2U INC
2U Inc is a private American education technology company founded in 2008 with 4,265 employees. The company offers online learning platforms and digital education solutions.
KAHOOT!
Kahoot! is a private Norwegian education technology company founded in 2011 with 463 employees. The company develops game-based learning platforms and educational engagement tools.
SMART TECHNOLOGIES
Smart Technologies is a private Canadian technology company founded in 1987 with 908 employees. The company develops interactive display and collaboration solutions for education and enterprise markets.
Reasons to Buy this Report
- Market-Specific Sizing Data : Access precise valuation figures for Australia and New Zealand's edtech market with detailed 2025-2030 forecasts, enabling accurate budget allocation and investment planning specific to the ANZ region.
- Regional Growth Trajectory Analysis : Understand the 11.8% CAGR specific to Australia and New Zealand, identifying growth drivers unique to both countries and competitive positioning within the broader Asia-Pacific edtech landscape.
- Segment and Institution Insights : Gain detailed breakdowns of market opportunities across primary, secondary, and higher education institutions in Australia and New Zealand, with segment-specific growth projections and adoption trends.
- Competitive Landscape Intelligence : Identify key edtech providers, emerging startups, and strategic partnerships operating in Australia and New Zealand, with market share analysis and competitive positioning strategies.
- Strategic Investment Guidance : Leverage ANZ-specific market intelligence to identify high-growth opportunities, emerging technologies, and optimal entry strategies for expanding edtech operations in Australia and New Zealand.
Frequently asked questions
What is the current size of Latin America's edtech market?
Latin America's edtech and smart classrooms market is valued at $2,144.4 million in 2025 and is projected to grow to $3,748.6 million by 2030.
What is the growth rate for edtech in Latin America?
Latin America's edtech market is growing at an 11.8% compound annual growth rate (CAGR) between 2025 and 2030.
What are the main drivers of edtech adoption in Latin America?
Key drivers include government digital transformation policies, rising internet and smartphone penetration, demand for hybrid learning solutions, and institutional investment in smart classroom infrastructure.
Which technologies are most in demand in Latin America's smart classrooms?
Latin America is seeing strong demand for learning management systems, cloud-based collaboration platforms, interactive digital content, AI-powered tutoring tools, and video conferencing solutions.
How does Latin America's edtech growth compare to global trends?
Latin America's 11.8% CAGR is slightly below the global average of 12.3%, reflecting regional variations in infrastructure maturity and investment capacity.
RESEARCH METHODOLOGY
This research study involved the extensive use of secondary sources, directories, and databases, such as Dun & Bradstreet (D&B) Hoovers and Bloomberg BusinessWeek, to identify and collect information useful for a technical, market-oriented, and commercial study of the edtech and smart classrooms market. The primary sources have been mainly industry experts from the core and related industries and preferred suppliers, manufacturers, distributors, service providers, technology developers, alliances, and organizations related to all segments of the value chain of this market. In-depth interviews have been conducted with various primary respondents, including key industry participants, subject matter experts, C-level executives of key market players, and industry consultants, to obtain and verify critical qualitative and quantitative information.
Secondary Research
The market size of companies offering edtech and smart classrooms worldwide was arrived at based on secondary data available through paid and unpaid sources. It was also arrived at by analyzing the product portfolio of major companies and rating them based on their performance and quality. In the secondary research process, various secondary sources were referred to identify and collect information for the study. The secondary sources included annual reports, press releases, and investor presentations of companies; white papers, journals, and certified publications; and articles from recognized authors, directories, and databases.
Secondary research was mainly used to obtain key information about the industry’s value chain and supply chain and to identify key players through various solutions and services, market classification and segmentation according to offerings of major players, industry trends related to technologies, applications, and regions, and key developments from both market-oriented and technology-oriented perspectives.
Primary Research
In the primary research process, various primary sources from the supply and demand sides were interviewed to obtain qualitative and quantitative information on the market. The primary sources from the supply side included various industry experts, including Chief Experience Officers (CXOs), Vice Presidents (VPs), directors from business development, marketing, and product development/innovation teams, related key executives from edtech and smart classrooms solution vendors, professional service providers, industry associations, and key opinion leaders.
Primary interviews were conducted to gather insights, such as market statistics, revenue data collected from solutions and services, market breakups, market size estimations, market forecasts, and data triangulation. Primary research also helped in understanding various trends related to technologies, applications, deployments, and regions. Stakeholders from the demand side, such as Chief Information Officers (CIOs), Chief Technology Officers (CTOs), Chief Strategy Officers (CSOs), and end users using edtech and smart classrooms solutions, were interviewed to understand the buyer’s perspective on suppliers, products, service providers, and their current usage of edtech and smart classrooms solutions, which would impact the overall edtech and smart classrooms market.
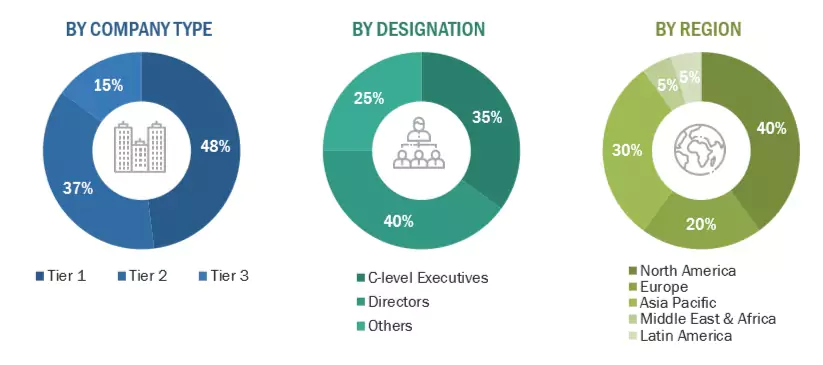
*Others include sales managers, marketing managers, and product managers.
Note: Tier 1 companies’ revenue is more than USD 1 billion; Tier 2 companies’ revenue ranges between USD 500 million and USD
1 billion; and Tier 3 companies’ revenue ranges between USD 100 million and USD 500 million
To know about the assumptions considered for the study, download the pdf brochure
Market Size Estimation
Multiple approaches were adopted to estimate and forecast the size of the edtech and smart classrooms market. The first approach involves estimating market size by summing up the revenue generated by companies through the sale of edtech and smart classrooms solutions.
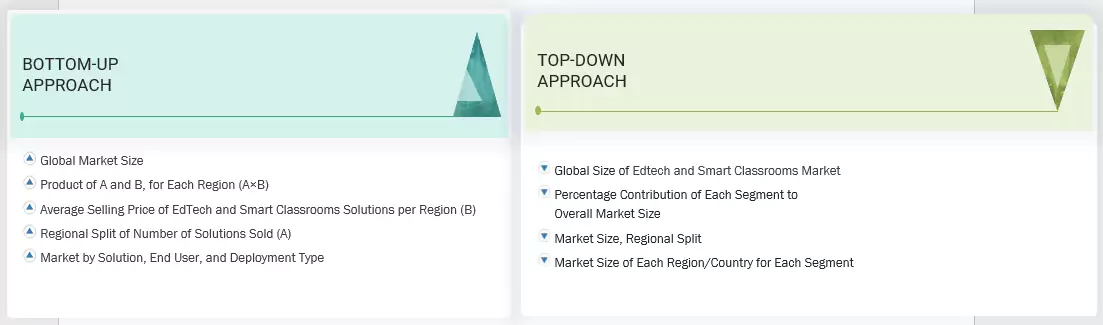
Top-down and bottom-up approaches were used to estimate and validate the total size of the edtech and smart classrooms market. These methods were also extensively used to estimate the size of various market segments. The research methodology used to evaluate the market size is listed below.
- Key players in the market have been identified through extensive secondary research.
- In terms of value, the industry’s supply chain and market size have been determined through primary and secondary research processes.
- All shares, splits, and breakups have been determined using secondary sources and verified through primary sources.
Edtech and Smart Classrooms Market : Top-Down and Bottom-Up Approach
Data Triangulation
After determining the overall market size, the edtech and smart classrooms market was divided into several segments and subsegments. A data triangulation procedure was used to complete the overall market engineering process and arrive at the exact statistics for all segments and subsegments, wherever applicable. The data was triangulated by studying various factors and trends from the demand and supply sides. Along with data triangulation and market breakdown, the market size was validated by the top-down and bottom-up approaches.
Market Definition
Edtech, or educational technology, refers to the use of digital tools, software, and hardware to facilitate learning and improve educational outcomes. It encompasses a wide range of solutions, from simple learning apps and online course platforms to complex systems for institutional management and data analytics. A smart classroom is a specific implementation of edtech within a physical learning space. It is an environment where technology is integrated seamlessly to enhance teaching and collaboration. This typically includes the use of interactive whiteboards, high-speed internet, connected devices, and specialized software to create a more engaging, interactive, and efficient learning experience for both students and instructors.
Stakeholders
- System Integrators
- EdTech and Smart Classrooms Hardware and Solution Vendors
- Resellers and Distributors
- Universities and Schools
- Teachers/Professors
- School Board Members
- Research Organizations
- Enterprise Users
- Technology Providers
- Venture Capitalists, Private Equity Firms, and Startup Companies
Report Objectives
- To determine and forecast the global edtech and smart classrooms market by solution, end user, deployment type, and region
- To forecast the size of the market segments for North America, Europe, Asia Pacific, Latin America, and the Middle East & Africa
- To provide detailed information about the major factors (drivers, restraints, opportunities, and challenges) influencing the growth of the edtech and smart classrooms market
- To analyze each submarket concerning individual growth trends, prospects, and contributions to the overall edtech and smart classrooms market
- To analyze the opportunities in the market for stakeholders by identifying the high-growth segments of the edtech and smart classrooms market
- To profile the key market players; provide a comparative analysis based on business overviews, regional presence, product offerings, business strategies, and key financials; and illustrate the market’s competitive landscape
- Track and analyze the competitive developments in the market, such as mergers and acquisitions, product developments, partnerships and collaborations, and research and development (R&D) activities.
Available Customizations
With the given market data, MarketsandMarkets offers customizations to meet the company’s specific needs. The following customization options are available for the report:
Geographic Analysis as per Feasibility
- Analysis for additional countries (up to five)
Company Information
- Detailed analysis and profiling of additional market players (up to 5)
Get the Full Edtech and Smart Classrooms Market Report
Full forecast, segment splits, and company analysis for all Edtech and Smart Classrooms Market.
- US Edtech and Smart Classrooms Market
- Canada Edtech and Smart Classrooms Market
- UK Edtech and Smart Classrooms Market
- Germany Edtech and Smart Classrooms Market
- France Edtech and Smart Classrooms Market
- Italy Edtech and Smart Classrooms Market
- China Edtech and Smart Classrooms Market
- India Edtech and Smart Classrooms Market
- Japan Edtech and Smart Classrooms Market
- South Korea Edtech and Smart Classrooms Market
- Brazil Edtech and Smart Classrooms Market
- Mexico Edtech and Smart Classrooms Market
- South Africa Edtech and Smart Classrooms Market
- United Arab Emirates Edtech and Smart Classrooms Market
- Rest Of Europe Edtech and Smart Classrooms Market
- Rest Of Asia Pacific Edtech and Smart Classrooms Market
Need a Tailored Report?
Customize this report to your needs
Get 10% FREE Customization
Customize This Report
