
Europe Electronic Shelf Labels Market (2024-2029)

The Europe Electronic Shelf Labels Market was valued at $984.4 Million in 2024 and projected to reach to $1658.9 Million by 2029, representing a compound annual growth rate of 11.0%. Europe's Electronic Shelf Labels market is positioned for sustained growth through 2029, expanding from USD 984.4 million to USD 1,658.9 million at an 11% CAGR.


| Market Size in | USD 26.32 MN |
| Market Forecast in | |
| CAGR | |
| Forecast Period | |
| Units Considered | Value (USD MN) |
Europe Electronic Shelf Labels Market Trends and Insights
- This 11.0% compound annual growth rate reflects Europe's strong adoption of digital retail infrastructure and omnichannel commerce strategies.
- Europe's mature retail sector and regulatory emphasis on pricing transparency are driving widespread ESL deployment across supermarkets, hypermarkets, and specialty retailers. The European market benefits from advanced logistics networks, high labor costs that justify automation investments, and stringent EU regulations on consumer protection and data privacy.
- Europe's focus on sustainability and energy-efficient retail solutions further accelerates ESL adoption, as these systems reduce paper waste and operational overhead.
- By 2029, Europe is expected to solidify its position as a key growth region, with increasing integration of ESL systems with inventory management and dynamic pricing platforms..
Key Market Statistics
- CAGR (2024-2029) 11.0% CAGR
- Market Size, 2024 ~USD 984.4 Million
- Forecast, 2029 ~USD 1658.9 Million
- Geography Europe
Europe Electronic Shelf Labels Market Overview
Market Leadership by France :
France dominates Europe's ESL market with USD 715.5 million in market size, representing over 72% of the region's total value. This leadership reflects strong retail modernization initiatives and widespread adoption across hypermarkets and specialty retailers.
Germany's Significant Contribution :
Germany represents the second-largest market at USD 445.2 million, driven by advanced manufacturing sectors and stringent pricing transparency regulations. German retailers are increasingly deploying ESL solutions for competitive advantage and operational efficiency.
Regulatory Compliance Driving Adoption :
Europe's emphasis on pricing transparency and consumer protection regulations is accelerating ESL adoption across the region. Compliance requirements are compelling retailers to modernize pricing infrastructure, particularly in food and beverage sectors.
Omnichannel Retail Transformation :
European retailers are investing heavily in omnichannel commerce strategies, with ESL technology serving as a critical enabler for seamless price synchronization across physical and digital channels, supporting the region's mature retail ecosystem.
Europe Electronic Shelf Labels Market Dynamics
- The region's mature retail infrastructure, combined with regulatory mandates for pricing transparency and consumer protection, creates a favorable environment for ESL adoption.
- Major markets like France and Germany are leading the transformation, with retailers increasingly recognizing ESL as essential for operational efficiency and competitive positioning. The outlook remains positive as European retailers continue digital transformation initiatives and omnichannel expansion.
- Investment in smart retail technologies, coupled with declining ESL hardware costs and improved software capabilities, will drive broader market penetration beyond major markets into mid-sized retailers and specialty segments.
- Sustainability considerations and energy-efficient ESL solutions will also become key differentiators in the European market..
Market Ecosystem
Related Ecosystem
Electronics System And Components
- Sensors
- Temperature Sensors
- Pressure Sensors
- Actuators
- Image Sensors
- Lenovo
- Samsung
- Texas Instruments Incorporated
- HONEYWELL INTERNATIONAL INC.
- Teledyne Technologies Incorporated
Information System And Analytics
- Machine Learning
- Natural Language Processing (NLP)
- Sensors
- Software as A Service (SaaS)
- Data Loss Prevention (DLP)
- International Business Machines Corporation
- MICROSOFT CORPORATION
- Amazon.com, Inc.
- Oracle Corporation
Key Takeaways
- Europe's ESL market will grow from USD 984.4M (2024) to USD 1,658.9M (2029) at an 11.0% CAGR, driven by digital transformation in retail.
- Europe's high labor costs and regulatory environment make ESL adoption economically attractive for retailers seeking operational efficiency.
- Sustainability initiatives and EU data protection regulations are key differentiators accelerating ESL deployment across Europe.
- Integration with omnichannel and dynamic pricing strategies positions Europe as a leader in advanced retail technology adoption by 2029.
Electronic Shelf Labels Market Report Scope
| Report Metric | Details |
|---|---|
| Base Year | 2024 |
| Fastest Growing Segment | OTHER COMMUNICATION TECHNOLOGIES (Communication Technology) |
| Forecast Period | 2024-2029 |
| Growth Rate | CAGR of 12.3% from 2024 to 2029 |
| Largest Segment | RETAIL (End User) |
| Market Size Base Year (Billions) | ~USD 2.34 (2024) |
| Revenue Forecast (Billions) | ~USD 4.18 (2029) |
| Segments Covered | Component, Display Type, Product Type, End User, Retail Store Type, Communication Technology, Display Size, Offering |
Europe Electronic Shelf Labels Market Report Segmentation
8 segment dimensions are covered across the global market.
By Component
- Batteries
- Displays
- Microprocessors
- Other Components
- Transceivers
By Display Type
- E-Paper Display
- Lcd
- Other Display Types
By Product Type
- Fully Graphic E-Paper Display
- Lcd
- Segmented E-Paper Display
By End User
- Industrial
- Retail
By Retail Store Type
- Hypermarkets
- Non-Food Retail Stores
- Other Retail Stores
- Specialty Stores
- Supermarkets
By Communication Technology
- Infrared
- Near-Field Communication
- Other Communication Technologies
- Radio Frequency
By Display Size
- 3 To 7 Inches
- 7 To 10 Inches
- Less Than 3 Inches
- More Than 10 Inches
By Offering
- Hardware
- Software & Services
EUROPE: ELECTRONIC SHELF LABELS MARKET, BY END USER, 2024–2029
| Segment | 2024 | 2025 | 2026 | 2027 | 2028 | 2029 | CAGR (%) |
|---|---|---|---|---|---|---|---|
| INDUSTRIAL | 104.9 | 124.7 | 143.7 | 161.7 | 178.7 | 197.7 | 13.5 |
| RETAIL | 879.5 | 1019.2 | 1145.3 | 1257.1 | 1355.3 | 1461.3 | 10.7 |
| TOTAL | 984.4 | 1144 | 1289.1 | 1418.8 | 1534 | 1658.9 | 11 |
Target Audience
- ESL Hardware & Software Manufacturers : Manufacturers need detailed European market data to identify high-growth countries, optimize production capacity, and develop region-specific product variants aligned with local regulatory requirements and retailer preferences.
- Retail Technology Solution Providers : Solution providers require market insights to position ESL offerings within omnichannel strategies, understand competitive dynamics in key markets like France and Germany, and identify expansion opportunities in emerging segments.
- Retail Chains & Grocery Operators : Large European retailers need market intelligence to evaluate ESL investment ROI, benchmark adoption rates against competitors, and understand pricing transparency compliance implications across different European jurisdictions.
- Private Equity & Investment Firms : Investors evaluating ESL companies or retail technology portfolios require comprehensive European market data to assess growth potential, identify acquisition targets, and understand regional market dynamics and consolidation trends.
- System Integrators & Consultants : Integration firms need detailed market insights to advise clients on ESL implementation strategies, understand regional best practices, and position services effectively across Europe's diverse retail landscape.
Countries within Europe - compare and drill down
| Country | 2025 size (native) |
|---|---|
| Germany | USD 445.2 Million |
| UK | USD 288.5 Million |
| France | USD 715.5 Million |
| Italy | USD 90.8 Million |
| Rest Of Europe | USD 119 Million |
Country market size visualization
Reasons to Buy this Report
- Country-Level Market Breakdown : Access detailed market sizing for France (USD 715.5M), Germany (USD 445.2M), UK (USD 288.5M), Italy (USD 90.8M), and Rest of Europe, enabling precise market targeting and regional strategy development.
- Regulatory Landscape Insights : Understand how European pricing transparency regulations and consumer protection laws are driving ESL adoption, helping you align product offerings with compliance requirements across different markets.
- Competitive Positioning Data : Benchmark your ESL solutions against regional market leaders and identify growth opportunities in underperforming European markets with significant expansion potential through 2029.
- Omnichannel Strategy Alignment : Leverage insights on how European retailers are integrating ESL technology into omnichannel strategies to inform your go-to-market approach and product development priorities.
- Investment Decision Support : Make informed investment and expansion decisions based on comprehensive market forecasts, growth trajectories, and regional dynamics specific to Europe's USD 1.66 billion ESL opportunity by 2029.
Frequently asked questions
What is the current size of Europe's Electronic Shelf Labels market?
Europe's ESL market was valued at USD 984.4 million in 2024 and is expected to reach USD 1,658.9 million by 2029.
What is the projected growth rate for Europe's ESL market?
Europe's Electronic Shelf Labels market is projected to grow at a compound annual growth rate (CAGR) of 11.0% from 2024 to 2029.
Which factors are driving ESL adoption in Europe?
Key drivers include high labor costs, EU regulatory requirements for pricing transparency, sustainability goals, advanced retail infrastructure, and omnichannel commerce integration.
How does Europe's ESL market compare to global trends?
Europe's 11.0% CAGR is slightly below the global 12.3% CAGR, reflecting Europe's mature retail market and already-established digital infrastructure compared to emerging regions.
What retail sectors in Europe are adopting ESL technology most rapidly?
Supermarkets, hypermarkets, and specialty retailers in Europe are leading ESL adoption, driven by the need for dynamic pricing, inventory accuracy, and labor cost reduction.
RESEARCH METHODOLOGY
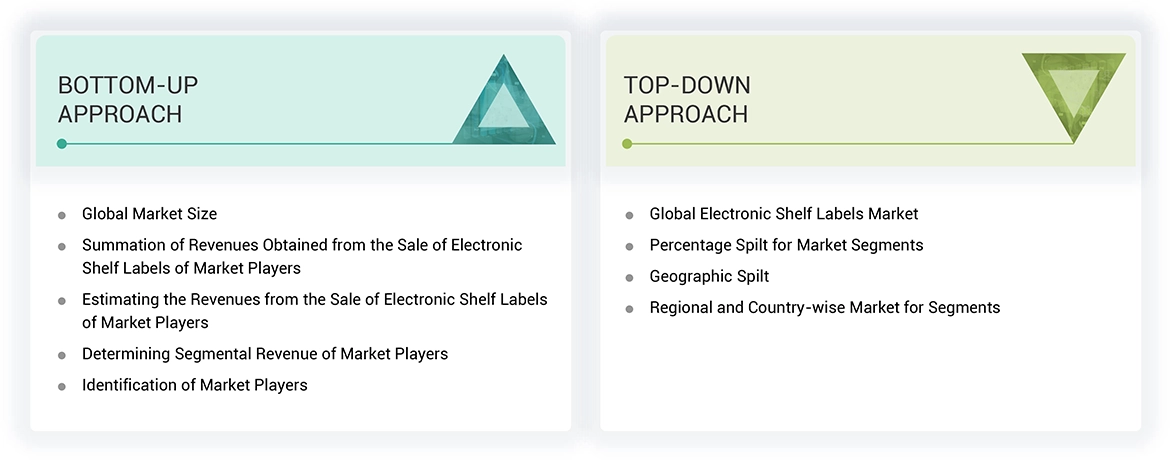
The research study involved 4 major activities in estimating the size of the electronic shelf lables market. Exhaustive secondary research has been done to collect important information about the market and peer markets. The validation of these findings, assumptions, and sizing with the help of primary research with industry experts across the supply chain has been the next step. Both top-down and bottom-up approaches have been used to estimate the market size. Post which the market breakdown and data triangulation have been adopted to estimate the market sizes of segments and sub-segments.
Secondary Research
In the secondary research process, various secondary sources have been referred to for identifying and collecting information required for this study. The secondary sources include annual reports, press releases, investor presentations of companies, white papers, and articles from recognized authors. Secondary research has been mainly done to obtain key information about the market’s supply chain, the pool of key market players, market segmentation according to industry trends, regional outlook, and developments from both market and technology perspectives.
In the electronic shelf lables market report, the global market size has been estimated using both the top-down and bottom-up approaches, along with several other dependent submarkets. The major players in the market were identified using extensive secondary research, and their presence in the market was determined using secondary and primary research. All the percentage shares splits, and breakdowns have been determined using secondary sources and verified through primary sources.
Primary Research
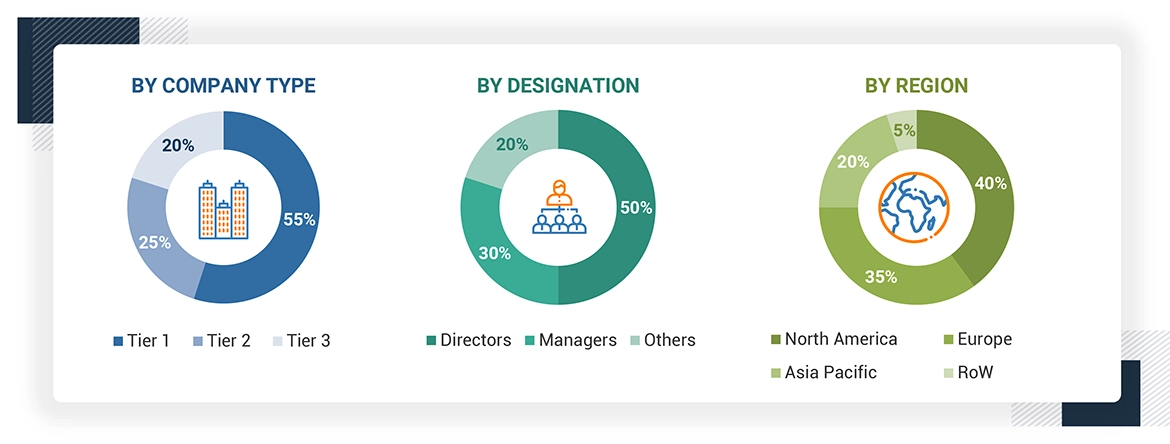
Extensive primary research has been conducted after understanding the electronic shelf lables market scenario through secondary research. Several primary interviews have been conducted with key opinion leaders from both demand- and supply-side vendors across 4 major regions— North America, Europe, Asia Pacific, and the Rest of the World. Approximately 25% of the primary interviews have been conducted with the demand-side vendors and 75% with the supply-side vendors. Primary data has been collected mainly through telephonic interviews, which consist of 80% of the total primary interviews; questionnaires and emails have also been used to collect the data.
After successful interaction with industry experts, brief sessions were conducted with highly experienced independent consultants to reinforce the findings of our primary research. This, along with the in-house subject matter experts’ opinions, has led us to the findings as described in the report. The breakdown of primary respondents is as follows:
To know about the assumptions considered for the study, download the pdf brochure
Market Size Estimation
In the market engineering process, both top-down and bottom-up approaches, along with data triangulation methods, have been used to estimate and validate the size of the electronic shelf labels and other dependent submarkets. The research methodology used to estimate the market sizes includes the following:
- Identifying different stakeholders in the electronic shelf labels market that influence the entire market, along participants across the value chain.
- Analyzing major manufacturers of electronic shelf labels (OEMs) as well as studying their product portfolios
- Analyzing trends related to the adoption of electronic shelf labels based on application
- Tracking the recent and upcoming developments in the market that include investments, R&D activities, product launches, collaborations, mergers & acquisitions, and partnerships as well as forecasting the market size based on these developments and other critical parameters
- Carrying out multiple discussions with key opinion leaders to identify the adoption trends of electronic shelf labels
- Segmenting the overall market into various other market segments
- Validating the estimates at every level through discussions with key opinion leaders, such as chief executives (CXOs), directors, and operation managers, and finally with the domain experts at MarketsandMarkets
Electronic Shelf Labels Market : Top-Down and Bottom-Up Approach
Data Triangulation
After arriving at the overall market size-using the market size estimation processes as explained above-the market has been split into several segments and subsegments. To complete the entire market engineering process and arrive at the exact statistics of each market segment and subsegment, data triangulation and market breakdown procedures have been employed, wherever applicable. The data has been triangulated by studying various factors and trends from the demand and supply sides in the electronic shelf lables market.
Market Definition
Electronic Shelf Labels (ESLs) are digital price tags that replace traditional paper labels in retail environments. They are fixed on the shelves and it is possible to post different information on them as price for products, motives for a sale, quantity in stock, and barcode numbers. The core of ESLs is based on e-paper technology, which facilitates proper information illumination and does not require additional external light sources. They provide instant information using wireless technologies whereby retailers can change prices, promotional campaigns and stock details of the whole store from one location. That minimizes the amount of handling required, increases the accuracy of the prices charged, and optimizes the processing functionality. Also, ESLs play a role in helping the sustainability causes through elimination of papers helps to cut paper usage and hence be more environmentally friendly as compared to paper based tag.
Key Stakeholders
- Original equipment manufacturers (OEMs)
- Raw material suppliers
- System integrators
- Product assembly and packaging vendors
- Electronic shelf label software solution providers
- Distributors
- Research organizations
- Market research and consulting firms
- End Users
Report Objectives
- To define, describe, segment, and forecast the electronic shelf lables market, by component, product type, communication technology, display size, end-user in terms of value
- To forecast the market for display sizes, in terms of volume
- To describe and forecast the market for various segments, with respect to four main regions: North America, Europe, Asia Pacific, RoW along with their respective countries, in terms of value
- To provide detailed information regarding the drivers, restraints, opportunities, and challenges influencing the growth of the electronic shelf lables market
- To provide a detailed overview of the electronic shelf labels market’s supply chain, along with the ecosystem, technology trends, use cases, regulatory environment, and Porter’s five forces analysis
- To analyze industry trends, pricing data, patents and innovations, and trade data (export and import data) related to the electronic shelf labels
- To strategically analyze the micromarkets with respect to individual growth trends, prospects, and contributions to the total market
- To strategically profile the key players and comprehensively analyze their market shares and core competencies
- To analyze opportunities for stakeholders and provide a detailed competitive landscape of the market
- To analyze competitive developments, such as product launches/developments, collaborations, partnerships, acquisitions, and research & development (R&D) activities carried out by players in the electronic shelf lables market
Available Customizations
With the given market data, MarketsandMarkets offers customizations according to the specific requirements of companies. The following customization options are available for the report:
- Detailed analysis and profiling of additional market players (up to 5)
Get the Full Electronic Shelf Labels Market Report
Full forecast, segment splits, and company analysis for all Electronic Shelf Labels Market.
- US Electronic Shelf Labels Market
- Canada Electronic Shelf Labels Market
- Mexico Electronic Shelf Labels Market
- Germany Electronic Shelf Labels Market
- UK Electronic Shelf Labels Market
- France Electronic Shelf Labels Market
- Italy Electronic Shelf Labels Market
- Rest Of Europe Electronic Shelf Labels Market
- China Electronic Shelf Labels Market
- Japan Electronic Shelf Labels Market
- South Korea Electronic Shelf Labels Market
- Taiwan Electronic Shelf Labels Market
- Rest Of Asia Pacific Electronic Shelf Labels Market
- GCC Countries Electronic Shelf Labels Market
Need a Tailored Report?
Customize this report to your needs
Get 10% FREE Customization
Customize This Report
