
Asia Pacific Extended Reality Market (2024-2029)

The Asia Pacific Extended Reality Market was valued at $8270.8 Million in 2024 and projected to reach to $32096.9 Million by 2029, representing a compound annual growth rate of 31.2%. Asia Pacific's Extended Reality Market is positioned for transformative growth through 2029, with the region's 31.2% CAGR reflecting strong momentum in consumer adoption, enterprise applications, and semiconductor infrastructure development.


| Market Size in | USD 26.32 MN |
| Market Forecast in | |
| CAGR | |
| Forecast Period | |
| Units Considered | Value (USD MN) |
Asia Pacific Extended Reality Market Trends and Insights
- Asia Pacific's 31.2% compound annual growth rate significantly outpaces global trends, driven by accelerating digital transformation, rising consumer adoption of AR/VR technologies, and substantial investments in semiconductor infrastructure across the region.
- Key markets including China, Japan, South Korea, and India are leading innovation in immersive computing applications across gaming, enterprise, and industrial sectors. Asia Pacific's dominance in electronics manufacturing and semiconductor production positions the region as a critical hub for Extended Reality hardware development and deployment.
- The forecast period through 2029 reflects Asia Pacific's strategic advantage in supply chain integration, cost-competitive manufacturing, and growing demand from both consumer and enterprise segments.
- Government initiatives supporting metaverse development and digital economy expansion further accelerate Asia Pacific's market penetration and technological advancement in Extended Reality solutions..
Key Market Statistics
- CAGR (2024-2029) 31.2% CAGR
- Market Size, 2024 ~USD 8270.8 Million
- Forecast, 2029 ~USD 32096.9 Million
- Geography Asia Pacific
Asia Pacific Extended Reality Market Overview
Exceptional Growth Trajectory :
Asia Pacific's Extended Reality Market is expanding at 31.2% CAGR, significantly outpacing the global rate of 28.3%, driven by rapid digital transformation and massive semiconductor investments across the region.
China's Market Dominance :
China leads Asia Pacific with $14,539.5 million in market size, representing the largest XR market in the region and serving as a primary innovation hub for AR/VR hardware and software development.
Japan's Technology Leadership :
Japan contributes $9,262.7 million to the regional market, leveraging its advanced semiconductor capabilities and consumer electronics expertise to drive enterprise and consumer XR adoption.
Emerging Growth Markets :
South Korea ($4,553 million) and India ($2,070.9 million) are rapidly emerging as secondary growth engines, with increasing startup ecosystems and government support for XR technology development.
Asia Pacific Extended Reality Market Dynamics
- China and Japan's combined market strength of $23.8 billion establishes Asia Pacific as the global XR innovation epicenter, while emerging markets like India and South Korea present substantial untapped opportunities. The region's growth is underpinned by accelerating digital transformation initiatives, increasing venture capital investment in XR startups, and government policies promoting technology adoption.
- With the market projected to reach $32.1 billion by 2029, Asia Pacific will capture a disproportionate share of global XR expansion, driven by favorable demographics, rising disposable incomes, and the region's established semiconductor manufacturing capabilities..
Market Ecosystem
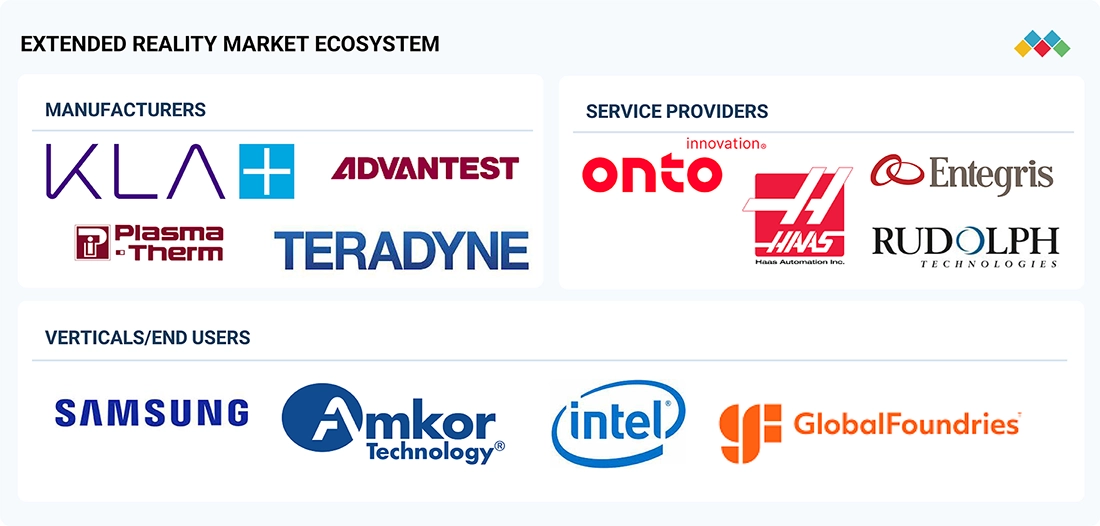
EXTENDED REALITY MARKET SIZE, SHARE AND TRENDS 2030: COMMERCIAL USE CASES ACROSS INDUSTRIES
| COMPANY | USE CASE DESCRIPTION | BENEFITS |
|---|---|---|
 |
Mixed Reality (MR) headsets used for remote assistance, guided maintenance, and training in manufacturing and industrial operations. | Reduces downtime, improves first-time fix rates, lowers training costs, and enhances workforce productivity. |
 |
Industrial XR solutions for digital twins, factory layout planning, and immersive engineering design reviews. | Accelerates design cycles, reduces errors before deployment, and improves collaboration across engineering teams. |
 |
VR-based safety training and skill simulation for manufacturing, logistics, and enterprise environments. | Enhances learning retention, improves worker safety, and enables scalable training programs. |
 |
XR development platform used for automotive design visualization, virtual prototyping, and HMI testing. | Reduces physical prototyping costs, speeds up design validation, and improves product quality. |
Logos and trademarks shown above are the property of their respective owners. Their use here is for informational and illustrative purposes only.
Related Ecosystem
Augmented Virtual Reality
- Sensors
- Virtual Reality Devices
- Augmented Reality
- Virtual Reality
- Augmented Reality Devices
- MICROSOFT CORPORATION
- Lenovo
- VIVITEK CORPORATION
- Apple Inc.
Display Technology
- Augmented Reality
- Liquid Crystal Display (LCD)
- Sensors
- Virtual Reality Devices
- Liquid Crystal on Silicon (LCOS)
- VIVITEK CORPORATION
- Samsung
- Lenovo
- Panasonic Holdings Corporation
- Lg corp
Automotive Electronics And Electrical Equipment
- Battery Electric Vehicle (BEV)
- Light Commercial Vehicles (LCVs)
- Fuel Cell Electric Vehicle (FCEV)
- Sensors
- Hybrid Electric Vehicle (HEV)
- BOSCH LIMITED
- DENSO Corporation
- Continental ag
- Panasonic Holdings Corporation
- Texas Instruments Incorporated
Key Takeaways
- Asia Pacific Extended Reality Market will grow from $8,270.8M (2024) to $32,096.9M (2029) at a 31.2% CAGR, nearly matching global growth momentum.
- Asia Pacific's semiconductor manufacturing leadership and electronics ecosystem create competitive advantages for Extended Reality hardware innovation and deployment.
- China, Japan, South Korea, and India drive Asia Pacific adoption through gaming, enterprise training, industrial applications, and government-backed digital economy initiatives.
- Asia Pacific's supply chain integration and cost-competitive production position the region as the global manufacturing hub for Extended Reality devices and components.
Extended Reality Market Report Scope
| Report Metric | Details |
|---|---|
| Base Year | 2024 |
| Fastest Growing Segment | MR DEVICES (Device Type) |
| Forecast Period | 2024-2029 |
| Growth Rate | CAGR of 28.3% from 2024 to 2029 |
| Largest Segment | SOFTWARE (Offering) |
| Market Size Base Year (Billions) | ~USD 24.34 (2024) |
| Revenue Forecast (Billions) | ~USD 84.6 (2029) |
| Segments Covered | Technology, Type, Offering, Application, Component, Device Type |
Asia Pacific Extended Reality Market Report Segmentation
6 segment dimensions are covered across the global market.
By Technology
- Ar Technology
- Mr Technology
- Vr Technology
By Type
- Anchor-Based Ar
- Gesture-Tracking Devices
- Head-Mounted Displays
- Hmds
- Huds
- Marker-Based Ar
- Markerless Ar
- Non-Immersive
- Projectors & Display Walls
- Semi-Immersive And Fully Immersive
By Offering
- Hardware
- Software
By Application
- Aerospace & Defense
- Automotive
- Commercial
- Consumer
- Energy
- Enterprise
- Healthcare
- Other Applications
By Component
- Cameras
- Displays & Projectors
- Other Components
- Position Trackers
- Semiconductor Components
- Sensors
By Device Type
- Ar Devices
- Mr Devices
- Vr Devices
Target Audience
- XR Hardware Manufacturers : Manufacturers need Asia Pacific market segmentation to optimize product development, identify regional demand patterns, and prioritize market entry strategies in high-growth countries like China and India.
- Semiconductor Companies : Semiconductor firms require detailed regional insights to align chip design and production capacity with Asia Pacific's explosive XR demand, leveraging the region's manufacturing infrastructure advantages.
- Investment & Private Equity Firms : Investors need comprehensive Asia Pacific market data to identify acquisition targets, evaluate portfolio companies' regional growth potential, and allocate capital across emerging XR ecosystems.
- Enterprise Technology Leaders : Corporate decision-makers need country-specific market intelligence to plan XR implementation strategies, assess vendor landscapes, and understand adoption readiness across Asia Pacific operations.
- Government & Policy Makers : Policymakers require regional market analysis to develop technology roadmaps, allocate R&D funding, and create regulatory frameworks supporting XR innovation and semiconductor industry growth.
Countries within Asia Pacific - compare and drill down
| Country | 2025 size (native) |
|---|---|
| China | USD 14539.5 Million |
| Japan | USD 9262.7 Million |
| South Korea | USD 4553 Million |
| India | USD 2070.9 Million |
| Rest Of Asia Pacific | USD 1670.9 Million |
Country market size visualization
Reasons to Buy this Report
- Regional Market Dominance Insights : Understand China and Japan's $23.8 billion combined market leadership and their strategic positioning in global XR innovation, enabling competitive advantage in Asia Pacific expansion.
- High-Growth Opportunity Identification : Identify emerging markets like India and South Korea with explosive growth potential, supported by detailed market sizing and CAGR projections for targeted investment decisions.
- Semiconductor Supply Chain Intelligence : Access critical insights into Asia Pacific's semiconductor infrastructure advantages, essential for understanding XR hardware manufacturing, component sourcing, and supply chain optimization.
- Digital Transformation Benchmarking : Leverage country-specific market data to benchmark digital transformation progress across Asia Pacific, identifying adoption patterns and technology readiness levels by market.
- Strategic Investment Planning : Make data-driven investment decisions with precise market forecasts through 2029, enabling resource allocation across high-potential Asia Pacific markets with 31.2% regional CAGR.
Frequently asked questions
What is the projected size of the Asia Pacific Extended Reality Market by 2029?
The Asia Pacific Extended Reality Market is projected to reach $32,096.9 million by 2029, growing from $8,270.8 million in 2024.
What is the CAGR for Asia Pacific's Extended Reality Market?
Asia Pacific's Extended Reality Market is expected to grow at a compound annual growth rate of 31.2% between 2024 and 2029.
Which countries are driving Extended Reality adoption in Asia Pacific?
China, Japan, South Korea, and India are the primary drivers of Extended Reality adoption in Asia Pacific, leveraging their semiconductor expertise and digital economy investments.
Why is Asia Pacific a key hub for Extended Reality market growth?
Asia Pacific's dominance in semiconductor manufacturing, electronics production, cost-competitive supply chains, and government support for digital transformation make it a critical Extended Reality innovation and deployment hub.
What applications are driving Extended Reality demand in Asia Pacific?
Gaming, enterprise training, industrial applications, metaverse development, and immersive consumer experiences are the primary drivers of Extended Reality adoption across Asia Pacific markets.
RESEARCH METHODOLOGY
The research study involved 4 major activities in estimating the size of the extended reality market. Exhaustive secondary research has been done to collect important information about the market and peer markets. The validation of these findings, assumptions, and sizing with the help of primary research with industry experts across the value chain has been the next step. Both top-down and bottom-up approaches have been used to estimate the market size. Post which the market breakdown and data triangulation have been adopted to estimate the market sizes of segments and sub-segments.
Secondary Research
In the secondary research process, various secondary sources have been referred to for identifying and collecting information required for this study. The secondary sources include annual reports, press releases, investor presentations of companies, white papers, and articles from recognized authors. Secondary research has been mainly done to obtain key information about the market’s value chain, the pool of key market players, market segmentation according to industry trends, regional outlook, and developments from both market and technology perspectives.
In the extended reality market report, the global market size has been estimated using both the top-down and bottom-up approaches, along with several other dependent submarkets. The major players in the market were identified using extensive secondary research, and their presence in the market was determined using secondary and primary research. All the percentage share splits and breakdowns have been determined using secondary sources and verified through primary sources.
Primary Research
Extensive primary research has been conducted after understanding the extended reality market scenario through secondary research. Several primary interviews have been conducted with key opinion leaders from both demand- and supply-side vendors across 4 major regions—North America, Europe, Asia Pacific, and the Rest of the World. Approximately 25% of the primary interviews have been conducted with the demand-side vendors and 75% with the supply-side vendors. Primary data has been collected mainly through telephonic interviews, which consist of 80% of the total primary interviews; questionnaires and emails have also been used to collect the data.
After successful interaction with industry experts, brief sessions were conducted with highly experienced independent consultants to reinforce the findings of our primary research. This, along with the in-house subject matter experts’ opinions, has led us to the findings as described in the report.
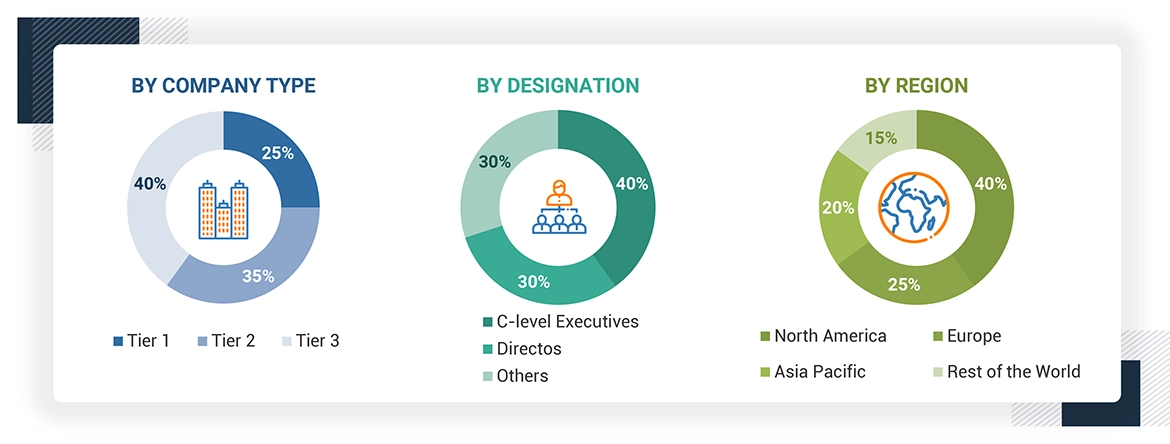
Note: “Others” includes sales, marketing, and product managers
To know about the assumptions considered for the study, download the pdf brochure
Market Size Estimation
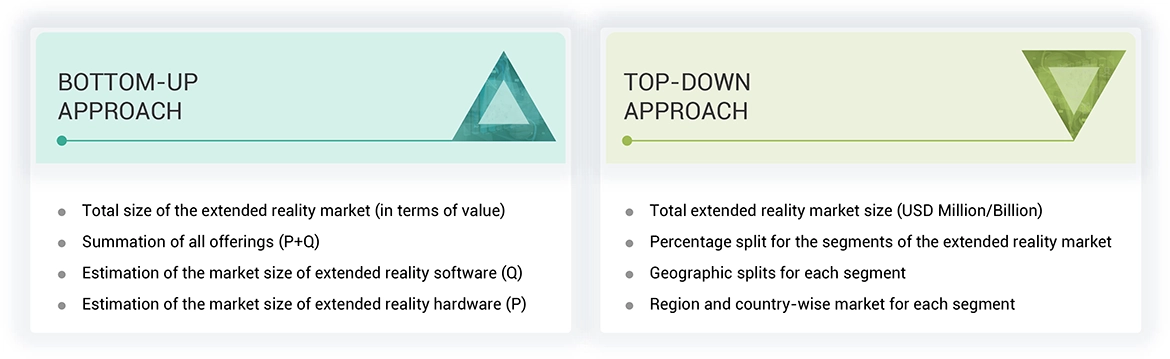
In the market engineering process, both top-down and bottom-up approaches, along with data triangulation methods, have been used to estimate and validate the size of the extended reality and other dependent submarkets. The research methodology used to estimate the market sizes includes the following:
The bottom-up procedure has been employed to arrive at the overall size of the extended reality market.
- Identifying various extended reality devices and software provided or expected to be offered by players in the value chain
- Tracking the major manufacturers and providers of extended reality devices and related software for different regions
- Estimating the extended reality market for devices and software in the respective countries of each region
- Tracking the ongoing and upcoming product launches and different inorganic strategies such as acquisitions, partnerships, and collaborations
- Forecasting the extended reality market in each region based on trade data and GDP analysis
- Conducting multiple discussions with key opinion leaders to understand the types of devices and software deployed by extended reality players and analyzing the break-up of the scope of work carried out by each major company
- Arriving at the market estimates by analyzing the revenues generated by extended reality manufacturers and software providers based in their locations (countries) and then combining the shares to get the market estimate for each region
- Verifying and crosschecking the estimates at every level by discussing with key opinion leaders, including CEOs, directors, and operation managers, and then finally with the domain experts at MarketsandMarkets
- Studying various paid and unpaid information sources such as annual reports, press releases, and white papers
The top-down approach has been used to estimate and validate the total size of the extended reality market.
- Focusing, initially, on the top-line investments and spending in the ecosystems of various industries. Tracking further splits based on product launches, advancements in extended reality technologies, and extended reality devices and software used for various industrial applications, and developments in the key market areas
- Representing and developing the information related to market revenue offered by key hardware and software providers
- Carrying out multiple on-field discussions with key opinion leaders across each major company involved in the development of hardware and software components pertaining to extended reality
- Estimating the geographic split using secondary sources based on factors such as the number of players in a specific country and region, types of products and types of software implemented.
Extended Reality Market : Top-Down and Bottom-Up Approach
Data Triangulation
After arriving at the overall market size by the market size estimation process explained in the earlier section, the overall extended reality market has been divided into several segments and subsegments. To complete the overall market engineering process and arrive at the exact statistics for all segments, the data triangulation and market breakdown procedures have been used, wherever applicable. The data has been triangulated by studying various factors and trends from both the demand and supply side perspectives. Along with data triangulation and market breakdown, the market has been validated by top-down and bottom-up approaches.
Market Definition
Extended Reality (XR) is an umbrella term that includes immersive technologies like Augmented Reality (AR), Virtual Reality (VR), and Mixed Reality (MR). These technologies serve to enhance the user experience by combining the physical and digital elements. Augmented reality (AR) captures a user’s view of reality and enhances it with virtual images or sounds. VR develops a live fictitious environment that users can fully immerse themselves in. MR integrates the real world and virtual worlds creating an interactive environment comprised of both the real and virtual worlds. Extended reality systems function with sophisticated devices like head mounted displays (HMD) units, smart goggles or in some cases even handheld devices and software systems, content development equipment and other elements. The incorporation of innovations, such as AI technology, 5G and motion sensors makes it possible to create innovative and realistic experiences for the end user.
The market for extended reality spans across multiple sectors such as games and entertainment, healthcare, education, retail, automotive, and industrial training, among others. It serves for various purposes including training and simulation, teamwork done through the internet, going on virtual tours, playing computer games, surgeries, etc. This shifts the paradigm on the way people perceive and use technology, while it is as well embraced by businesses for the purpose of enhancing productivity, developing customer relationships and optimizing processes.
Key Stakeholders
- Raw Material and Component Suppliers
- OEMs
- Display Manufactures
- Third-party Service Providers
- Distributors and Resellers
- Service Providers
- Regulatory Bodies
- Research and Development Institutes
- End Users
Report Objectives
- To define, describe, segment, and forecast the extended reality market size by technology, offering, and application in terms of value
- To define, describe, segment, and forecast the extended reality market size by device type in terms of value and volume
- To provide qualitative information about different extended reality devices and the applications of extended reality solutions in different enterprises
- To describe and forecast the extended reality market size in four key regions, namely, North America, Europe, Asia Pacific, and the Rest of the World (RoW), in terms of value
- To provide detailed information regarding the key factors such as drivers, restraints, opportunities, and challenges influencing the growth of the market
- To provide details about the value chain of the extended reality market and provide detailed information regarding Porter's five forces, technology trends, product pricing, trade, use cases, and import and export trends pertaining to the extended reality market
- To analyze opportunities in the market for stakeholders, along with a detailed competitive landscape of the extended reality market
- To analyze micromarkets with respect to individual growth trends, prospects, and contributions to the total market
- To strategically profile the key players and comprehensively analyze their market share and core competencies, along with the competitive leadership mapping chart
- To analyze the competitive developments such as product launches, partnerships, collaborations, contracts, agreements, joint ventures, expansions, and acquisitions in the extended reality market
Available Customizations
With the given market data, MarketsandMarkets offers customizations according to the specific requirements of companies. The following customization options are available for the report:
- Detailed analysis and profiling of additional market players based on various blocks of the supply chain
Get the Full Extended Reality Market Report
Full forecast, segment splits, and company analysis for all Extended Reality Market.
- US Extended Reality Market
- Canada Extended Reality Market
- Mexico Extended Reality Market
- Germany Extended Reality Market
- UK Extended Reality Market
- France Extended Reality Market
- Italy Extended Reality Market
- Rest Of Europe Extended Reality Market
- China Extended Reality Market
- Japan Extended Reality Market
- India Extended Reality Market
- South Korea Extended Reality Market
- Rest Of Asia Pacific Extended Reality Market
- GCC Countries Extended Reality Market
Need a Tailored Report?
Customize this report to your needs
Get 10% FREE Customization
Customize This Report
