
Brazil In-building Wireless Market (2025-2030)

The Brazil In-building Wireless Market was valued at $660.6 Million in 2025 and projected to reach to $1140.2 Million by 2030, representing a compound annual growth rate of 11.8%. Brazil's in-building wireless market is positioned for sustained growth as enterprises and real estate developers prioritize seamless indoor connectivity.


| Market Size in | USD 26.32 MN |
| Market Forecast in | |
| CAGR | |
| Forecast Period | |
| Units Considered | Value (USD MN) |
Brazil In-building Wireless Market Trends and Insights
- This growth trajectory reflects Brazil's increasing demand for seamless indoor connectivity across commercial, residential, and industrial sectors.
- Brazil's market expansion is driven by rising smartphone penetration, enterprise digital transformation, and the need for reliable cellular coverage in urban centers and emerging metropolitan areas. The forecast period through 2030 positions Brazil as a key growth market within Latin America's in-building wireless ecosystem.
- Brazil's investment in 5G infrastructure and network densification initiatives is accelerating adoption of distributed antenna systems (DAS), small cells, and femtocells.
- Brazil's competitive landscape includes both international technology providers and regional players adapting solutions to local regulatory and infrastructure requirements, ensuring sustained market momentum through the forecast period..
Key Market Statistics
- CAGR (2025-2030) 11.8% CAGR
- Market Size, 2025 ~USD 660.6 Million
- Forecast, 2030 ~USD 1140.2 Million
- Country Brazil
Brazil In-building Wireless Market Overview
Market Valuation Growth :
Brazil's in-building wireless market is valued at USD 660.6 million in 2025, with projections reaching USD 1,140.2 million by 2030, demonstrating strong market maturation and investment confidence in the region.
Consistent CAGR Performance :
The Brazilian market maintains an 11.8% compound annual growth rate through 2030, aligning with global market trends and indicating sustained demand for indoor connectivity solutions across multiple sectors.
Multi-Sector Adoption :
Growth is driven by increasing demand for seamless indoor connectivity across commercial office spaces, residential developments, and industrial facilities, reflecting Brazil's diversified economic expansion.
Infrastructure Modernization :
Brazil's push toward digital transformation and smart building initiatives is accelerating adoption of in-building wireless solutions, particularly in major metropolitan areas like São Paulo and Rio de Janeiro.
Brazil In-building Wireless Market Dynamics
- The 11.8% CAGR reflects increasing investments in commercial infrastructure modernization, residential smart building technologies, and industrial IoT applications across the country.
- Major urban centers are leading adoption, with growing recognition of in-building wireless systems as essential infrastructure rather than optional upgrades. Looking ahead, Brazil's market will benefit from regulatory support for 5G deployment, rising smartphone penetration, and corporate demand for reliable workplace connectivity.
- The convergence of remote work trends, smart city initiatives, and industrial automation will continue driving market expansion through 2030, creating opportunities for solution providers and infrastructure investors..
Market Ecosystem
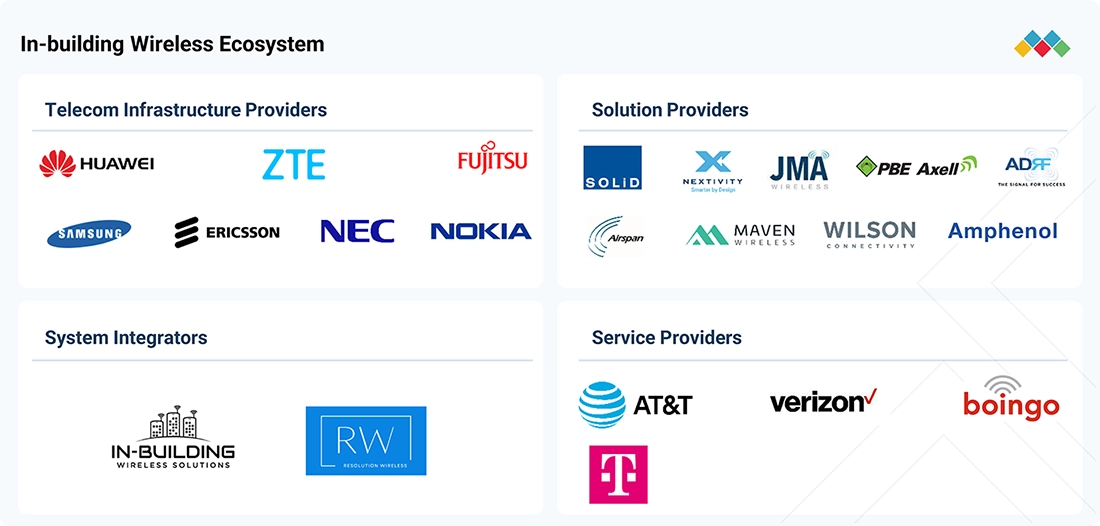
IN-BUILDING WIRELESS MARKET: COMMERCIAL USE CASES ACROSS INDUSTRIES
| COMPANY | USE CASE DESCRIPTION | BENEFITS |
|---|---|---|
 |
Huawei provides Digital Indoor System (DIS), LampSite Pro, LampSite Sharing, and LampSite iSharing solutions for 4G/5G coverage in high-density indoor environments such as airports, railway stations, malls, offices, campuses, and industrial facilities. | Improved indoor 4G/5G coverage and capacity | Multi-operator network sharing | Flexible network expansion | Simplified deployment and O&M | Better user experience | Indoor positioning support |
 |
Ericsson provides Radio Dot System and Indoor Radio Units for 4G/5G connectivity in offices, factories, retail stores, airports, and large venues. Its solutions support multi-operator networks, neutral-host deployments, and enterprise applications such as asset tracking and indoor positioning. | Consistent indoor coverage | High capacity and performance | Multi-operator infrastructure sharing | Lower deployment and operating costs | Network scalability | Support for private 5G and positioning applications |
 |
ZTE provides QCell digital indoor distributed systems for 4G/5G coverage across malls, stadiums, railway stations, offices, parking areas, residential buildings, and industrial sites. QCell supports multi-band, multi-mode, and multi-operator deployments with indoor positioning capabilities. | Enhanced indoor 5G coverage and capacity | Multi-band and multi-mode support | Multi-operator sharing | Simplified deployment | Lower CAPEX and OPEX | High-density performance | Indoor positioning support |
Logos and trademarks shown above are the property of their respective owners. Their use here is for informational and illustrative purposes only.
Related Ecosystem
Data Centre And Networking
- Software-Defined Networking (SDN)
- Mid-Sized Data Centers
- Small Data Centers
- Remote Monitoring
- Smart Healthcare
- Cisco Systems, Inc.
- HUAWEI TECHNOLOGIES CO LTD
- Hewlett Packard Enterprise Company
- MITSUBISHI ELECTRIC INFORMATION SYSTEMS CORPORATION
- MITSUBISHI ELECTRIC INFORMATION NETWORK CORPORATION
Mobility And Telecom
- Smart Utilities
- Smart Healthcare
- Sensors
- Parking Management System
- Passenger Information System (PIS)
- AT&T Inc.
- Cisco Systems, Inc.
- HUAWEI TECHNOLOGIES CO LTD
- Telefonaktiebolaget LM Ericsson (publ)
- International Business Machines Corporation
Key Takeaways
- Brazil's in-building wireless market will nearly double from USD 660.6M (2025) to USD 1,140.2M (2030) at an 11.8% CAGR.
- Brazil's 5G rollout and enterprise digitalization are primary catalysts driving indoor wireless infrastructure investment.
- Brazil's market benefits from high urban density and growing demand for seamless connectivity in commercial and residential properties.
- Brazil's regulatory environment and infrastructure modernization initiatives create sustained opportunities for DAS, small cell, and femtocell deployments.
In-building Wireless Market Report Scope
| Report Metric | Details |
|---|---|
| Base Year | 2025 |
| Fastest Growing Segment | NFV (Core Network Technology) |
| Forecast Period | 2025-2030 |
| Growth Rate | CAGR of 11.8% from 2025 to 2030 |
| Largest Segment | 5G STANDALONE (NR + CORE) (Network Architecture) |
| Market Size Base Year (Billions) | ~USD 22.59 (2025) |
| Revenue Forecast (Billions) | ~USD 39.46 (2030) |
| Segments Covered | Offering, Hardware, Software, Service, Professional Service, Technology, Distributed Antenna System, Business Model, Building Size, Network Type, End User, Component, Coverage, Type, Ownership Model, User Facility Area, Vertical, Commercial Vertical, Frequency Protocol, Communication Infrastructure, Core Network Technology, Network Architecture, Operational Frequency |
Brazil In-building Wireless Market Report Segmentation
23 segment dimensions are covered across the global market.
By Offering
- Component
- Hardware
- Service
- Services
- Software
By Hardware
- Antennas
- Femtocells
- Head End Units
- Other Hardware
- Remote Units
- Repeaters
By Software
- Network Management
- Network Planning & Design
- Other Software
By Service
- Installation Services
- Managed Services
- Post-Sales Services
- Pre-Sales Services
- Professional Services
By Professional Service
- Integration & Deployment
- Network Design
- Training, Support, & Maintenance
- Training, Support, And Maintenance
By Technology
- Distributed Antenna System
- Distributed Radio System
- Distributed Small Cell
- Other Technologies
By Distributed Antenna System
- Active Das
- Hybrid Das
- Passive Das
By Business Model
- Enterprises
- Neutral Host Operators
- Service Providers
By Building Size
- Large Buildings
- Medium Buildings
- Small Buildings
By Network Type
- Private Lte/Cbrs
- Private Network
- Public Network
By End User
- Commercial Campuses
- Education
- Entertainment & Sports Venues
- Government
- Healthcare
- Hospitality
- Industrial & Manufacturing
- Other End Users
- Transportation & Logistics
By Component
- Antenna Nodes/Radio Nodes
- Bi-Directional Amplifiers (Bda)
- Das/Point-Of-Interface (Poi) Trays
- Head-End Units
- Other Components
- Radio Units
By Coverage
- Indoor
- Outdoor
By Type
- Active
- Hybrid
- Passive
By Ownership Model
- Carrier Ownership
- Enterprise Ownership
- Neutral-Host Ownership
By User Facility Area
- 200-500 K Sq. Ft.
- <200 K Sq. Ft.
- > 500 K Sq. Ft.
By Vertical
- Commercial
- Public Safety
By Commercial Vertical
- Airport & Transportation
- Education
- Enterprise
- Enterprises
- Government
- Healthcare
- Hospitality
- Industrial
- Public Venues
- Retail
By Frequency Protocol
- Cellular
- Vhf/Uhf
By Communication Infrastructure
- Macro Cell
- Small Cell
By Core Network Technology
- Nfv
- Sdn
By Network Architecture
- 5G Nr Non-Standalone(Lte Combined)
- 5G Standalone (Nr + Core)
By Operational Frequency
- Above 6 Ghz
- Sub 6 Ghz
BRAZIL: IN-BUILDING WIRELESS MARKET, BY END USER, 2025–2030
| Segment | 2025 | 2026 | 2027 | 2028 | 2029 | 2030 | CAGR (%) |
|---|---|---|---|---|---|---|---|
| COMMERCIAL CAMPUSES | 126.3 | 142.3 | 159.9 | 179.2 | 200.5 | 223.7 | 12.1 |
| EDUCATION | 63.8 | 72.4 | 82 | 92.7 | 104.5 | 117.4 | 13 |
| ENTERTAINMENT & SPORTS VENUES | 70 | 79.1 | 89.3 | 100.5 | 112.9 | 126.4 | 12.6 |
| GOVERNMENT | 84.8 | 93.2 | 102.1 | 111.6 | 121.6 | 132.1 | 9.3 |
| HEALTHCARE | 31.1 | 34.9 | 39.1 | 43.7 | 48.8 | 54.3 | 11.8 |
| HOSPITALITY | 54.8 | 60.8 | 67.4 | 74.6 | 82.3 | 90.5 | 10.6 |
| INDUSTRIAL & MANUFACTURING | 72.9 | 80.6 | 88.9 | 97.7 | 107.2 | 117.3 | 10 |
| OTHER END USERS | 87.3 | 97.3 | 108.2 | 120.1 | 132.9 | 146.7 | 10.9 |
| TRANSPORTATION & LOGISTICS | 69.6 | 79.5 | 90.5 | 102.8 | 116.5 | 131.6 | 13.6 |
| TOTAL | 660.6 | 740.2 | 827.5 | 923 | 1027.2 | 1140.2 | 11.5 |
Target Audience
- Infrastructure Investors : Real estate developers and infrastructure funds need Brazil market data to evaluate investment returns, assess growth potential, and make informed decisions on in-building wireless infrastructure projects.
- Telecom Operators : Brazilian and international telecom providers require market insights to plan network expansion, allocate resources efficiently, and identify opportunities for indoor coverage enhancement and service differentiation.
- Technology Solution Providers : Equipment manufacturers and system integrators need Brazil-specific market intelligence to develop localized solutions, identify customer segments, and establish distribution partnerships in the region.
- Enterprise IT Decision Makers : Corporate real estate and IT leaders in Brazil need market data to benchmark connectivity solutions, evaluate vendor options, and justify investments in in-building wireless infrastructure upgrades.
- Government & Policy Makers : Brazilian regulatory bodies and government agencies require market insights to develop telecommunications policies, support digital infrastructure initiatives, and guide smart city development programs.
Reasons to Buy this Report
- Market Entry Strategy : Gain comprehensive insights into Brazil's specific market dynamics, competitive landscape, and growth drivers to develop targeted market entry strategies and identify high-potential customer segments.
- Investment Decision Support : Access detailed financial projections and market sizing data for Brazil to support capital allocation decisions, M&A evaluations, and partnership opportunities in the region's in-building wireless sector.
- Competitive Positioning : Understand Brazil-specific customer requirements, regulatory environment, and technology adoption patterns to differentiate your offerings and establish competitive advantages in this growing market.
- Sector-Specific Opportunities : Identify high-growth segments within Brazil's commercial, residential, and industrial sectors to prioritize sales efforts and develop customized solutions for regional market needs.
- Risk Mitigation : Leverage Brazil market intelligence to anticipate challenges, understand regulatory requirements, and develop contingency plans for successful market operations and sustainable growth.
Frequently asked questions
What is the projected market size of Brazil's in-building wireless market by 2030?
Brazil's in-building wireless market is projected to reach USD 1,140.2 million by 2030, growing from USD 660.6 million in 2025.
What is the CAGR for Brazil's in-building wireless market from 2025 to 2030?
Brazil's in-building wireless market is expected to grow at a compound annual growth rate of 11.8% during the 2025-2030 forecast period.
What are the primary drivers of growth in Brazil's in-building wireless market?
Brazil's market growth is driven by 5G infrastructure expansion, enterprise digital transformation, rising smartphone adoption, and the need for reliable indoor cellular coverage in urban and metropolitan areas.
Which technologies are most relevant to Brazil's in-building wireless market?
Distributed antenna systems (DAS), small cells, femtocells, and Wi-Fi 6 solutions are the primary technologies deployed across Brazil's commercial, residential, and industrial sectors.
How does Brazil's market compare to other Latin American countries?
Brazil represents the largest in-building wireless market in Latin America, driven by its population size, urbanization rate, and advanced telecommunications infrastructure relative to regional peers.
RESEARCH METHODOLOGY
The research study involved four major activities in estimating the in-building wireless market size. Exhaustive secondary research has been done to collect important information about the market and peer markets. The next step was to validate these findings and assumptions and size the market with the help of primary research with industry experts across the value chain. Both top-down and bottom-up approaches have been used to estimate the market size. Afterward, the market breakdown and data triangulation were used to estimate the market sizes of segments and sub-segments.
Secondary Research
The market size of companies offering in-building wireless solutions and services for various subscribers was estimated based on secondary data available through paid and unpaid sources and by analyzing the offerings (hardware, software and services) of major companies in the ecosystem and rating them based on performance and quality. In the secondary research process, various sources were used to identify and collect information for this study. The secondary sources included annual reports, press releases and investor presentations of companies, white papers, journals, and certified publications and articles from recognized authors, directories, and databases.
Secondary research was mainly used to obtain key information about the industry’s supply chain, the total pool of key players, market classification, and segmentation according to industry trends to the bottom-most level, regional markets, and key developments from both market- and technology-oriented perspectives, all of which were further validated by primary sources.
Primary Research
In the primary research process, various primary sources from both the supply and demand sides were interviewed to obtain qualitative and quantitative information for the report. Primary sources from the supply side include industry experts such as Chief Executive Officers (CEOs), Vice Presidents (VPs), marketing directors, technology and innovation directors, and other key executives from various companies and organizations providing in-building wireless solutions. Primary demand-side sources include end users such as Chief Information Officers (CIOs), consultants, service professionals, technicians and technologists, and managers at public and investor-owned utilities.
In the market engineering process, top-down and bottom-up approaches have been extensively used, along with several data triangulation methods, to perform market estimation and market forecasting for the overall market segments and subsegments listed in the report. Extensive qualitative and quantitative analyses have been performed on the complete market engineering process to list key information/insights throughout the report.
After completing the market engineering (including calculations for market statistics, market breakup, market size estimations, market forecasting, and data triangulation), extensive primary research was conducted to gather information. Primary research was conducted to identify segmentation, industry trends, key players, the competitive landscape, and key market dynamics, such as drivers, restraints, opportunities, challenges, and key strategies.
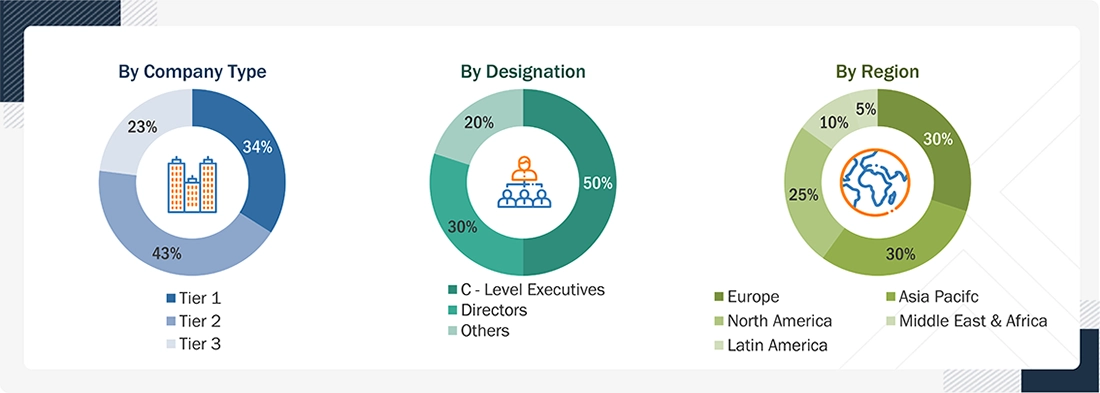
Note 1: Tier 1 companies have revenues of more than USD 10 billion; tier 2 companies’ revenue ranges from USD 1 billion to USD 10 billion; and tier 3 companies’ revenue ranges from USD 500 million to USD 1 billion
Source: Secondary Literature, Interviews with Experts, and MarketsandMarkets Analysis
To know about the assumptions considered for the study, download the pdf brochure
Market Size Estimation
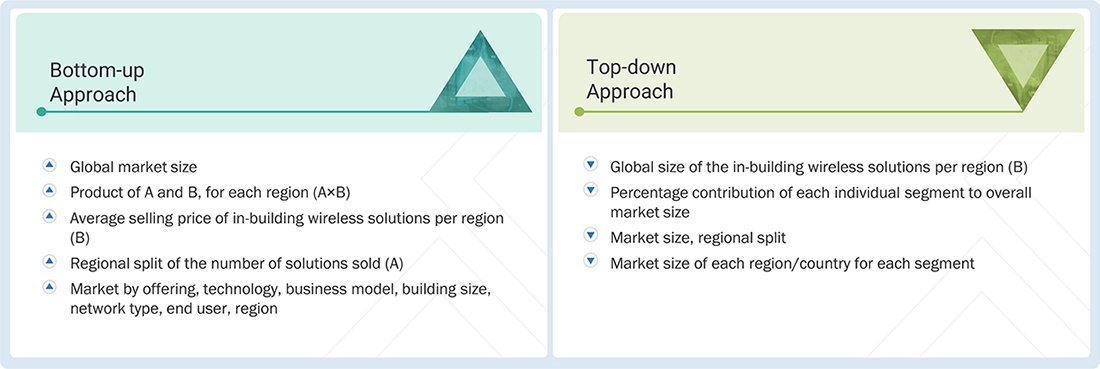
In the market engineering process, the top-down and bottom-up approaches were used along with multiple data triangulation methods to estimate and validate the size of the In-building wireless market, as well as other dependent submarkets. The research methodology used to estimate the market sizes includes the following:
- Initially, MarketsandMarkets focuses on top-line investments and spending in the ecosystems. It also considers significant developments in the critical market area.
- Tracking the recent and upcoming developments in the In-building wireless market that include investments, R&D activities, product launches, collaborations, mergers and acquisitions, and partnerships, as well as forecasting the market size based on these developments and other critical parameters.
- Conduct multiple discussions with key opinion leaders to learn about the diverse types of authentications and brand protection offerings used and the applications for which they are used to analyze the breakdown of the scope of work carried out by major companies.
- Segmenting the market based on technology types concerning applications wherein the types are to be used and deriving the size of the global In-building wireless market.
- Segmenting the overall market into various market segments
- Validating the estimates at every level through discussions with key opinion leaders, such as chief executives (CXOs), directors, and operations managers, and finally with the domain experts at MarketsandMarkets.
Data Triangulation
After arriving at the overall market size from the above estimation process, the in-building wireless market has been split into several segments and sub-segments. To complete the overall market engineering process and arrive at the exact statistics for all segments and sub-segments, data triangulation and market breakdown procedures have been used, wherever applicable. The data has been triangulated by studying various factors and trends from both the demand and supply sides.
The in-building wireless market size has been validated using top-down and bottom-up approaches.
Market Definition
In-building wireless is a system installed in different types of buildings to offer more robust mobile coverage for mobile users inside the building. Distributed antenna systems (DAS) and small cells are the most commonly used in-building wireless solutions. These solutions enhance mobile network coverage inside a designated area, improve signal quality and extend coverage to every part of the building, enabling efficient and reliable access to voice and data services.
Key Stakeholders
- Network infrastructure enablers
- Technology vendors
- Mobile network operators (MNOs)
- Independent software vendors (ISVs)
- Communication service providers (CSPs)
- System integrators (SIs)
- Neutral host operators
- Resellers
- Value-added resellers (VARs)
- Managed service providers (MSPs)
- Compliance regulatory authorities
- Government authorities
- Investment firms
- Cloud service providers
- In-building wireless alliances/groups
- Original design manufacturers (ODMs)
- Original equipment manufacturers (OEMs)
- Enterprises/Businesses
Report Objectives
- To determine, segment, and forecast the In-building wireless market by offering (hardware, software, and services), technology, business model, building size, network type, end user, and region, in terms of value
- To forecast the size of the market segments across five main regions: North America, Europe, Asia Pacific, Middle East & Africa, and Latin America
- To provide detailed information about the major factors (drivers, restraints, opportunities, and challenges) influencing the growth of the market
- To study the complete value chain and related industry segments and perform a value chain analysis of the market landscape
- To strategically analyze the macro and micromarkets with respect to individual growth trends, prospects, and contributions to the total market
- To analyze the industry trends, pricing data, patents, and innovations related to the market
- To analyze opportunities for stakeholders by identifying high-growth market segments
- To profile the key players in the market and comprehensively analyze their market share/ranking and core competencies
- To track and analyze competitive developments, such as mergers & acquisitions, product launches & developments, partnerships, agreements, collaborations, business expansions, and R&D activities
Available customizations:
With the given market data, MarketsandMarkets offers customizations per the company’s specific needs. The following customization options are available for the report:
Geographic Analysis
- Further break-up of the Asia Pacific market into countries contributing 75% to the regional market size
- Further break-up of the North American market into countries contributing 75% to the regional market size
- Further break-up of the Latin American market into countries contributing 75% to the regional market size
- Further break-up of the Middle East & African market into countries contributing 75% to the regional market size
- Further break-up of the European market into countries contributing 75% to the regional market size
Company Information
- Detailed analysis and profiling of additional market players (up to 5)
Get the Full In-building Wireless Market Report
Full forecast, segment splits, and company analysis for all In-building Wireless Market.
- Canada In-building Wireless Market
- US In-building Wireless Market
- UK In-building Wireless Market
- Germany In-building Wireless Market
- Italy In-building Wireless Market
- China In-building Wireless Market
- Japan In-building Wireless Market
- India In-building Wireless Market
- UAE In-building Wireless Market
- Mexico In-building Wireless Market
- France In-building Wireless Market
- Rest Of Europe In-building Wireless Market
- Rest Of Asia Pacific In-building Wireless Market
- Rest Of Latin America In-building Wireless Market
- GCC Countries In-building Wireless Market
- South Africa In-building Wireless Market
- Ksa In-building Wireless Market
- Rest Of GCC Countries In-building Wireless Market
Need a Tailored Report?
Customize this report to your needs
Get 10% FREE Customization
Customize This Report
