
Rest Of Europe Interactive Display Market (2024-2029)

The Rest Of Europe Interactive Display Market was valued at $767.5 Million in 2024 and projected to reach to $908.4 Million by 2029, representing a compound annual growth rate of 3.4%. Rest Of Europe's interactive display market demonstrates steady growth potential, driven by progressive digital adoption across education institutions, corporate offices, and retail environments.


| Market Size in | USD 26.32 MN |
| Market Forecast in | |
| CAGR | |
| Forecast Period | |
| Units Considered | Value (USD MN) |
Rest Of Europe Interactive Display Market Trends and Insights
- Rest Of Europe represents a significant but moderately growing segment within the broader European interactive display ecosystem, driven by steady adoption across education, corporate, and retail sectors.
- The region's growth trajectory reflects increasing digitalization initiatives and investment in smart workplace solutions throughout 2024-2029. Rest Of Europe's interactive display market is characterized by gradual but consistent expansion, supported by rising demand for collaborative technologies and digital signage applications.
- Throughout the forecast period, Rest Of Europe is expected to benefit from modernization of educational institutions and enterprise environments seeking enhanced visual communication tools.
- The 3.4% CAGR indicates a measured pace of market development, with Rest Of Europe balancing mature market saturation in Western segments against emerging opportunities in Central and Eastern European territories..
Key Market Statistics
- CAGR (2024-2029) 3.4% CAGR
- Market Size, 2024 ~USD 767.5 Million
- Forecast, 2029 ~USD 908.4 Million
- Country Rest Of Europe
Rest Of Europe Interactive Display Market Overview
Market Valuation :
Rest Of Europe's interactive display market is valued at USD 767.5 million in 2024, representing a substantial segment within the European market with steady growth trajectory.
Projected Growth :
The market is forecasted to reach USD 908.4 million by 2029, demonstrating consistent expansion driven by increasing digitalization across multiple sectors in the region.
Regional CAGR :
Rest Of Europe exhibits a CAGR of 3.4% from 2024-2029, reflecting moderate but stable growth compared to the global average of 6.3%, indicating untapped expansion opportunities.
Key Adoption Drivers :
Education, corporate, and retail sectors are primary growth catalysts in Rest Of Europe, with increasing investments in digital transformation and interactive learning environments fueling market demand.
Rest Of Europe Interactive Display Market Dynamics
- The region benefits from increasing government initiatives supporting digital infrastructure and workplace modernization.
- However, growth remains moderate at 3.4% CAGR, reflecting slower adoption rates compared to Western European markets and economic constraints in certain countries. Looking ahead to 2029, Rest Of Europe will experience incremental market expansion as SMEs and mid-sized enterprises increasingly invest in interactive solutions for enhanced collaboration and customer engagement.
- Regional economic recovery, coupled with rising awareness of interactive display benefits, will support sustained growth.
- Market players should focus on cost-effective solutions and localized support strategies to capture emerging opportunities in this developing segment..
Market Ecosystem
Related Ecosystem
Display Technology
- Augmented Reality
- Liquid Crystal Display (LCD)
- Sensors
- Virtual Reality Devices
- Liquid Crystal on Silicon (LCOS)
- VIVITEK CORPORATION
- Samsung
- Lenovo
- Panasonic Holdings Corporation
- Lg corp
Key Takeaways
- Rest Of Europe's interactive display market will grow from USD 767.5M (2024) to USD 908.4M (2029) at a 3.4% CAGR.
- Rest Of Europe exhibits slower growth compared to global benchmarks, reflecting market maturity in Western Europe and gradual adoption in emerging markets.
- Education and corporate sectors drive demand for interactive displays across Rest Of Europe, supported by digital transformation initiatives.
- Rest Of Europe's regional diversity creates segmented growth opportunities, with Central and Eastern European markets offering higher expansion potential than saturated Western segments.
Interactive Display Market Report Scope
| Report Metric | Details |
|---|---|
| Base Year | 2024 |
| Fastest Growing Segment | FLEXIBLE (Panel Type) |
| Forecast Period | 2024-2029 |
| Growth Rate | CAGR of 6.3% from 2024 to 2029 |
| Largest Segment | FLAT (Panel Type) |
| Market Size Base Year (Billions) | ~USD 12.45 (2024) |
| Revenue Forecast (Billions) | ~USD 16.9 (2029) |
| Segments Covered | Product, Vertical, Panel Size, Panel Type, Technology |
Rest Of Europe Interactive Display Market Report Segmentation
5 segment dimensions are covered across the global market.
By Product
- Interactive Kiosks
- Interactive Monitors
- Interactive Tables
- Interactive Video Walls
- Interactive Whiteboards
By Vertical
- Bfsi
- Corporate & Government
- Education
- Healthcare
- Industrial
- Other Verticals
- Retail & Hospitality
- Sports & Entertainment
- Transportation
By Panel Size
- 17-32 Inches
- 32-65 Inches
- Above 65 Inches
By Panel Type
- Flat
- Flexible
- Transparent
By Technology
- Lcd
- Led
- Oled
- Other Technologies
Target Audience
- Market Entry Strategists : Companies planning expansion into Rest Of Europe need region-specific market data to assess opportunity size, growth potential, and competitive landscape before committing resources.
- Product Development Managers : Interactive display manufacturers require insights into Rest Of Europe's sector preferences and adoption rates to tailor product features, pricing, and go-to-market strategies for regional success.
- Investment & Finance Teams : Investors and financial analysts need accurate Rest Of Europe market valuations and forecasts to evaluate portfolio opportunities, fund allocation decisions, and ROI projections in the interactive display sector.
- Sales & Business Development : Regional sales leaders need Rest Of Europe-specific market intelligence to identify customer segments, prioritize territories, and develop targeted sales strategies for revenue growth.
- Strategic Consultants : Management consultants advising clients on digital transformation initiatives require Rest Of Europe market data to benchmark performance, identify best practices, and recommend regional expansion strategies.
Reasons to Buy this Report
- Regional Market Sizing : Obtain precise valuation data specific to Rest Of Europe (USD 767.5M in 2024), enabling accurate budget allocation and investment decisions tailored to this distinct regional market segment.
- Growth Forecasting : Access detailed 5-year projections through 2029 with region-specific CAGR of 3.4%, allowing strategic planning and competitive positioning within Rest Of Europe's interactive display ecosystem.
- Sector-Specific Insights : Understand adoption patterns across education, corporate, and retail sectors unique to Rest Of Europe, identifying high-potential verticals for targeted market entry and expansion strategies.
- Competitive Benchmarking : Compare Rest Of Europe's 3.4% CAGR against global 6.3% benchmark to identify market maturity levels, competitive intensity, and differentiation opportunities specific to the region.
- Investment Decision Support : Leverage comprehensive regional analysis to evaluate market attractiveness, risk assessment, and ROI potential for product launches, partnerships, or acquisitions in Rest Of Europe.
Frequently asked questions
What is the market size of interactive displays in Rest Of Europe in 2024?
Rest Of Europe's interactive display market is valued at USD 767.5 million in 2024.
What is the projected market size for Rest Of Europe by 2029?
Rest Of Europe's interactive display market is forecast to reach USD 908.4 million by 2029.
What is the CAGR for Rest Of Europe's interactive display market?
Rest Of Europe's interactive display market is expected to grow at a CAGR of 3.4% from 2024 to 2029.
Which sectors drive demand for interactive displays in Rest Of Europe?
Education, corporate, and retail sectors are primary drivers of interactive display adoption across Rest Of Europe, supported by digital transformation and collaborative workspace trends.
How does Rest Of Europe's growth compare to global trends?
Rest Of Europe's 3.4% CAGR is lower than the global 6.3% CAGR, reflecting market maturity in Western Europe offset by emerging growth in Central and Eastern European regions.
RESEARCH METHODOLOGY
The study involved four major activities in estimating the size of the interactive flat panel display market. Exhaustive secondary research has been conducted to collect information on the market, the peer markets, and the parent market. Both top-down and bottom-up approaches have been employed to estimate the total market size. Market breakdown and data triangulation methods have also been used to estimate the market for segments and subsegments.
Secondary Research
Revenues of companies offering interactive displays have been obtained from the secondary data available through paid and unpaid sources. The revenues have also been derived by analyzing the product portfolio of key companies, and these companies have been rated according to the performance and quality of their products.
Various secondary sources have been referred to in the secondary research process for identifying and collecting information important for this study. Secondary sources include corporate filings (such as annual reports, investor presentations, and financial statements); trade, business, and professional associations; white papers; IoT technologies journals and certified publications; articles by recognized authors; gold-standard and silver-standard websites; directories; and databases.
Secondary research has been conducted mainly to obtain critical information about the market’s value chain, the total pool of key players, market classification and segmentation according to the industry trends to the bottom-most level, geographic markets, and key developments from both demand- and technology-oriented perspectives. Secondary data has been collected and analyzed to determine the overall market size, further validated by primary research.
Primary Research
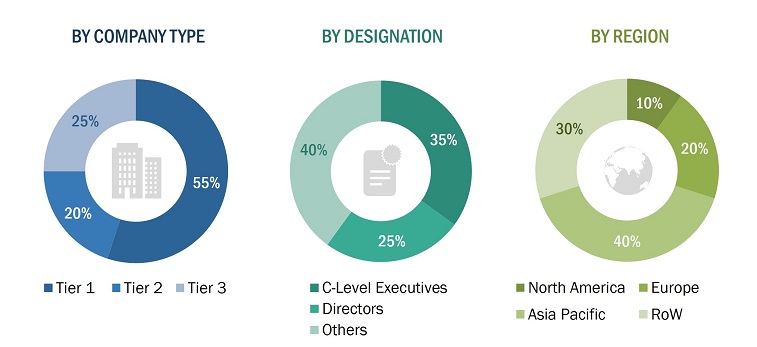
Extensive primary research has been conducted after understanding and analyzing the current scenario of the interactive flat panel display market through secondary research. Several primary interviews have been conducted with key opinion leaders from both demand and supply sides across 4 major regions: North America, Europe, Asia Pacific, and RoW. Approximately 25% of the primary interviews have been conducted on the demand side, while 75% have been conducted on the supply side. Primary data has been collected mainly through telephonic interviews, which consist of 80% of the total primary interviews. Questionnaires and e-mails have also been used to collect data.
After interacting with industry experts, brief sessions were conducted with highly experienced independent consultants to reinforce the findings from our primary. This, along with the in-house subject matter experts’ opinions, has led us to the findings as described in the remainder of this report. The breakdown of primary respondents is as follows:
To know about the assumptions considered for the study, download the pdf brochure
Market Size Estimation
The bottom-up procedure has been employed to arrive at the overall size of the interactive display market.
- Identifying the entities in the interactive display market influencing the entire market along with related component players
- Analyzing major manufacturers of interactive displays, studying their portfolios, and understanding different types of products based on their features and functions
- Analyzing trends in the usage of interactive display offerings
- Tracking the ongoing and upcoming developments in the market, such as investments made, R&D activities, product launches, collaborations, and partnerships, and forecasting the market size based on these developments and other critical parameters
- Carrying out multiple discussions with key opinion leaders to understand the different types of interactive displays, applications, and recent trends in the market, thereby analyzing the breakup of the scope of work carried out by major manufacturing companies
- Arriving at the market estimates by analyzing segmental revenues of these companies generated by interactive display offerings and then combining the same to get the market estimate by different segments
- Verifying and cross-checking the estimate at every level by discussing with key opinion leaders, such as Chief Experience Officers (CXOs), directors, and operations managers, and finally with the domain experts at MarketsandMarkets
- Studying various paid and unpaid sources of information, such as annual reports, press releases, white papers, Factiva, and databases
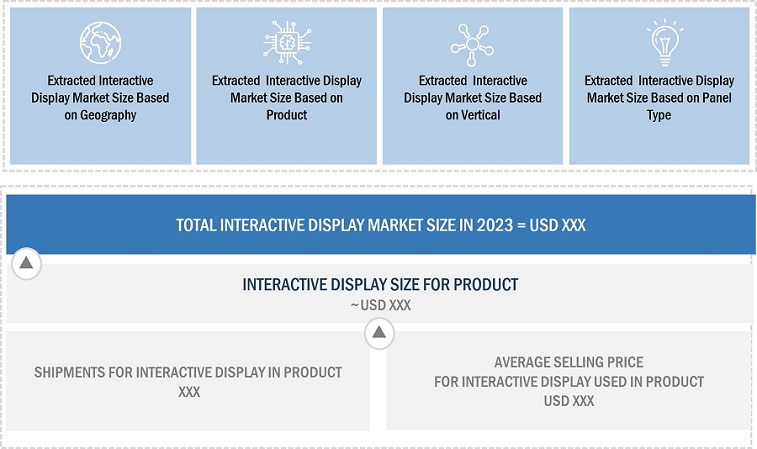
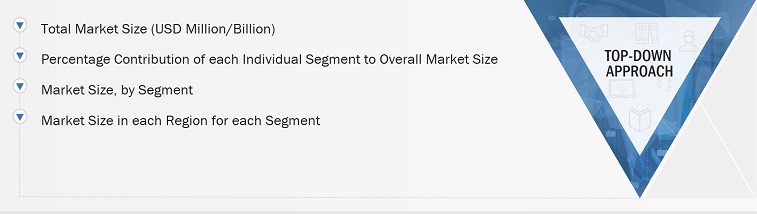
The top-down approach has been used to estimate and validate the total size of the interactive display market.
- Focusing initially on the investments and expenditures being made in the ecosystems of various applications
- Calculate the market size, considering revenues generated by major players through the cost of the interactive display.
- Segmenting each application of interactive display in each region and deriving the global market size based on region.
- Acquiring and analyzing information related to revenues generated by players through their key offerings.
- Conducting multiple on-field discussions with key opinion leaders involved in the development of various interactive display offerings.
- Estimating the geographic split using secondary sources based on various factors, such as the number of players in a specific country and region and the types of interactive display used in education, transportation, retail and hospitality, corporate and government, industrial, and healthcare.
Data Triangulation
After arriving at the overall size of the interactive display market through the process explained, the total market has been split into several segments and subsegments. Market breakdown and data triangulation procedures have been employed, wherever applicable, to complete the overall market engineering process and arrive at the exact statistics for all segments and subsegments. The data has been triangulated by studying various factors and trends from the demand and supply sides. The market has also been validated using the top-down and bottom-up approaches.
Market Definition
An interactive display is a display that can accept input using touch. It is designed to provide customers access to information such as wayfinding, self-check-in, product availability at a departmental store, patient details, and others. These displays have specially designed software applications for creating an interactive experience while delivering information based on the input received from end users. Thus, interactive displays act as dynamic information-sharing devices in sectors such as retail, transportation, healthcare, and educational institutes.
Key Stakeholders
- Raw material suppliers
- Original equipment manufacturers (OEMs)
- OEM technology providers
- Original design manufacturers (ODMs)
- Technology, service, and solution providers
- Suppliers and distributors
- Government and other regulatory bodies
- Forums, alliances, and associations
- Technology investors
- Research institutes and organizations
- Analysts and strategic business planners
- Market research and consulting firms
Report Objectives
- To define, describe, segment, and forecast the global interactive display market in terms of value on the basis of panel size, panel type, technology, vertical, and region
- To define, describe, segment, and forecast the global interactive display market in terms of value and volume based on product.
- To describe and forecast the market size, in terms of value, with respect to four major regions: North America, Europe, Asia Pacific (APAC), and the Rest of the World (RoW)
- To provide detailed information regarding the major factors influencing the growth of the market (drivers, restraints, opportunities, and challenges)
- To provide a detailed value chain for the interactive display industry and analyze the market trends
- To strategically analyze the micromarkets1 with respect to individual growth trends, prospects, and contributions to the total market
- To highlight the impact of Porter's five forces on the interactive display market ecosystem and analyze the underlying market opportunities
- To analyze the associated case studies in the interactive display market business and their impact on the business strategies adopted by key players
- To analyze the opportunities for stakeholders in the market and detail the competitive landscape of the market leaders
- To provide key industry trends and associated important regulations impacting the global interactive display market
- To strategically profile the key players and comprehensively analyze their market shares and core competencies
- To benchmark players within the market using the proprietary company evaluation matrix framework, which analyzes market players on various parameters within the broad categories of market rank and product offering
- To analyze the competitive strategies, such as contracts, joint ventures, and acquisitions, product launches and developments, and research and developments, adopted by the interactive display market players
- To map the competitive intelligence on the basis of company profiles, key player strategies, and game-changing developments, such as contracts, product launches, collaborations, and acquisitions.
Available customizations:
With the given market data, MarketsandMarkets offers customizations according to the specific requirements of companies. The following customization options are available for the report:
- Detailed analysis and profiling of additional market players based on various blocks of the supply chain
Get the Full Interactive Display Market Report
Full forecast, segment splits, and company analysis for all Interactive Display Market.
- US Interactive Display Market
- Canada Interactive Display Market
- Mexico Interactive Display Market
- Germany Interactive Display Market
- UK Interactive Display Market
- France Interactive Display Market
- China Interactive Display Market
- Japan Interactive Display Market
- India Interactive Display Market
- South Korea Interactive Display Market
- Rest Of Asia Pacific Interactive Display Market
- GCC Countries Interactive Display Market
Need a Tailored Report?
Customize this report to your needs
Get 10% FREE Customization
Customize This Report
