
Asia Pacific Microscopy Software Market (2026-2031)

The Asia Pacific Microscopy Software Market was valued at $117 Million in 2026 and projected to reach to $236 Million by 2031, representing a compound annual growth rate of 15.1%. The Asia Pacific microscopy software market is positioned for sustained growth through 2031, with the region's expanding healthcare investments and digital transformation initiatives creating substantial opportunities.


| Market Size in | USD 26.32 MN |
| Market Forecast in | |
| CAGR | |
| Forecast Period | |
| Units Considered | Value (USD MN) |
Asia Pacific Microscopy Software Market Trends and Insights
- Asia Pacific's accelerating adoption of digital pathology, AI-enabled diagnostic tools, and laboratory automation is driving this growth trajectory.
- The region's increasing healthcare investments, rising prevalence of chronic diseases, and modernization of research infrastructure are positioning Asia Pacific as a critical growth engine for microscopy software solutions. Asia Pacific's microscopy software market benefits from expanding pharmaceutical and biotechnology sectors across China, India, Japan, and South Korea.
- The region's growing emphasis on precision medicine and regulatory compliance in clinical diagnostics is spurring demand for advanced imaging and analysis platforms.
- Asia Pacific's competitive advantage in manufacturing and cost-effective innovation is attracting both regional and global vendors to establish localized solutions, further accelerating market penetration and technological advancement through 2031..
Key Market Statistics
- CAGR (2026-2031) 15.1% CAGR
- Market Size, 2026 ~USD 117 Million
- Forecast, 2031 ~USD 236 Million
- Geography Asia Pacific
Asia Pacific Microscopy Software Market Overview
Rapid Market Expansion :
Asia Pacific microscopy software market is growing at 15.1% CAGR, significantly outpacing the global rate of 11.5%, driven by increasing healthcare digitalization and laboratory modernization across the region.
Digital Pathology Adoption :
Rising adoption of digital pathology solutions in Asia Pacific is transforming diagnostic workflows, with hospitals and diagnostic centers investing heavily in AI-enabled microscopy software for improved accuracy and efficiency.
China & India Leadership :
China ($351.2M) and India ($157.1M) are the dominant markets in Asia Pacific, representing over 43% of the region's market value, fueled by expanding healthcare infrastructure and government initiatives in laboratory automation.
AI & Automation Integration :
Integration of artificial intelligence and laboratory automation technologies in microscopy software is accelerating across Asia Pacific, enabling faster diagnostics and reducing manual intervention in pathology workflows.
Asia Pacific Microscopy Software Market Dynamics
- Countries like China, India, Japan, and South Korea are leading adoption of advanced diagnostic technologies, supported by government healthcare policies and increasing prevalence of chronic diseases requiring sophisticated diagnostic capabilities. The market's 15.1% CAGR reflects strong demand for AI-integrated diagnostic tools, digital pathology platforms, and laboratory information systems across the region.
- Emerging economies in Asia Pacific are rapidly modernizing their healthcare infrastructure, while developed markets are upgrading existing systems with advanced analytics and automation features, ensuring robust market expansion through 2031..
Market Ecosystem
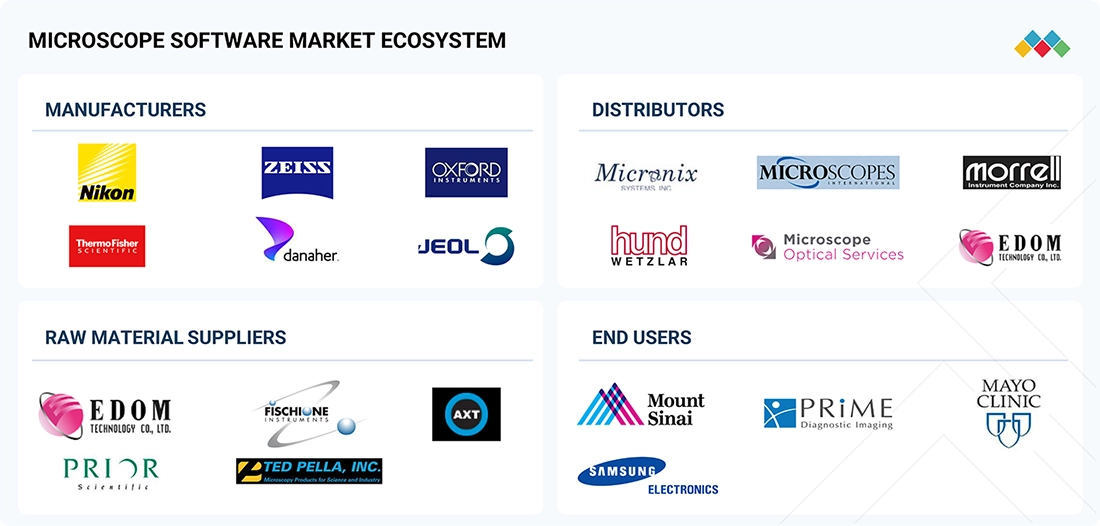
MICROSCOPE SOFTWARE MARKET: COMMERCIAL USE CASES ACROSS INDUSTRIES
| COMPANY | USE CASE DESCRIPTION | BENEFITS |
|---|---|---|
 |
Danaher through Leica offers “LAS X Life Science Microscope Software Platform”; the platform is built around a workflow-based interface intended to make users productive quickly, save experiment settings | It has played a key role in reducing the workflow complexity in research laboratories and life science users. |
 |
Macka EMAR Diagnostic Center (Istanbul): Upgrade to SIGNA Works with AIR Recon DL + Multi-Purpose Coils | It simplifies complex workflows, improves reproducibility, and supports faster analysis with more consistent results. |
 |
St. Joseph’s Hospital (Phoenix, Arizona): MRI in Neuro ED with fast protocols | MRI used in the Emergency Department to enable richer diagnosis (soft tissues, spinal cord) vs CT; scan times reduced to ~10 min in some protocols. |
 |
Entry into US market | First US installation of uMR 570 1.5T MRI | It improves workflow efficiency, supports reproducible experiments, and helps users switch between imaging applications with less complexity. |
Logos and trademarks shown above are the property of their respective owners. Their use here is for informational and illustrative purposes only.
Related Ecosystem
Analytical And Scientific Instrumentation
- Environmental Testing
- Gas Chromatography
- Polymerase Chain Reaction (PCR)
- Automated Liquid Handling Systems
- Flow Cytometry
- Thermo Fisher Scientific Inc.
- Danaher Corporation
- Agilent Technologies, Inc.
- Merck KGaA
- Shimadzu Corporation
Key Takeaways
- Asia Pacific microscopy software market will double from $117.0M (2026) to $236.0M (2031) at 15.1% CAGR, outpacing global growth.
- Asia Pacific's digital pathology and AI-driven diagnostic adoption is reshaping laboratory workflows across the region's healthcare systems.
- Asia Pacific's pharmaceutical and biotech expansion in China, India, and Japan is creating sustained demand for advanced microscopy software solutions.
- Asia Pacific's cost-effective innovation and manufacturing capabilities are attracting global vendors to develop region-specific microscopy software offerings.
Microscopy Software Market Report Scope
| Report Metric | Details |
|---|---|
| Base Year | 2026 |
| Fastest Growing Segment | CLOUD-NATIVE (Product Configuration) |
| Forecast Period | 2026-2031 |
| Growth Rate | CAGR of 11.5% from 2026 to 2031 |
| Largest Segment | ON-PREMISES (Product Configuration) |
| Market Size Base Year (Billions) | ~USD 1.79 (2026) |
| Revenue Forecast (Billions) | ~USD 3.09 (2031) |
| Segments Covered | End User, Modality, Type, Product Configuration |
Asia Pacific Microscopy Software Market Report Segmentation
4 segment dimensions are covered across the global market.
By End User
- Academic & Research Institutes
- Food & Beverage Companies
- Hospitals & Diagnostic Labs
- Industrial Manufacturers
- Other End Users
- Other Industries
- Pharma & Biotech Companies
- Semiconductor & Electronics Manufacturers
By Modality
- Atomic Force Microscopy
- Electron Microscopy
- Optical Microscopy
- Other Microscopy
- Raman Microscopy
By Type
- Confocal Microscopy
- Digital Microscopy
- Integrated Software
- Other Optical Microscopy
- Stand-Alone Software
By Product Configuration
- Cloud Native
- Cloud-Native
- Hybrid
- On-Premises
- On-Premises - Integrated
- On-Premises - Standalone
- Open Source
- Open-Source
Target Audience
- Healthcare Technology Vendors : Microscopy software providers and diagnostic equipment manufacturers need Asia Pacific market data to identify growth opportunities, assess competitive positioning, and develop region-specific product strategies.
- Hospital & Diagnostic Center Operators : Healthcare facility administrators require market insights to evaluate microscopy software solutions, benchmark against regional standards, and make informed technology investment decisions for laboratory modernization.
- Private Equity & Investment Firms : Investors targeting Asia Pacific healthcare technology need detailed market analysis to identify acquisition targets, assess growth potential, and evaluate investment returns in the rapidly expanding microscopy software sector.
- Government & Healthcare Policy Makers : Healthcare authorities and government agencies in Asia Pacific countries use market data to inform digital health initiatives, laboratory standards, and technology adoption policies supporting diagnostic infrastructure development.
- Research & Academic Institutions : Universities and research organizations in Asia Pacific require market intelligence to understand technology trends, identify collaboration opportunities, and align research initiatives with commercial microscopy software developments.
Countries within Asia Pacific - compare and drill down
| Country | 2025 size (native) |
|---|---|
| China | USD 351.2 Million |
| India | USD 157.1 Million |
| Japan | USD 217.5 Million |
| South Korea | USD 62.2 Million |
| Australia | USD 53.5 Million |
Country market size visualization
Reasons to Buy this Report
- Regional Market Insights : Gain detailed understanding of Asia Pacific's microscopy software market dynamics, including country-specific growth drivers, competitive landscapes, and emerging opportunities across China, India, Japan, and other key markets.
- Strategic Expansion Planning : Identify high-growth segments and underserved markets within Asia Pacific to prioritize expansion efforts, with data-driven insights on healthcare infrastructure development and digital transformation initiatives by country.
- Investment Decision Support : Access comprehensive market sizing and forecasts for Asia Pacific to support investment decisions, partnership strategies, and resource allocation across the region's fastest-growing healthcare technology markets.
- Competitive Positioning : Understand competitive dynamics specific to Asia Pacific, including local player strategies, technology adoption rates, and customer preferences to inform product development and go-to-market strategies.
- Regulatory & Market Trends : Stay informed on Asia Pacific-specific regulatory requirements, healthcare policies, and technology adoption trends that influence microscopy software demand and implementation across different country markets.
Frequently asked questions
What is the projected market size for microscopy software in Asia Pacific by 2031?
Asia Pacific's microscopy software market is projected to reach $236.0 million by 2031, growing from $117.0 million in 2026.
What is the CAGR for microscopy software in Asia Pacific?
Asia Pacific's microscopy software market is expected to grow at a compound annual growth rate of 15.1% between 2026 and 2031.
Which countries are driving microscopy software adoption in Asia Pacific?
China, India, Japan, and South Korea are leading microscopy software adoption in Asia Pacific, driven by expanding pharmaceutical, biotech, and healthcare sectors.
What are the primary growth drivers for microscopy software in Asia Pacific?
Asia Pacific's growth is driven by digital pathology adoption, AI-enabled diagnostics, laboratory automation, precision medicine initiatives, and increased healthcare investments.
How does Asia Pacific's microscopy software market compare to global growth?
Asia Pacific's 15.1% CAGR significantly exceeds the global CAGR of 11.5%, making the region a high-growth market for microscopy software vendors.
RESEARCH METHODOLOGY
This study balanced primary and secondary research for the microscopy software market by analyzing market variables that affect small, medium, and large businesses. The next step was to conduct primary research with industry experts across the value chain to validate findings, assumptions, and market sizing. Multiple methodologies, including top-down and bottom-up approaches, were used to estimate the overall market size. The study covers market segments, evolving trends, regulatory frameworks, and competitive dynamics. It examines leading market players and the strategies they employ in this sector. In conclusion, the total market size was estimated using a combination of top-down and bottom-up approaches, with data triangulation to finalize the estimate. Primary research was conducted throughout the study to validate and test each hypothesis.
Secondary Research
During the study, secondary research was conducted using a range of sources, including directories and databases such as Bloomberg Businessweek, D&B Hoovers, and Factiva. Additional materials included white papers, annual reports, SEC filings, and investor presentations. This approach was used to collect and analyze data that provide comprehensive, technical, and market-focused insights into the microscopy software market. The findings offer insights into key players and market segmentation, informed by recent industry trends and significant developments. A database of leading industry figures was also created as part of this secondary research.
Primary Research
Primary research involved activities to gather qualitative and quantitative data. A variety of individuals from the supply and demand sides were interviewed during this phase. On the supply side, key figures such as CEOs, vice presidents, directors of marketing and sales, directors of technology and innovation, and other important leaders were interviewed by industry experts. On the demand side, primary sources included academic institutions and research organizations. This research aimed to validate market segmentation, identify prominent market participants, and gain insights into significant industry trends and market dynamics through a real-world primary study.
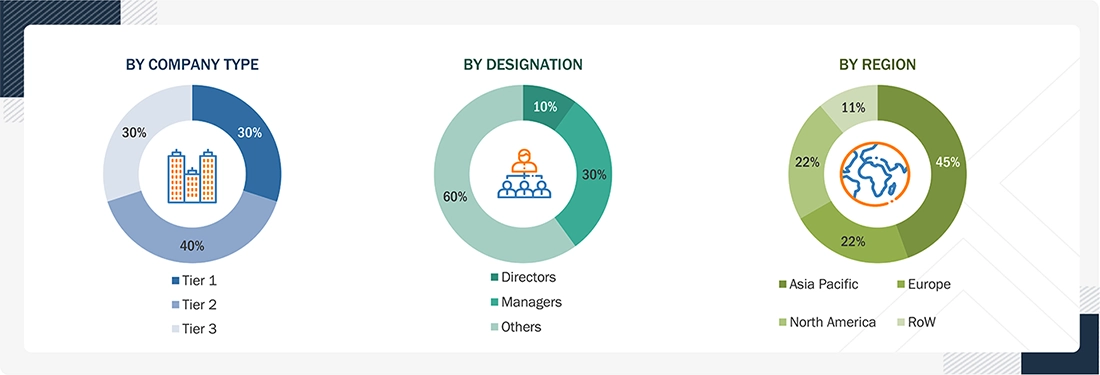
Notes:
- Others include distributors, suppliers, product managers, business development managers, marketing managers, and sales managers.
- Companies are categorized into tiers based on their total revenue. Here are the categories used:
As of 2025, Tier 1 = >USD 1,000 million, Tier 2 = USD 500–1,000 million, and Tier 3 = <USD 500 million.
To know about the assumptions considered for the study, download the pdf brochure
Market Size Estimation
This report analyzes the global microscopy software market size by reviewing the revenue shares of leading companies. Key players with significant market shares were identified through secondary research, and their microscopy software revenue was calculated and then validated through primary research. Secondary research included an analysis of annual and financial reports from leading market participants. Primary research involved in-depth interviews with key thought leaders, such as directors, CEOs, and marketing executives.
To calculate the global market value, segmental revenue was determined based on the revenue mapping of service and product providers. The process involved the following steps:
- Generating a list of key players that operate in the microscopy software market at regional or global levels
- Mapping the products of manufacturers of microscopy software and related product lines at the regional level
- Mapping the revenue of listed players through the sales of microscope software and related products
- Mapping the revenue of major players to cover at least ~90% of the global market share as of 2025
- Extrapolating the mapped revenue of players to arrive at the global market value for the respective segment
- Summing up the market value for all segments and subsegments to achieve the actual value of the global microscopy software market
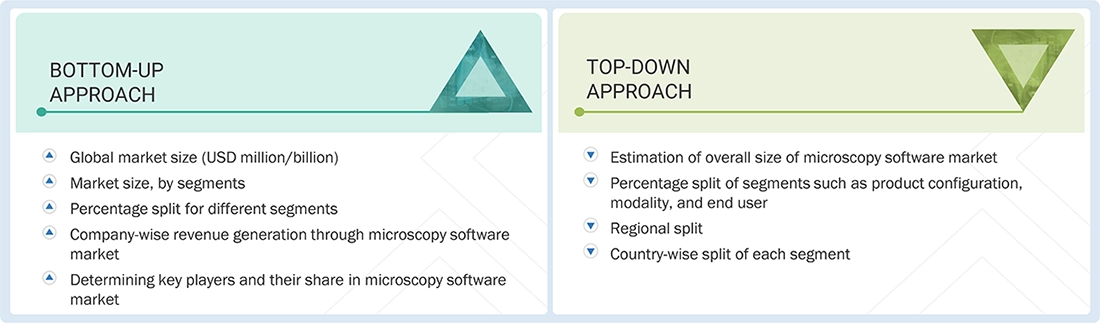
Data Triangulation
After estimating the overall market size, the microscopy software market was classified into subsegments. The overall market engineering process was finalized through data triangulation and market segmentation, yielding accurate statistics for all segments and subsegments. This triangulation involved analyzing trends and factors on both the demand and supply sides. Furthermore, the microscopy software market data was verified and validated using both top-down and bottom-up approaches.
Market Definition
Microscopy software is a digital solution that controls microscopes and processes, analyzes, stores, and presents images captured in microscopic imaging workflows. It enables scientists, researchers, clinicians, and industrial users to acquire images, adjust visualization parameters, perform quantitative analysis, create 3D reconstructions, and manage microscopy data through integrated or standalone platforms.
Key Stakeholders
- Academic and Research Institutes
- Regulatory Authorities and Industry Associations
- Hospitals
- Clinical Laboratories
- Pharmaceutical Companies
- Biotech Companies
- Automotive Companies
- Imaging Centers
- Manufacturers and Suppliers of Microscopes & Microscope Software
- Product Suppliers, Distributors, and Channel Partners
- Research Institutes
- Regulatory Authorities and Industry Associations
- Venture Capitalists and Investment Firms
- Research Labs
Report Objectives
- To define, describe, and forecast the size of the microscopy software market based on product configuration, modality, end user, and region
- To provide detailed information regarding the factors (drivers, restraints, opportunities, challenges, and trends) influencing the growth potential of the global microscopy software market
- To analyze micro markets with respect to individual growth trends, prospects, and contributions to the global microscopy software market
- To analyze key growth opportunities in the global microscopy software market for key stakeholders and provide details of the competitive landscape for market leaders
- To forecast the size of market segments and/or subsegments in five regions, namely, North America (US and Canada), Europe (Germany, France, the UK, Spain, Italy, and the Rest of Europe), Asia Pacific (Japan, China, India, Australia, South Korea, and the Rest of Asia Pacific), Latin America (Brazil, Mexico, and the Rest of Latin America), and the Middle East & Africa (GCC Countries and the Rest of the Middle East & Africa)
- To profile the key players in the microscopy software market and comprehensively analyze their market share and core competencies
- To analyze the competitive developments such as product launches/approvals, agreements, expansions, collaborations, and acquisitions undertaken in the global microscopy software market.
Available customizations:
With the given market data, MarketsandMarkets offers customizations based on your company’s specific needs. The following customization options are available for the present global microscopy software market report:
Product Analysis
- Product matrix, which gives a detailed comparison of the product portfolios of the top 15 companies
Company Information
- Detailed analysis and profiling of additional market players (up to 13)
Geographic Analysis
- Further breakdown of the Rest of Europe microscopy software market into Russia, Belgium, the Netherlands, Switzerland, Austria, Finland, Sweden, Poland, and Portugal
- Further breakdown of the Rest of Asia Pacific microscopy software market into Singapore, Taiwan, New Zealand, the Philippines, Malaysia, and other Asia Pacific countries
- Further breakdown of the Rest of Latin America microscopy software market into Argentina, Chile, Peru, and Colombia
Get the Full Microscopy Software Market Report
Full forecast, segment splits, and company analysis for all Microscopy Software Market.
- US Microscopy Software Market
- Canada Microscopy Software Market
- Germany Microscopy Software Market
- UK Microscopy Software Market
- France Microscopy Software Market
- Italy Microscopy Software Market
- Spain Microscopy Software Market
- Japan Microscopy Software Market
- China Microscopy Software Market
- India Microscopy Software Market
- Australia Microscopy Software Market
- South Korea Microscopy Software Market
- Brazil Microscopy Software Market
- Mexico Microscopy Software Market
- Rest Of Europe Microscopy Software Market
- Roapac Microscopy Software Market
- Rest Of Latin America Microscopy Software Market
- GCC Countries Microscopy Software Market
Need a Tailored Report?
Customize this report to your needs
Get 10% FREE Customization
Customize This Report
