
Asia Pacific Optical Transceiver Market (2024-2029)

The Asia Pacific Optical Transceiver Market was valued at $3100.2 Million in 2024 and projected to reach to $5473.7 Million by 2029, representing a compound annual growth rate of 12.0%. Asia Pacific's optical transceiver market is positioned for substantial growth, driven by massive investments in data center infrastructure and 5G deployment across the region.


| Market Size in | USD 26.32 MN |
| Market Forecast in | |
| CAGR | |
| Forecast Period | |
| Units Considered | Value (USD MN) |
Asia Pacific Optical Transceiver Market Trends and Insights
- Asia Pacific's market expansion is driven by accelerating data center investments, 5G infrastructure deployment, and rising demand for high-speed connectivity across the region.
- The 12.0% compound annual growth rate reflects Asia Pacific's critical role as a global technology hub, with countries including China, India, Japan, and South Korea leading digital transformation initiatives. Asia Pacific's optical transceiver market benefits from substantial telecommunications infrastructure upgrades and cloud computing adoption throughout the forecast period.
- The region's competitive manufacturing ecosystem and increasing fiber-optic network deployments position Asia Pacific as a key growth engine for the global optical transceiver industry.
- By 2029, Asia Pacific is expected to capture significant market share, supported by government initiatives promoting broadband expansion and enterprise digitalization across emerging and developed economies..
Key Market Statistics
- CAGR (2024-2029) 12.0% CAGR
- Market Size, 2024 ~USD 3100.2 Million
- Forecast, 2029 ~USD 5473.7 Million
- Geography Asia Pacific
Asia Pacific Optical Transceiver Market Overview
Rapid Data Center Expansion :
Asia Pacific's data center investments are accelerating, with major cloud providers expanding infrastructure across China, Japan, and Southeast Asia to support growing digital demand and AI workloads.
5G Infrastructure Deployment :
Widespread 5G rollout across Asia Pacific is driving demand for high-speed optical transceivers, with countries like China, South Korea, and Japan leading infrastructure modernization initiatives.
High-Speed Connectivity Demand :
Rising internet penetration and digital transformation initiatives across the region are creating sustained demand for advanced optical transceiver solutions to support bandwidth-intensive applications.
Strong Regional CAGR :
The Asia Pacific optical transceiver market is projected to grow at 12% CAGR from 2024 to 2029, reflecting the region's strategic importance in global semiconductor and connectivity markets.
Asia Pacific Optical Transceiver Market Dynamics
- China's dominance in manufacturing and digital infrastructure, combined with Japan and South Korea's technological leadership, creates a dynamic ecosystem for optical transceiver innovation and adoption.
- The region's expanding middle class and digital economy are fueling demand for reliable, high-speed connectivity solutions. Looking ahead, Asia Pacific will continue to be a critical growth engine for the global optical transceiver market.
- Government initiatives supporting digital transformation, coupled with private sector investments in cloud computing and telecommunications, will sustain the 12% CAGR through 2029.
- Emerging markets within Southeast Asia and India present additional growth opportunities as connectivity infrastructure expands..
Market Ecosystem
Related Ecosystem
Semiconductor Materials And Components
- Sensors
- Gallium Nitride (GaN)
- Digital Signal Processor (DSP)
- Natural Language Processing (NLP)
- Silicon Carbide
- Texas Instruments Incorporated
- Samsung
- APPLIED MATERIALS, INC.
- Stmicroelectronics
- Lenovo
Cns Systems
- C-Band
- Ka-Band
- Antennas
- Unmanned Ground Vehicles (UGV)
- Rotary Wing Aircraft
- L3Harris Technologies, Inc.
- Thales group
- HONEYWELL INTERNATIONAL INC.
- Northrop Grumman Corporation
- LOCKHEED MARTIN CORPORATION
Communication And Connectivity Technology
- Sensors
- Smart Card & Readers
- Cellular Network
- Femtocell
- Image Sensors
- Cisco Systems, Inc.
- HUAWEI TECHNOLOGIES CO LTD
- Lenovo
- CommScope Holding Company, Inc.
- Texas Instruments Incorporated
Key Takeaways
- Asia Pacific optical transceiver market grows from $3,100.2M (2024) to $5,473.7M (2029) at 12.0% CAGR
- Asia Pacific's 5G rollout and data center expansion drive sustained demand for high-speed optical interconnects
- Asia Pacific manufacturing capabilities and competitive pricing strengthen regional market competitiveness globally
- Asia Pacific government broadband initiatives and cloud adoption accelerate optical transceiver deployment through 2029
Optical Transceiver Market Report Scope
| Report Metric | Details |
|---|---|
| Base Year | 2024 |
| Fastest Growing Segment | 41 GBPS TO 100 GBPS (Data Rate) |
| Forecast Period | 2024-2029 |
| Growth Rate | CAGR of 13% from 2024 to 2029 |
| Largest Segment | LC (Connector) |
| Market Size Base Year (Billions) | ~USD 13.57 (2024) |
| Revenue Forecast (Billions) | ~USD 25 (2029) |
| Segments Covered | Form Factor, Wavelength, Data Rate, Fiber Type, Connector, Application, Distance, Protocol |
Asia Pacific Optical Transceiver Market Report Segmentation
8 segment dimensions are covered across the global market.
By Form Factor
- Cfp, Cfp2, Cfp4, And Cfp8
- Cxp
- Qsfp, Qsfp+, Qsfp-Dd, Qsfp28, And Qsfp56
- Sff And Sfp
- Sfp+ And Sfp28
- Xfp
By Wavelength
- 1310 Nm Band
- 1550 Nm Band
- 850 Nm Band
- Other Wavelengths
By Data Rate
- 10 Gbps To 40 Gbps
- 41 Gbps To 100 Gbps
- Less Than 10 Gbps
- More Than 100 Gbps
By Fiber Type
- Multimode Fiber
- Single Mode Fiber
- Single-Mode Fiber
By Connector
- Lc
- Mpo
- Rj-45
- Sc
By Application
- Data Center
- Data Centers
- Enterprise
- Enterprises
- Telecommunication
By Distance
- 1 To 10 Km
- 11 To 100 Km
- Less Than 1 Km
- More Than 100 Km
By Protocol
- Cwdm/Dwdm
- Ethernet
- Fiber Channel
- Fiber Channels
- Fttx
- Other Protocols
Target Audience
- Optical Transceiver Manufacturers : Manufacturers need Asia Pacific market intelligence to identify growth opportunities, optimize production capacity, and develop region-specific product variants for 5G and data center applications.
- Telecommunications Service Providers : Telecom operators across Asia Pacific require market data to plan network infrastructure investments, evaluate transceiver technology options, and forecast capital expenditure requirements for 5G deployment.
- Data Center Operators & Cloud Providers : Data center companies need regional market insights to understand optical transceiver demand trends, supplier capabilities, and technology roadmaps supporting their expansion across Asia Pacific.
- Semiconductor & Electronics Investors : Investment firms and venture capitalists need Asia Pacific market analysis to identify promising optical transceiver companies, assess market growth potential, and evaluate portfolio opportunities.
- Technology Consultants & System Integrators : Consultants advising on digital infrastructure projects need regional market data to recommend appropriate optical transceiver solutions and understand competitive positioning across Asia Pacific markets.
Countries within Asia Pacific - compare and drill down
| Country | 2025 size (native) |
|---|---|
| China | USD 4199.9 Million |
| Japan | USD 1751.9 Million |
| South Korea | USD 543.6 Million |
| Rest Of Asia Pacific | USD 1325.7 Million |
Country market size visualization
Reasons to Buy this Report
- Regional Market Sizing & Forecasts : Obtain precise market valuations for Asia Pacific (USD 3,100.2M in 2024) with country-level breakdowns for China, Japan, South Korea, and emerging markets to guide regional expansion strategies.
- 5G & Data Center Opportunity Analysis : Understand how 5G infrastructure deployment and accelerating data center investments across Asia Pacific are creating specific demand drivers and revenue opportunities for optical transceiver solutions.
- Competitive Landscape Intelligence : Identify key players and competitive dynamics specific to Asia Pacific, including regional manufacturers and global vendors establishing presence in high-growth markets like China and Southeast Asia.
- Country-Specific Market Insights : Access detailed analysis of individual Asia Pacific markets including China (USD 4,199.9M), Japan (USD 1,751.9M), and South Korea (USD 543.6M) to prioritize market entry and investment decisions.
- Growth Trajectory & Investment Planning : Leverage the 12% CAGR projection through 2029 to develop long-term business strategies, product roadmaps, and capital allocation plans aligned with Asia Pacific's rapid market expansion.
Frequently asked questions
What is the current size of the Asia Pacific optical transceiver market?
The Asia Pacific optical transceiver market was valued at USD 3,100.2 million in 2024 and is projected to reach USD 5,473.7 million by 2029.
What is the expected growth rate for Asia Pacific optical transceivers?
Asia Pacific's optical transceiver market is expected to grow at a compound annual growth rate (CAGR) of 12.0% from 2024 to 2029.
Which countries drive Asia Pacific's optical transceiver market growth?
China, India, Japan, and South Korea are primary growth drivers in Asia Pacific, supported by 5G infrastructure, data center investments, and digital transformation initiatives.
What factors are accelerating Asia Pacific optical transceiver demand?
Key drivers include 5G network deployment, cloud computing expansion, data center growth, government broadband initiatives, and enterprise digitalization across the region.
How does Asia Pacific compare to the global optical transceiver market?
Asia Pacific represents a significant portion of global demand with a 12.0% regional CAGR, positioning it as a critical growth engine alongside global market expansion.
RESEARCH METHODOLOGY
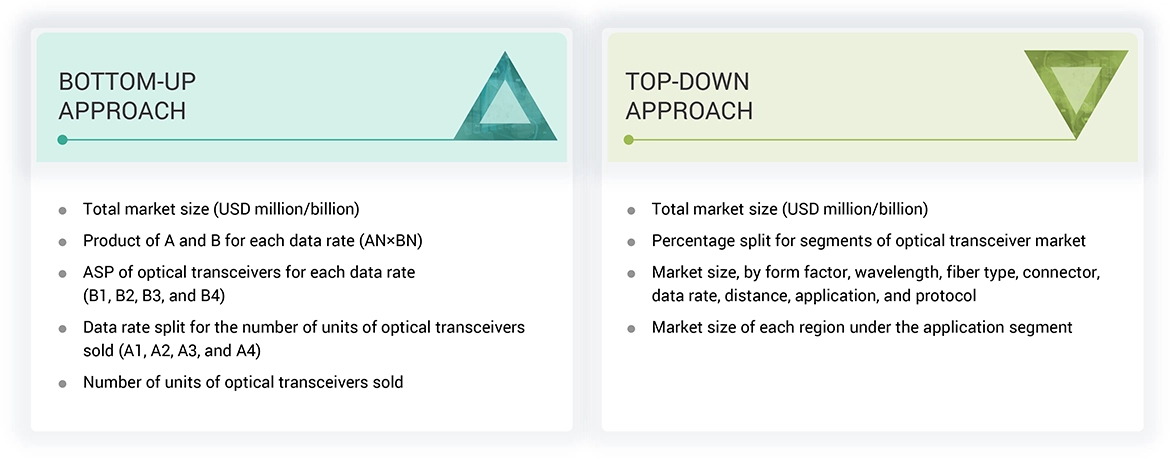
The study involved four major activities in estimating the size of the optical transceiver market. Exhaustive secondary research has been done to collect information on the market, peer market, and parent market. Validation of these findings, assumptions, and sizing with industry experts across the value chain through primary research has been the next step. Both top-down and bottom-up approaches have been employed to estimate the global market size. After that, market breakdown and data triangulation have been used to estimate the market sizes of segments and subsegments.
Secondary Research
Various secondary sources were used to identify and collect relevant information. These include corporate filings such as annual reports, press releases, investor presentations, and financial statements; trade, business, and professional associations; white papers, journals, and articles from recognized authors; certified publications related to optical transceiver; directories; and databases.
Secondary research was conducted to obtain key information about the supply chain of the industry, the monetary chain of the market, the total pool of key players, the segmentation of the market according to industry trends to the bottommost level, geographic markets, and key developments from the market-oriented perspective. Secondary data was collected and analyzed to arrive at the overall market size, which was further validated through primary research.
Primary Research
In the primary research process, various primary sources, from both supply and demand sides, were interviewed to obtain qualitative and quantitative information for this report. Primary sources from the supply side included experts such as chief executive officers (CEOs), vice presidents, marketing directors, technology and innovation directors, SMEs, consultants, and related key executives from the major companies and organizations operating in the optical transceiver market.
After the complete market engineering process (which includes market statistics calculations, market breakdown, market size estimations, market forecasting, and data triangulation), extensive primary research was conducted to gather information and verify and validate the critical market numbers.
Several primary interviews were conducted with experts from both the demand and supply sides across four major regions—North America, Europe, Asia Pacific, and RoW. Approximately 25% of the primary interviews were conducted with demand respondents and 75% with supply respondents. This primary data was collected through questionnaires, emails, and telephonic interviews.
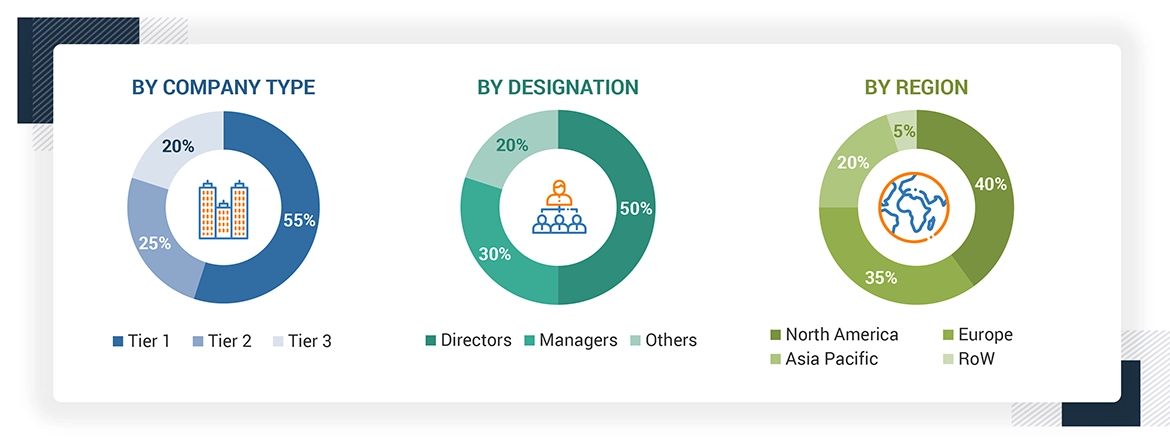
Note: “Others” includes sales, marketing, and product managers.
ROW includes the GCC, Rest of Middle East and Africa, and South America
About the assumptions considered for the study, To know download the pdf brochure
Market Size Estimation
Both top-down and bottom-up approaches have been used to estimate and validate the total size of the optical transceiver market. These methods have also been extensively used to estimate the sizes of various market subsegments. The research methodology used to estimate the market sizes includes the following:
Data Triangulation
After arriving at the overall market size from the estimation process explained above, the total market was split into several segments and subsegments. To complete the overall market engineering process and arrive at the exact statistics for all the segments and subsegments, data triangulation and market breakdown procedures were employed, wherever applicable. The data was triangulated by studying various factors and trends from both the demand and supply sides. The market has also been validated using both top-down and bottom-up approaches.
Market Definition
An optical transceiver is a device that uses fiber optical technology to send and receive data. This device comprises a transmitter and a receiver, which are combined and share common circuitry or a single housing. The transceiver is an important part of a fiber-optic network. It converts electrical signals to light signals to transmit data through an optical cable and vice versa. Manufacturers need to obtain ISO 9001 certifications to ensure that their optical transceivers are good quality.
Stakeholders
- Original equipment manufacturers (OEMs)
- Providers of technology solutions
- Research institutes
- Market research & consulting firms
- Forums, alliances, and associations related to optical transceivers
- Technology investors
- Governments & financial institutions
- Analysts & strategic business planners
- Existing end users and prospective ones
Research Objectives
- To describe and forecast the optical transceiver market, in terms of value, based on form factor, data rate, wavelength, fiber type, connector, distance, protocol, and application
- To describe and forecast the optical transceiver market, in terms of volume, based on data rate
- To describe and forecast the optical transceiver market size, in terms of value, with respect to four main regions: North America, Europe, Asia Pacific, and the Rest of the World (RoW)
- To provide detailed information regarding the drivers, restraints, opportunities, and challenges influencing the growth of the optical transceiver market
- To provide a detailed overview of the supply chain of the optical transceiver ecosystem
- To strategically analyze the micromarkets with respect to individual growth trends, prospects, and contributions to the overall market
- To analyze the opportunities in the market for various stakeholders by identifying the high-growth segments of the market
- To benchmark the market players using the proprietary company evaluation matrix framework, which analyzes market players on various parameters within the broad categories of market ranking/share and product portfolio
- To strategically profile the key players and comprehensively analyze their market positions in terms of ranking and core competencies, along with a detailed competitive landscape of the market
- To analyze competitive developments, such as acquisitions, product launches, partnerships, expansions, and collaborations, undertaken in the optical transceiver market
Get the Full Optical Transceiver Market Report
Full forecast, segment splits, and company analysis for all Optical Transceiver Market.
- US Optical Transceiver Market
- Canada Optical Transceiver Market
- Mexico Optical Transceiver Market
- Germany Optical Transceiver Market
- UK Optical Transceiver Market
- France Optical Transceiver Market
- Rest Of Europe Optical Transceiver Market
- China Optical Transceiver Market
- Japan Optical Transceiver Market
- South Korea Optical Transceiver Market
- Rest Of Asia Pacific Optical Transceiver Market
Need a Tailored Report?
Customize this report to your needs
Get 10% FREE Customization
Customize This Report
