
Asia Pacific Photonics Market (2025-2030)

The Asia Pacific Photonics Market was valued at $634500 Million in 2025 and projected to reach to $889080 Million by 2030, representing a compound annual growth rate of 7.0%. Asia Pacific's photonics market is positioned for exceptional growth, driven by the region's dominance in semiconductor manufacturing, telecommunications infrastructure, and consumer electronics production.


| Market Size in | USD 26.32 MN |
| Market Forecast in | |
| CAGR | |
| Forecast Period | |
| Units Considered | Value (USD MN) |
Asia Pacific Photonics Market Trends and Insights
- The region is projected to expand to $889.1 billion by 2030, driven by rapid industrialization, technological advancement, and increasing adoption of photonic solutions across telecommunications, semiconductors, and consumer electronics.
- Asia Pacific's growth trajectory outpaces the global average of 6.3% CAGR, reflecting the region's strategic importance in optical and photonic innovation. The photonics market in Asia Pacific is fueled by substantial investments in 5G infrastructure, quantum computing research, and advanced manufacturing capabilities.
- Asia Pacific's semiconductor and electronics industries leverage photonic technologies for enhanced performance and miniaturization, creating sustained demand across multiple end-use sectors.
- The region's competitive manufacturing ecosystem and emerging economies accelerate market penetration and application diversification throughout the forecast period..
Key Market Statistics
- CAGR (2025-2030) 7.0% CAGR
- Market Size, 2025 ~USD 634500 Million
- Forecast, 2030 ~USD 889080 Million
- Geography Asia Pacific
Asia Pacific Photonics Market Overview
Market Dominance :
Asia Pacific commands 47% of the global photonics market, with an estimated size of $634.5 billion in 2025, establishing it as the world's largest regional segment for photonic technologies and solutions.
Robust Growth Trajectory :
The region is projected to grow at a 7% CAGR through 2030, reaching $889.1 billion, outpacing the global average of 6.3% and reflecting accelerating demand across key verticals.
China's Leadership :
China alone represents $297.8 billion of the Asia Pacific market, driven by semiconductor manufacturing, 5G infrastructure deployment, and consumer electronics innovation across major industrial hubs.
Diversified Growth Drivers :
Rapid industrialization, telecommunications expansion, semiconductor advancement, and increasing adoption in consumer electronics and automotive sectors fuel sustained photonics demand across Asia Pacific economies.
Asia Pacific Photonics Market Dynamics
- China, Taiwan, Japan, and South Korea collectively represent over 70% of the regional market, leveraging advanced manufacturing capabilities and R&D investments.
- The 7% CAGR reflects strong demand from 5G deployment, data center expansion, and emerging applications in autonomous vehicles and industrial automation. Government initiatives supporting technology innovation, coupled with increasing foreign direct investment in photonics manufacturing, will accelerate market expansion.
- The region's supply chain integration and cost competitiveness position Asia Pacific as the global epicenter for photonics innovation and production through 2030, with particular momentum in optical communications, laser processing, and imaging technologies..
Market Ecosystem
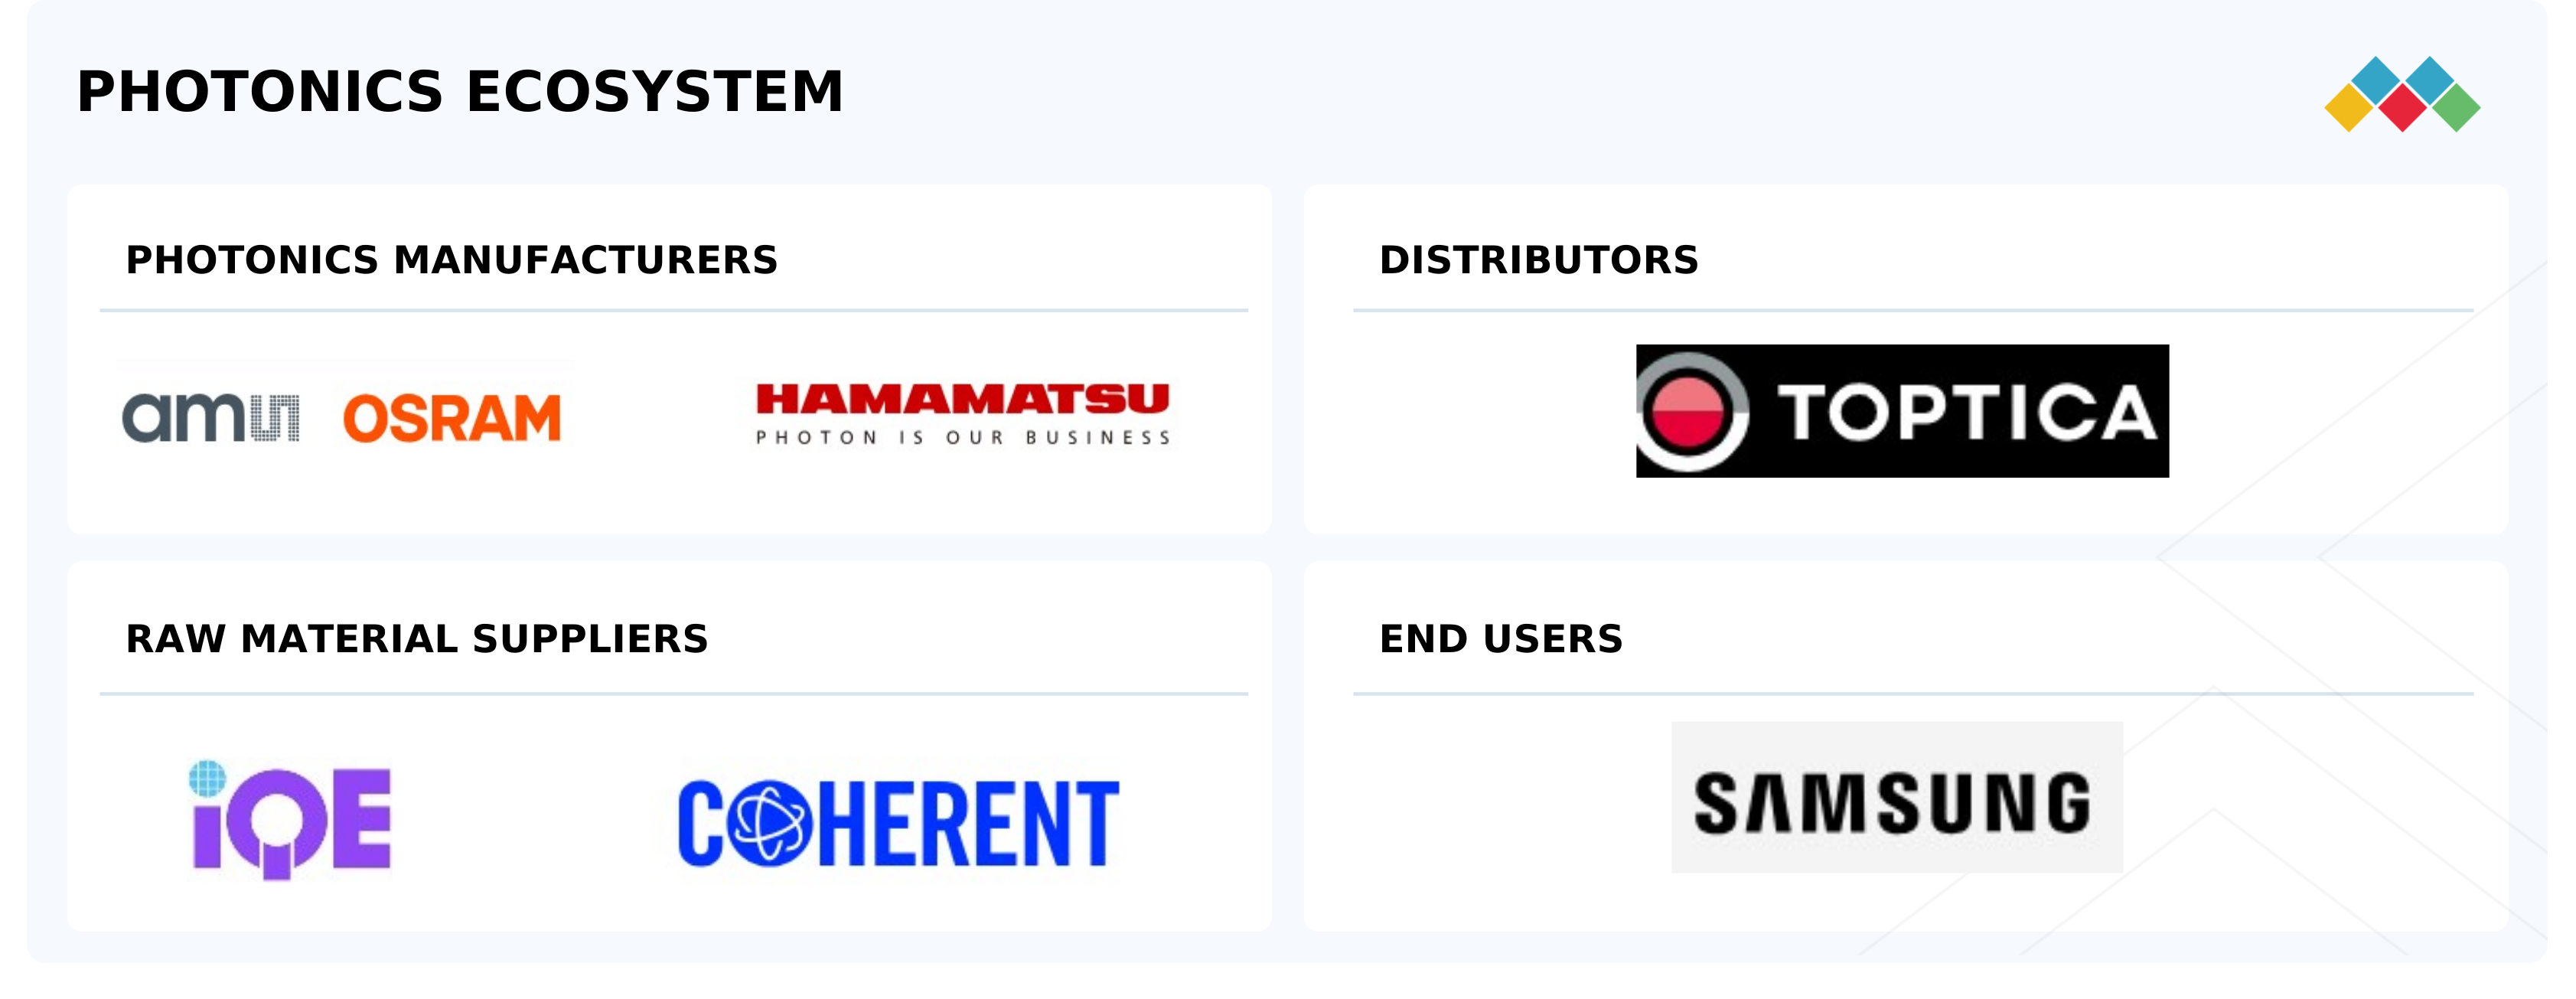
Photonics Market: COMMERCIAL USE CASES ACROSS INDUSTRIES
| COMPANY | USE CASE DESCRIPTION | BENEFITS |
|---|---|---|
 |
Development of optical fibers and cables for high-speed telecommunication networks | Enables faster internet connectivity, low signal loss, and supports growing demand from 5G and data centers |
 |
High-performance laser components for industrial cutting, welding, and medical surgery | Provides precision manufacturing, reduces defects, and improves efficiency in healthcare and automotive sectors |
 |
Advanced photonic components for displays and consumer electronics | Provides brighter displays, higher resolution, and energy-efficient performance for smartphones and TVs |
 |
Development of optoelectronic devices, light sources, and sensors for applications in medical imaging, spectroscopy, life sciences, and semiconductor inspection | Provides ultra-high sensitivity, precision detection, and reliable performance in critical industries such as healthcare and semiconductors, enabling advanced diagnostics, research, and high-quality manufacturing |
Logos and trademarks shown above are the property of their respective owners. Their use here is for informational and illustrative purposes only.
Related Ecosystem
Equipment Machine And Tooling
- Wastewater Treatment
- Air Cooled Heat Exchangers
- Diaphragm Pumps
- Fiberglass
- HVAC System
- Alfa Laval Corporate AB
- Veolia
- Johnson Controls International plc
- Daikin Industries,Ltd.
- Parker-Hannifin Corporation
Key Takeaways
- Asia Pacific photonics market valued at $634.5 billion in 2025, expanding to $889.1 billion by 2030 at 7.0% CAGR
- Asia Pacific outpaces global growth rate of 6.3%, driven by 5G deployment and semiconductor manufacturing expansion
- Telecommunications, semiconductors, and consumer electronics are primary growth drivers in Asia Pacific photonics adoption
- Asia Pacific's advanced manufacturing ecosystem and R&D investments position the region as the global photonics innovation hub
Photonics Market Report Scope
| Report Metric | Details |
|---|---|
| Base Year | 2025 |
| Fastest Growing Segment | INFORMATION & COMMUNICATION TECHNOLOGY (Application) |
| Forecast Period | 2025-2030 |
| Growth Rate | CAGR of 6.3% from 2025 to 2030 |
| Largest Segment | INFRARED (Wavelength) |
| Market Size Base Year (Billions) | ~USD 1091.75 (2025) |
| Revenue Forecast (Billions) | ~USD 1481.8 (2030) |
| Segments Covered | Product Type, Wavelength, Application, Material, End-Use Industry |
Asia Pacific Photonics Market Report Segmentation
5 segment dimensions are covered across the global market.
By Product Type
- Detectors, Sensors, & Imaging Devices
- Lasers And Laser Systems
- Light Sources
- Optical Communication & Networking
- Optical Components & Systems
- Optoelectronics/Integrated Photonic Circuits
- Optoelectronics/Integrated Photonics Circuits
By Wavelength
- Infrared
- Ultraviolet
- Visible
By Application
- Display
- Information & Communication Technology
- Lighting
- Measurement & Automated Vision
- Medical Technology & Life Science
- Other Applications
- Photovoltaics
By Material
- Gallium Arsenide
- Gallium Nitride
- Glass
- Indium Phosphide
- Lithium Niobate
- Other Materials
- Silicon
By End-Use Industry
- Construction
- Industrial
- Media & Telecommunication
- Medical
- Other End-Use Industries
- Security & Defense
Target Audience
- Photonics Manufacturers : Manufacturers need Asia Pacific market data to optimize production capacity, identify regional demand hotspots, and develop localized product strategies for semiconductors, lasers, and optical components.
- Technology Investors : Investors require detailed regional insights to evaluate growth potential, identify high-performing markets like China and Taiwan, and assess risk-adjusted returns in Asia Pacific photonics ventures.
- Telecommunications & Semiconductor Companies : Telecom and semiconductor firms need Asia Pacific forecasts to plan 5G infrastructure investments, optical network expansion, and supply chain optimization across the region's manufacturing centers.
- Strategic Consultants : Consultants leverage regional market data to advise clients on market entry strategies, competitive positioning, and growth opportunities specific to Asia Pacific's photonics landscape.
- Government & Policy Makers : Policymakers use market intelligence to inform technology roadmaps, R&D funding priorities, and industrial policies that support photonics innovation and competitiveness in Asia Pacific.
Countries within Asia Pacific - compare and drill down
| Country | 2025 size (native) |
|---|---|
| China | USD 297840 Million |
| Japan | USD 94240 Million |
| India | USD 55390 Million |
| South Korea | USD 72900 Million |
| Taiwan | USD 136920 Million |
| Rest Of Asia Pacific | USD 231780 Million |
Country market size visualization
Reasons to Buy this Report
- Regional Market Dominance Data : Gain comprehensive insights into Asia Pacific's 47% global market share with detailed breakdowns by country, enabling strategic positioning in the world's largest photonics region.
- Country-Level Intelligence : Access granular market data for China ($297.8B), Taiwan ($136.9B), Japan ($94.2B), and South Korea ($72.9B) to identify high-growth opportunities and competitive landscapes within key markets.
- Growth Trajectory Analysis : Understand the 7% CAGR growth drivers specific to Asia Pacific, including 5G deployment, semiconductor expansion, and industrial automation trends through 2030.
- Investment & Expansion Planning : Leverage regional forecasts and market dynamics to inform capital allocation, facility location decisions, and partnership strategies across Asia Pacific's photonics ecosystem.
- Competitive Benchmarking : Compare market performance across Asia Pacific countries to identify emerging competitors, technology leaders, and untapped segments for market entry or product development.
Frequently asked questions
What is the current size of the Asia Pacific photonics market?
The Asia Pacific photonics market is estimated at $634.5 billion in 2025, making it the largest regional market globally.
What is the projected market size for Asia Pacific photonics by 2030?
Asia Pacific photonics market is forecasted to reach $889.1 billion by 2030, representing significant expansion over the five-year period.
How does Asia Pacific photonics growth compare to global trends?
Asia Pacific grows at 7.0% CAGR, outpacing the global photonics market CAGR of 6.3%, reflecting the region's accelerated adoption and innovation.
Which industries drive photonics demand in Asia Pacific?
Telecommunications, semiconductors, consumer electronics, and advanced manufacturing are the primary sectors driving photonics adoption in Asia Pacific.
What factors support Asia Pacific photonics market expansion?
5G infrastructure investments, quantum computing research, semiconductor manufacturing growth, and emerging economy industrialization fuel Asia Pacific photonics market expansion.
RESEARCH METHODOLOGY
The study involved four major activities in estimating the market size of the photonics market. Exhaustive secondary research was done to collect information on the market, the peer market, and the parent market. The next step was to validate these findings, assumptions, and sizing with industry experts across the value chain through primary research. Both top-down and bottom-up approaches were employed to estimate the complete market size. Thereafter, the market breakdown and data triangulation procedures were used to estimate the market size of the segments and subsegments.
Secondary Research
In the secondary research process, various secondary sources have been referred to for identifying and collecting information for this study. These secondary sources include annual reports, press releases, investor presentations of companies, white papers, certified publications, trade directories, certified publications, articles from recognized authors, gold standard and silver standard websites, and databases.
Secondary research has been used to obtain key information about the value chain of the industry, monetary chain of the market, the total pool of classification and segmentation according to industry trends to the bottom-most level, and regional markets. It was also used to obtain information about the key developments from a market-oriented perspective.
Primary Research
The photonics market comprises several stakeholders in the value chain, which include raw material suppliers, manufacturers, and end users. Various primary sources from the supply and demand sides of the photonics market have been interviewed to obtain qualitative and quantitative information. The primary interviewees from the demand side include key opinion leaders in end-use sectors. The primary sources from the supply side include manufacturers, associations, and institutions involved in the photonics market industry.
Primary interviews were conducted to gather insights such as market statistics, data of revenue collected from the products and services, market breakdowns, market size estimations, market forecasting, and data triangulation. Primary research also helped in understanding the various trends related to chemistry, application, and region. Stakeholders from the demand side, such as CIOs, CTOs, and CSOs were interviewed to understand the buyer’s perspective on the suppliers, products, component providers, and their current usage of the photonics market and future outlook of their business, which will affect the overall market.
The breakdown of profiles of the primary interviewees is illustrated in the figure below:
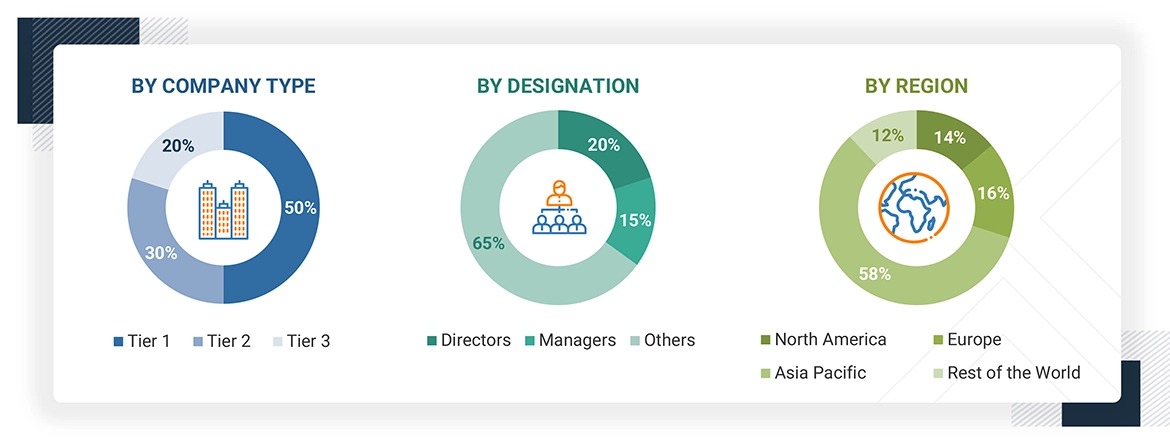
Note: Tier 1, Tier 2, and Tier 3 companies are classified based on their market revenue in 2024 available in the public domain, product portfolios, and geographical presence.
Other designations include sales representatives, production heads, and technicians.
To know about the assumptions considered for the study, download the pdf brochure
Market Size Estimation
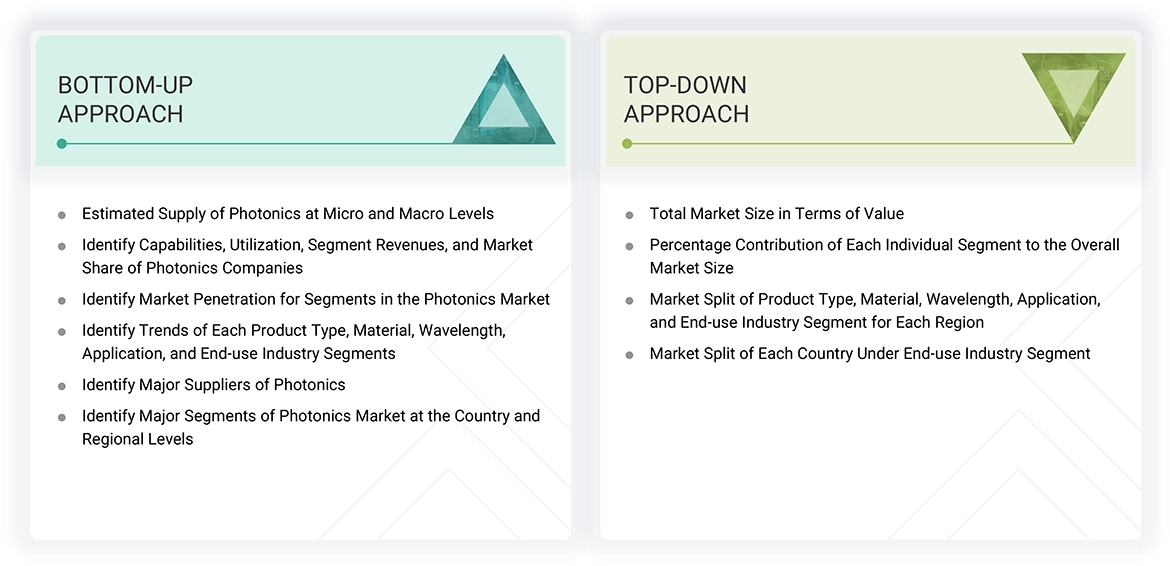
The top-down approach was used to estimate and validate the size of various submarkets for the photonics market. The research methodology used to estimate the market size included the following steps:
- The key players in the industry have been identified through extensive secondary research.
- The supply chain of the industry has been determined through primary and secondary research.
- All percentage shares, splits, and breakdowns based on product type, material, wavelength, application, and end-use industry, and region were determined using secondary sources and verified through primary sources.
- All possible parameters that affect the markets covered in this research study were accounted for, viewed in extensive detail, verified through primary research, and analyzed to get the final quantitative and qualitative data. This data was consolidated and added with detailed inputs and analysis and presented in this report.
Data Triangulation
After arriving at the total market size from the estimation process above, the overall market has been split into several segments and subsegments. To complete the overall market engineering process and arrive at the exact statistics for all the segments and subsegments, the data triangulation and market breakdown procedures have been employed, wherever applicable. The data has been triangulated by studying various factors and trends from both the demand and supply sides. Along with this, the market size has been validated by using both the top-down and bottom-up approaches and primary interviews. Hence, for every data segment, there have been three sources—top-down approach, bottom-up approach, and expert interviews. The data was assumed correct when the values arrived from the three sources matched.
Market Definition
Photonics is the science and technology of generating, controlling, and detecting photons (particles of light) within the electromagnetic spectrum (from ultraviolet to visible to infrared wavelengths). The photonics market includes all types of components, systems, and technologies that use light (photons) for functional applications across a number of industries, including telecommunications, healthcare, manufacturing, defense, and consumer electronics. The raw components of photonics include light sources, such as light-emitting diodes (LEDs) and lasers, optical fibers, lenses, modulators, sensors and detectors, and imaging systems, each working in precise and interconnected patterns to manipulate light or photons. Photonics technologies typically arise out of advanced material science or semiconductor fabrication. Photonic chips, optical components, or laser diodes are produced from materials such as silicon, glass, gallium arsenide, and lithium niobate. “Fabricating” these in cleanroom facilities, allows the manufacturing of precision components and devices using methods similar to those used in microelectronics (e.g., lithography, deposition, doping and etching). Optical fibers, for example, are produced by drawing purified silica glass into extremely thin strands that transmit light over fantastic distances with minimal loses, enabling global internet and communications.
Stakeholders
- Photonics Manufacturers
- Photonics Traders, Distributors, and Suppliers
- Raw Type Suppliers
- Government and Private Research Organizations
- Associations and Industrial Bodies
- R&D Institutions
- Environmental Support Agencies
Report Objectives
- To define, describe, and forecast the size of the photonics market in terms of value and volume
- To provide detailed information regarding the major factors (drivers, opportunities, restraints, and challenges) influencing the growth of the market
- To estimate and forecast the market size based on product type, material, wavelength, application, end-use industry, and region
- To forecast the size of the market with respect to major regions, namely, North America, Europe, the Middle East & Africa, and South America, along with their key countries
- To strategically analyze micromarkets with respect to individual growth trends, prospects, and their contribution to the overall market
- To analyze opportunities in the market for stakeholders and provide a competitive landscape of market leaders
- To track and analyze recent development such as partnerships, agreements, joint ventures, collaborations, awards, and expansions in the market
- To strategically profile the key market players and comprehensively analyze their core competencies
Get the Full Photonics Market Report
Full forecast, segment splits, and company analysis for all Photonics Market.
- China Photonics Market
- Japan Photonics Market
- India Photonics Market
- South Korea Photonics Market
- Taiwan Photonics Market
- Canada Photonics Market
- Mexico Photonics Market
- US Photonics Market
- Germany Photonics Market
- Italy Photonics Market
- France Photonics Market
- UK Photonics Market
- Netherlands Photonics Market
- Saudi Arabia Photonics Market
- UAE Photonics Market
- Egypt Photonics Market
- South Africa Photonics Market
- Oman Photonics Market
- Rest Of Europe Photonics Market
- Rest Of Asia Pacific Photonics Market
- Others In Row Photonics Market
Need a Tailored Report?
Customize this report to your needs
Get 10% FREE Customization
Customize This Report
