
North America Pressure Sensor Market (2025-2030)

The North America Pressure Sensor Market was valued at $3372 Million in 2025 and projected to reach to $4586.6 Million by 2030, representing a compound annual growth rate of 6.3%. The North America pressure sensor market is positioned for steady growth through 2030, driven by technological advancements in IoT-enabled sensors and increasing automation across industrial sectors.


| Market Size in | USD 26.32 MN |
| Market Forecast in | |
| CAGR | |
| Forecast Period | |
| Units Considered | Value (USD MN) |
North America Pressure Sensor Market Trends and Insights
- North America maintains a significant share of the global pressure sensor market, driven by robust demand across automotive, industrial, and healthcare sectors.
- The region's advanced manufacturing infrastructure and high adoption of IoT and automation technologies position North America as a key growth engine for pressure sensor innovation and deployment. In North America, the pressure sensor market benefits from strong regulatory frameworks, substantial R&D investments, and the presence of leading semiconductor and electronics manufacturers.
- Between 2025 and 2030, North America is expected to experience steady expansion as industries increasingly integrate pressure sensing solutions into smart devices, connected systems, and real-time monitoring applications.
- The region's focus on Industry 4.0 and digital transformation initiatives further accelerates demand for precision pressure measurement technologies across North America..
Key Market Statistics
- CAGR (2025-2030) 6.3% CAGR
- Market Size, 2025 ~USD 3372 Million
- Forecast, 2030 ~USD 4586.6 Million
- Geography North America
North America Pressure Sensor Market Overview
Market Leadership Position :
North America commands a substantial share of the global pressure sensor market, with the US alone representing $3,584.1 million in 2025, establishing the region as a critical hub for sensor technology and innovation.
Automotive Sector Dominance :
The North American automotive industry drives significant pressure sensor demand through advanced vehicle systems, emission controls, and autonomous vehicle development, supported by major OEM manufacturing facilities across the region.
Industrial Manufacturing Strength :
Robust industrial infrastructure in North America, particularly in the US and Canada, fuels adoption of pressure sensors across manufacturing, oil & gas, and process control applications with high precision requirements.
Healthcare & Medical Device Growth :
North America's advanced healthcare sector and medical device manufacturing ecosystem create sustained demand for pressure sensors in diagnostic equipment, patient monitoring systems, and surgical applications.
North America Pressure Sensor Market Dynamics
- The region's mature automotive market continues to adopt advanced pressure sensing solutions for vehicle safety, efficiency, and electrification initiatives.
- Investment in smart manufacturing and Industry 4.0 adoption accelerates sensor integration across production facilities. Canada and Mexico contribute meaningfully to the regional market, with Canada's advanced manufacturing base and Mexico's growing automotive production supporting market expansion.
- Healthcare sector modernization and regulatory compliance requirements further bolster demand.
- The 6.3% CAGR reflects North America's transition toward intelligent sensor systems and predictive maintenance solutions, positioning the region as a premium market for high-performance pressure sensing technologies..
Market Ecosystem
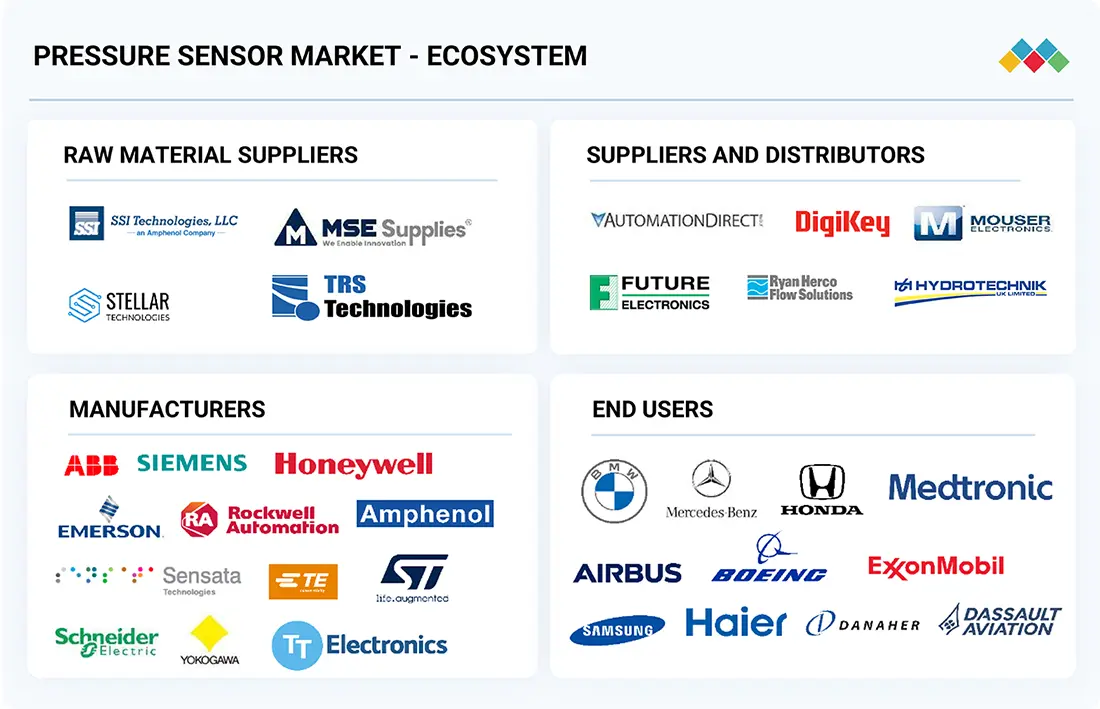
Pressure Sensor Market: COMMERCIAL USE CASES ACROSS INDUSTRIES
| COMPANY | USE CASE DESCRIPTION | BENEFITS |
|---|---|---|
 |
Pressure sensors integrated in automotive engine management and safety systems | Optimized fuel efficiency, reduced emissions, enhanced vehicle safety |
 |
Industrial pressure sensors for oil & gas and process control applications | Real-time monitoring, improved operational safety, minimized downtime |
 |
MEMS-based miniature pressure sensors for medical devices such as ventilators and wearables | Accurate patient monitoring, compact design, reliable long-term performance |
 |
Automotive pressure sensors for braking, engine, and tire pressure monitoring systems | Improved vehicle safety, compliance with emission standards, enhanced fuel efficiency, extended tire life |
 |
Industrial pressure sensors for oil & gas, chemical, and power generation sectors | Increased process reliability, real-time monitoring, reduced downtime, improved safety in hazardous environments |
Logos and trademarks shown above are the property of their respective owners. Their use here is for informational and illustrative purposes only.
Related Ecosystem
Cns Systems
- C-Band
- Ka-Band
- Antennas
- Unmanned Ground Vehicles (UGV)
- Rotary Wing Aircraft
- L3Harris Technologies, Inc.
- Thales group
- HONEYWELL INTERNATIONAL INC.
- Northrop Grumman Corporation
- LOCKHEED MARTIN CORPORATION
Industrial Automation
- Sensors
- Image Sensors
- Manufacturing Execution System (MES)
- Actuators
- Flow Sensors
- ABB India Limited
- Siemens ag
- Emerson Electric Co.
- HONEYWELL INTERNATIONAL INC.
- SCHNEIDER ELECTRIC SE
Sensors And Control
- Sensors
- Image Sensors
- Temperature Sensors
- Pressure Sensors
- Flow Sensors
- BAUMER ELECTRIC AG
- HONEYWELL INTERNATIONAL INC.
- Lenovo
- Stmicroelectronics
- Texas Instruments Incorporated
Key Takeaways
- North America's pressure sensor market will grow from $3,372.0M (2025) to $4,586.6M (2030) at a 6.3% CAGR.
- North America leads in automotive and industrial pressure sensor adoption, supported by advanced manufacturing ecosystems.
- Strong regulatory compliance and IoT integration drive sustained demand for pressure sensors across North America.
- North America's focus on Industry 4.0 and smart manufacturing accelerates pressure sensor market expansion through 2030.
Pressure Sensor Market Report Scope
| Report Metric | Details |
|---|---|
| Base Year | 2025 |
| Fastest Growing Segment | MEDICAL (End Use) |
| Forecast Period | 2025-2030 |
| Growth Rate | CAGR of 6.2% from 2025 to 2030 |
| Largest Segment | WIRED (Connectivity) |
| Market Size Base Year (Billions) | ~USD 13.1 (2025) |
| Revenue Forecast (Billions) | ~USD 17.7 (2030) |
| Segments Covered | Connectivity, Sensing Method, End Use, Sensor Type, Pressure Range |
North America Pressure Sensor Market Report Segmentation
5 segment dimensions are covered across the global market.
By Connectivity
- Wired
- Wireless
By Sensing Method
- Capacitive
- Electromagnetic
- Optical
- Other Sensing Methods
- Piezoresistive
- Resonant Solid-State
By End Use
- Automotive
- Aviation
- Consumer Devices
- Manufacturing
- Marine
- Medical
- Oil & Gas
- Other End Uses
- Utilities
By Sensor Type
- Absolute Pressure Sensors
- Differential Pressure Sensors
- Gauge Pressure Sensors
- Sealed Pressure Sensors
- Vacuum Pressure Sensors
By Pressure Range
- 101-1,000 Psi
- Above 1,000 Psi
- Up To 100 Psi
Target Audience
- Automotive OEMs & Suppliers : Require detailed North American market data to optimize sensor sourcing strategies, support vehicle platform development, and align with regional emission and safety standards.
- Industrial Equipment Manufacturers : Need market insights to identify pressure sensor integration opportunities across manufacturing equipment, process control systems, and predictive maintenance solutions for North American customers.
- Sensor Technology Companies : Utilize regional market analysis to guide R&D investments, product positioning, and go-to-market strategies tailored to North American customer requirements and competitive dynamics.
- Healthcare & Medical Device Firms : Leverage market data to assess pressure sensor demand in diagnostic equipment, patient monitoring, and surgical applications within North America's regulated healthcare environment.
- Private Equity & Investment Firms : Use comprehensive regional forecasts and opportunity analysis to identify acquisition targets, assess portfolio company growth potential, and evaluate sector consolidation trends in North America.
Countries within North America - compare and drill down
| Country | 2025 size (native) |
|---|---|
| US | USD 3584.1 Million |
| Canada | USD 535.7 Million |
| Mexico | USD 466.9 Million |
Country market size visualization
Reasons to Buy this Report
- Regional Market Segmentation : Gain detailed insights into US, Canadian, and Mexican pressure sensor markets with country-specific sizing, growth trajectories, and sector-level breakdowns to inform localized business strategies.
- Competitive Landscape Analysis : Understand North American competitive dynamics, key players, market consolidation trends, and technology differentiation strategies specific to the region's automotive, industrial, and healthcare verticals.
- Sector-Specific Demand Drivers : Identify growth catalysts across automotive electrification, industrial IoT adoption, and medical device innovation unique to North America's regulatory environment and manufacturing capabilities.
- Investment & Expansion Opportunities : Evaluate market entry points, acquisition targets, and partnership opportunities across North America with data-driven insights on high-growth segments and underserved applications.
- Forecast Accuracy & Reliability : Access validated 2025-2030 projections with transparent methodology, enabling confident capital allocation and strategic planning for North American market participants and investors.
Frequently asked questions
What is the current size of the North America pressure sensor market?
The North America pressure sensor market is valued at $3,372.0 million in 2025.
What is the projected market size for North America pressure sensors by 2030?
The North America pressure sensor market is forecast to reach $4,586.6 million by 2030.
What is the CAGR for the North America pressure sensor market?
The North America pressure sensor market is expected to grow at a CAGR of 6.3% from 2025 to 2030.
Which industries drive demand for pressure sensors in North America?
North America's pressure sensor demand is primarily driven by automotive, industrial manufacturing, healthcare, and IoT applications.
Why is North America a key market for pressure sensors?
North America benefits from advanced manufacturing infrastructure, strong regulatory frameworks, significant R&D investments, and high IoT adoption rates that drive pressure sensor demand.
RESEARCH METHODOLOGY
The research process for this study included systematic gathering, recording, and analysis of data about customers and companies operating in the pressure sensor market. This process involved the extensive use of secondary sources, directories, and databases (Factiva and Oanda) to identify and collect valuable information for the comprehensive, technical, market-oriented, and commercial study of the Pressure sensor market.
In-depth interviews were conducted with primary respondents, including experts from core and related industries and preferred manufacturers, to obtain and verify critical qualitative and quantitative information and assess growth prospects. Key players in the pressure sensor market were identified through secondary research, and their market rankings were determined through primary and secondary research. This research included studying annual reports of top players and interviewing key industry experts, such as CEOs, directors, and marketing executives.
Secondary Research
Various sources were used in the secondary research process to identify and collect information crucial for this study. These include company annual reports, press releases, investor presentations, white papers, technology journals, certified publications, articles by recognized authors, directories, and databases. Secondary research was mainly used to obtain key information about the industry’s value chain, the total pool of market players, the market classification according to industry trends to the bottom-most level, regional markets, and key developments from market and technology-oriented perspectives.
Primary Research
Primary research was also conducted to identify the segmentation types, key players, competitive landscape, and key market dynamics, such as drivers, restraints, opportunities, challenges, and industry trends, along with key strategies adopted by players operating in the pressure sensor market. Extensive qualitative and quantitative analyses were performed on the complete market engineering process to list key information and insights throughout the report.
Extensive primary research has been conducted after acquiring knowledge about the pressure sensor market scenarios through secondary research. Several primary interviews have been conducted with experts from the demand (application and region) and supply side (solution type) across four major geographic regions: North America, Europe, Asia Pacific, and RoW. Approximately 60% and 40% of the primary interviews were conducted from the supply and demand sides. These primary data have been collected through questionnaires, emails, and telephonic interviews.
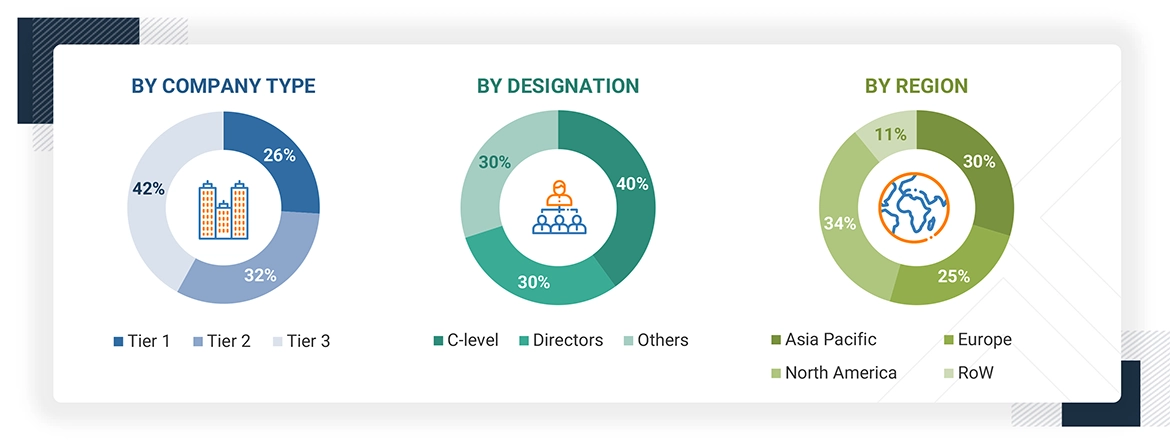
Note: The three tiers of the companies have been defined based on their total/segmental revenue as of 2024: Tier 1 = >USD 1 billion, Tier 2 = USD 1 billion–USD 500 million, and Tier 3 = USD 500 million. ‘Others’ include sales, marketing, and product managers.
To know about the assumptions considered for the study, download the pdf brochure
Market Size Estimation
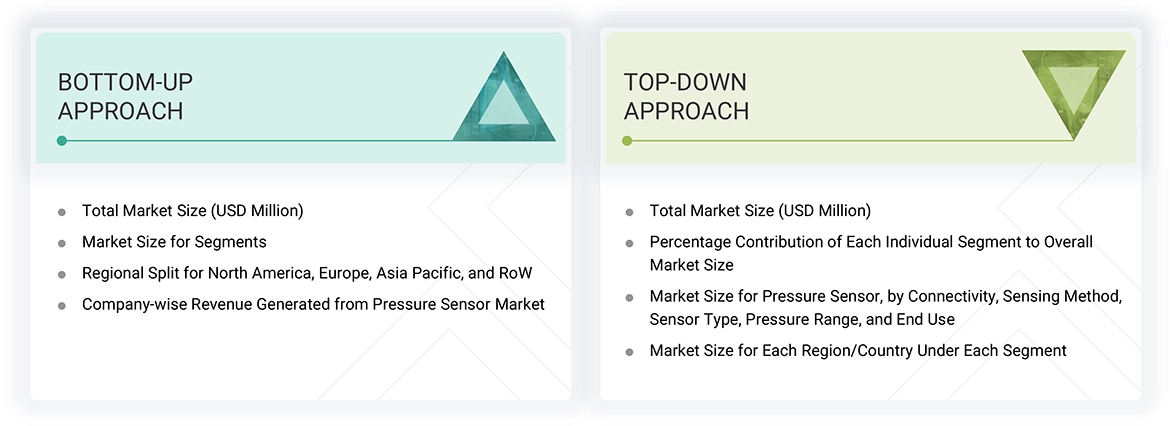
In the complete market engineering process, the top-down and bottom-up approaches and several data triangulation methods were implemented to estimate and validate the size of the pressure sensor market and various other dependent submarkets. Key players in the market were identified through secondary research, and their market share in the respective regions was determined through primary and secondary research. This entire research methodology included the study of annual and financial reports of the top players and interviews with experts (CEOs, VPs, directors, and marketing executives) for key insights (quantitative and qualitative).
All percentage shares, splits, and breakdowns were determined using secondary sources and verified through primary sources. All the possible parameters that affect the markets covered in this research study were accounted for, viewed in detail, verified through primary research, and analyzed to obtain the final quantitative and qualitative data. This data was consolidated and supplemented with detailed inputs and analysis from MarketsandMarkets and presented in this report.
Pressure Sensor Market : Top-Down and Bottom-Up Approach
Data Triangulation
After arriving at the overall market size from the market size estimation process, as explained above, the total market has been split into several segments and subsegments. To complete the overall market engineering process and arrive at the exact statistics for all segments and subsegments, market breakdown and data triangulation procedures have been employed, wherever applicable. The data have been triangulated by studying various factors and trends from the demand and supply sides. Along with this, the market has been validated using top-down and bottom-up approaches.
Market Definition
A sensor is a device that measures the changes in physical quantities or environmental characteristics of any material and converts them into signals, which, in turn, serve as inputs for controlling different kinds of systems. A pressure sensor is a transducer or instrument that converts an input mechanical pressure in gases or liquids into an electrical output signal. It consists of a pressure-sensitive element that can measure, detect, or monitor the pressure applied to electronic components and convert the information into electrical output signals. The pressure sensor measures the pressure of various gases and liquids.
Key Stakeholders
- Raw material suppliers
- Technology investors
- Pressure sensor designers, manufacturers, and suppliers
- Pressure sensor integrators, suppliers, and service providers
- Government laboratories
- In-house testing laboratories
- System integrators
- Distributors, resellers, and traders
- Research institutions and organizations
- Providers of application software
- Pressure sensor forums, alliances, consortiums, and associations
- Market research and consulting firms
- End use
Report Objectives
- To describe and forecast the pressure sensor market, by connectivity, sensing method, sensor type, pressure range, and end use, in terms of value
- To describe and forecast the pressure sensor market, by end use, in terms of volume
- To forecast the market for various segments with regard to four main regions: North America, Europe, Asia Pacific, and the Rest of the World (RoW), in terms of value
- To provide a detailed overview of the smart textiles supply chain, ecosystem analysis, Porter’s five forces analysis, case studies, tariff analysis, regulations, pricing analysis, patent analysis, AI impact, and the 2025 US tariff impact
- To provide qualitative information regarding pressure sensors for different media types and technologies related to pressure sensors
- To analyze the micromarkets1 with respect to individual growth trends, prospects, and contributions to the total market
- To study the complete supply chain and allied industry segments, and perform a supply chain analysis of the pressure sensor landscape
- To strategically analyze the regulatory landscape, tariffs, standards, patents, Porter’s Five Forces, import and export scenarios, trade values, and case studies pertaining to the market under study
- To analyze the opportunities in the market for various stakeholders by identifying the high-growth segments of the pressure sensor market
- To profile the key players and comprehensively analyze their market position in terms of ranking and core competencies2, along with detailing the competitive landscape for market leaders
- To analyze competitive developments, such as product launches, acquisitions, partnerships, expansions, and macroeconomic outlook, in the pressure sensor market
Customization Options
With the given market data, MarketsandMarkets offers customizations according to the company’s specific needs. The following customization options are available for the report:
Get the Full Pressure Sensor Market Report
Full forecast, segment splits, and company analysis for all Pressure Sensor Market.
- Canada Pressure Sensor Market
- Mexico Pressure Sensor Market
- US Pressure Sensor Market
- Germany Pressure Sensor Market
- UK Pressure Sensor Market
- France Pressure Sensor Market
- Italy Pressure Sensor Market
- China Pressure Sensor Market
- Japan Pressure Sensor Market
- India Pressure Sensor Market
- South Korea Pressure Sensor Market
- Rest Of Europe Pressure Sensor Market
- Rest Of Asia Pacific Pressure Sensor Market
- Bahrain Pressure Sensor Market
- Kuwait Pressure Sensor Market
- Oman Pressure Sensor Market
- Qatar Pressure Sensor Market
- Rest Of Middle East Pressure Sensor Market
- Saudi Arabia Pressure Sensor Market
- UAE Pressure Sensor Market
Need a Tailored Report?
Customize this report to your needs
Get 10% FREE Customization
Customize This Report
