
North America Retail Analytics Market (2024-2029)

The North America Retail Analytics Market was valued at $1860.7 Million in 2024 and projected to reach to $4778.1 Million by 2029, representing a compound annual growth rate of 20.8%. North America's retail analytics market is poised for sustained expansion driven by increasing consumer expectations for personalized shopping experiences and the need for real-time inventory optimization.


| Market Size in | USD 26.32 MN |
| Market Forecast in | |
| CAGR | |
| Forecast Period | |
| Units Considered | Value (USD MN) |
North America Retail Analytics Market Trends and Insights
- North America's retail sector is increasingly adopting advanced analytics solutions to optimize inventory management, enhance customer insights, and drive operational efficiency.
- This growth trajectory reflects North America's strong digital infrastructure, high retail technology adoption rates, and competitive pressure among major retailers to leverage data-driven decision-making. Driving North America's market expansion are investments in omnichannel retail strategies, real-time analytics capabilities, and artificial intelligence integration.
- North America's mature retail landscape and presence of leading technology vendors accelerate the deployment of sophisticated analytics platforms.
- The region's focus on personalization, supply chain optimization, and predictive analytics positions North America as a critical growth engine for the global retail analytics market through 2029..
Key Market Statistics
- CAGR (2024-2029) 20.8% CAGR
- Market Size, 2024 ~USD 1860.7 Million
- Forecast, 2029 ~USD 4778.1 Million
- Geography North America
North America Retail Analytics Market Overview
Strong Market Valuation :
North America's retail analytics market is valued at $1,860.7 million in 2024, representing the region's significant investment in data-driven retail solutions and digital transformation initiatives.
Impressive Growth Trajectory :
With a CAGR of 20.8%, the North American market is projected to reach $4,778.1 million by 2029, demonstrating sustained demand for advanced analytics capabilities among retailers.
Digital-First Retail Adoption :
North American retailers are rapidly adopting analytics solutions to optimize inventory management, enhance customer insights, and improve operational efficiency across omnichannel environments.
Technology Infrastructure Maturity :
The region's advanced digital infrastructure and high technology adoption rates position North America as a leader in implementing sophisticated retail analytics platforms and AI-driven solutions.
North America Retail Analytics Market Dynamics
- Retailers across the US and Canada are investing heavily in advanced analytics platforms to gain competitive advantages in an increasingly digital marketplace.
- The region's mature technology infrastructure and strong digital adoption rates support rapid implementation of sophisticated analytics solutions. Looking ahead to 2029, North American retailers will continue leveraging predictive analytics, machine learning, and AI-powered insights to drive customer engagement and operational excellence.
- The convergence of e-commerce growth, omnichannel retail strategies, and data privacy regulations will shape market dynamics, creating opportunities for vendors offering compliant, scalable analytics solutions tailored to North American retail requirements..
Market Ecosystem
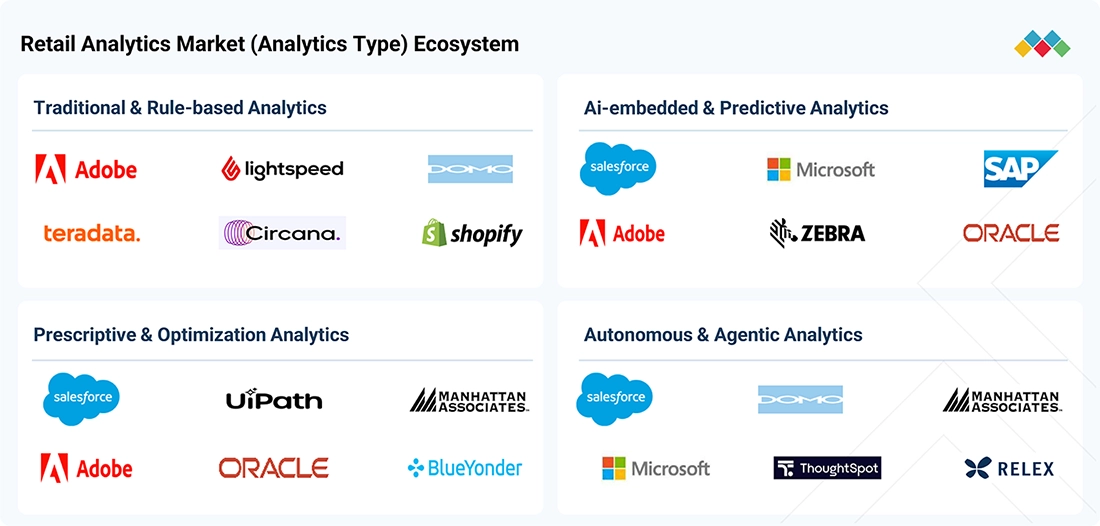
RETAIL ANALYTICS MARKET : COMMERCIAL USE CASES ACROSS INDUSTRIES
| COMPANY | USE CASE DESCRIPTION | BENEFITS |
|---|---|---|
 |
Cape Union Mart implemented Oracle Retail Merchandising Cloud Service, Oracle Retail Merchandise Financial Planning Cloud Service, Oracle Retail Assortment Planning Cloud Service, and Oracle Retail Science Cloud Services to modernize merchandising, financial planning, and demand forecasting. The retailer replaced manual, spreadsheet-based processes with an integrated cloud platform, improving visibility across inventory, assortment, planning, and fulfillment while supporting more accurate, data-driven retail decisions. | Doubled order fulfillment capacity with fewer warehouse staff | Automated assortment and financial-planning workflows | Improved inventory visibility and merchandise assortments | Generated more accurate demand forecasts for seasonal trends | Enabled seamless cross-channel fulfillment supporting the DARE customer initiative |
 |
CHRIST implemented SAP Commerce Cloud and SAP Emarsys to create a unified commerce and customer engagement environment across more than 200 connected stores. The retailer consolidated sales, behavioral, and historical customer data to support personalized marketing, improve order management and ship-from-store operations, and deliver more consistent experiences across point-of-sale, ecommerce, email, web, and mobile wallet channels. | Increased revenue by 30–40% year-over-year | Achieved 99.9% site availability despite 150% higher Cyber Week traffic | Reduced campaign creation time to under one hour | Expanded the ecommerce team from 10 to over 100 members | Improved order fulfillment across 200+ connected stores |
 |
Walgreens implemented Blue Yonder’s AI-based Order Management microservices to strengthen real-time inventory visibility and order promising across its omnichannel network. The retailer uses analytics-driven inventory and fulfillment information to calculate accurate order options across more than 200 million item-store combinations, helping customers receive reliable 30-minute order-ready commitments while improving speed, proximity-based fulfillment, and overall digital commerce execution. | Enabled a 30-minute customer order promise | Improved real-time inventory visibility across 200+ million item-store combinations | Strengthened order accuracy through AI-based fulfillment decisions | Improved fulfillment speed and proximity to customers | Enhanced omnichannel fulfillment reliability and digital commerce execution |
Logos and trademarks shown above are the property of their respective owners. Their use here is for informational and illustrative purposes only.
Related Ecosystem
Analytics
- Natural Language Processing (NLP)
- Machine Learning
- Supply Chain Management
- Predictive Analytics
- Image Sensors
- International Business Machines Corporation
- MICROSOFT CORPORATION
- Oracle Corporation
- SAP SE
Retail Analytics
- Supply Chain Management
- Automatic Number Plate Recognition (ANPR)
- Customer Analytics
- Descriptive Analytics
- Face Recognition
- SAP SE
- SAS INSTITUTE INC
- MICROSOFT CORPORATION
- Zensar Technologies Limited
- Adobe Inc.
Cloud Computing
- Software as A Service (SaaS)
- Natural Language Processing (NLP)
- Platform as A Service (PaaS)
- Machine Learning
- Supply Chain Management
- International Business Machines Corporation
- MICROSOFT CORPORATION
- Oracle Corporation
- Amazon.com, Inc.
Key Takeaways
- North America's retail analytics market will grow from $1,860.7M (2024) to $4,778.1M (2029), representing a 20.8% CAGR.
- North America retailers are prioritizing AI-driven analytics and real-time insights to enhance customer personalization and operational efficiency.
- North America's advanced digital infrastructure and competitive retail environment accelerate adoption of sophisticated analytics solutions.
- North America's omnichannel retail strategies and supply chain optimization initiatives drive sustained demand for analytics platforms through 2029.
Retail Analytics Market Report Scope
| Report Metric | Details |
|---|---|
| Base Year | 2024 |
| Fastest Growing Segment | SUPPORT & MAINTENANCE (Professional Service) |
| Forecast Period | 2024–2029 |
| Growth Rate | CAGR of 24% from 2024 to 2029 |
| Largest Segment | SOFTWARE (Offering) |
| Market Size Base Year (Billions) | ~USD 8.53 (2024) |
| Revenue Forecast (Billions) | ~USD 25 (2029) |
| Segments Covered | Offering, Analytics Type, Deployment Mode, Service, Professional Service, Business Function, Application, Product Type, Industrial Product Type, Consumer Product Type, Channel Type, Channel |
North America Retail Analytics Market Report Segmentation
12 segment dimensions are covered across the global market.
By Offering
- Services
- Software
By Analytics Type
- Descriptive Analytics
- Diagnostic Analytics
- Predictive Analytics
- Prescriptive Analytics
By Deployment Mode
- Cloud
- On-Premises
By Service
- Managed Services
- Professional Services
By Professional Service
- Consulting & Advisory
- Integration & Deployment
- Support & Maintenance
- Training & Education
By Business Function
- Finance & Accounting
- Hr
- Operations & Supply Chain
- Sales & Marketing
By Application
- Crm
- Fraud Detection & Prevention
- Merchandise Planning
- Order Fulfillment & Returns Management
- Other Applications
- Price Recommendations & Optimization
- Supply Chain Management
By Product Type
- Consumer
- Industrial
By Industrial Product Type
- Equipment
- Fabricated Items
- Operating Supplies
- Raw Materials
By Consumer Product Type
- Convenience Goods
- Shopping Goods
- Specialty Goods
- Unsought Goods
By Channel Type
- Offline
- Online
By Channel
- Offline
- Online
Target Audience
- Retail Analytics Software Vendors : Need detailed North American market sizing and growth forecasts to develop region-specific product strategies, pricing models, and go-to-market plans for US and Canadian retailers.
- Retail Enterprise Executives : Require market intelligence on analytics adoption trends and competitive benchmarks to justify technology investments and align digital transformation initiatives with industry standards.
- Management Consulting Firms : Utilize comprehensive North American market data to support client engagements, validate retail transformation strategies, and identify emerging opportunities in analytics implementation.
- Investment & Private Equity Firms : Need accurate market valuations and growth projections for North America to evaluate investment opportunities in retail analytics companies and technology-enabled retail platforms.
- Technology Solution Providers : Require regional market insights to develop North America-focused partnerships, integration strategies, and bundled offerings that address specific retail analytics needs in the US and Canada.
Key Companies in the North America Retail Analytics Market
| Company | HQ | Ownership | Strongest segments |
|---|---|---|---|
| FIRST DATA CORPORATION | United States | Private Company | Merchant acquiring & payment acceptance,Issuer processing & account management,Network, value-added services & other, |
| BMC SOFTWARE INC. | United States | Private Company | Mainframe Service Management (MSM) and Mainframe Data/Performance,Control-M Workload Automation and Output Management,Enterprise Service Management (ITSM, ITOM, ITAM, Identity), |
| GENPACT | Bermuda | Public Company | Financial Services Operations and Technology,Consumer and Healthcare Operations,High Tech and Manufacturing Solutions, |
| SYNIVERSE TECHNOLOGIES, LLC | United States | Private Company | Carrier messaging and interconnect (SMS, IPX, signaling hubs),Enterprise messaging and alerts,CPaaS and API-based communications, |
| PCCW | Hong Kong | Public Company | Fixed and mobile connectivity (HKT),Enterprise solutions, IT services, and BPO,Media and OTT (Viu, TV, advertising), |
| TABLEAU SOFTWARE INC | United States | Private Company | Tableau Desktop & Creator licenses,Tableau Server (on-premises / private cloud),Tableau Online (SaaS), |
| EBAY INC. | United States | Public Company | Core marketplace transaction fees,Advertising and promoted listings,Payments and ancillary services, |
| VERIFONE | United States | Private Company | POS Terminals & Payment Devices,Payment Gateway & E-commerce Solutions,Managed & Value-Added Services, |
| ADOBE SYSTEMS INCORPORATED | United States | Public Company | Digital Media (Creative Cloud and Document Cloud),Digital Experience (Experience Cloud and related services),Publishing and Advertising & Other, |
| EXL | United States | Public Company | Insurance digital operations and analytics,Healthcare and Life Sciences services,Banking, Capital Markets, and Diversified Industries, |
| MICROSOFT | United States | Public Company | Azure and other cloud services,Microsoft 365 Commercial (Office, Teams, EMS, Copilot),Windows (OEM and Commercial), |
| IBM | United States | Public Company | Software (Hybrid Cloud & AI Platforms),Consulting,Infrastructure, |
| SAP | Germany | Public Company | Core ERP (SAP S/4HANA and legacy ECC),HCM (SAP SuccessFactors),Spend Management & Business Network, |
| ORACLE | United States | Public Company | Cloud Applications (Fusion ERP/EPM/SCM/HCM, NetSuite, Oracle Health, CX),Database and Middleware (Oracle Database, Autonomous DB, MySQL, Java, middleware tools),Cloud Infrastructure (OCI compute, storage, networking, AI/ML, IoT, blockchain), |
| SALESFORCE | United States | Public Company | Sales Cloud and Agentforce Sales,Service Cloud, Agentforce Service, and Field Service,Marketing, Commerce, and Salesforce Starter, |
| MICROSTRATEGY | United States | Public Company | Bitcoin treasury and exposure securities,AI-powered enterprise analytics (Strategy One),Strategy Mosaic and data governance layer, |
| QLIK | United States | Private Company | Analytics platforms (QlikView, Qlik Sense, cloud analytics),Data integration and preparation,Application automation and workflow orchestration, |
| TERADATA | United States | Public Company | AI & Knowledge Platform (software, subscriptions, cloud),Consulting & Support Services, |
| WNS | India | Private Company | BFSI BPM (banking, financial services, insurance),Travel, Shipping/Logistics, and Utilities BPM,Manufacturing/Retail/CPG, Media, Telecom, Hi-tech & Professional Services, |
| HCL | India | Public Company | IT and Business Services,Engineering and R&D Services,HCL Software and IP-led Offerings, |
| LIGHTSPEED COMMERCE | Canada | Public Company | Retail commerce platform (Lightspeed Retail, eCommerce, Wholesale/NuORDER),Hospitality platform (Lightspeed Restaurant, KDS, hospitality modules),Payments and financial solutions (Lightspeed Payments, Capital), |
FIRST DATA CORPORATION
First Data Corporation is a United States-based private company founded in 1992 that employs 19,000 people. The company operates as a major player in financial services and payment processing.
BMC SOFTWARE INC.
BMC Software Inc. is a United States-based private company founded in 1980 with 6,700 employees. The company specializes in software solutions for enterprise IT management and operations.
GENPACT
Genpact is a Bermuda-based public company founded in 1997 with 145,000 employees. The company provides business process management, digital transformation, and IT services globally.
SYNIVERSE TECHNOLOGIES, LLC
Syniverse Technologies, LLC is a United States-based private company founded in 1989 with 2,179 employees. The company specializes in telecommunications and mobile roaming solutions.
PCCW
PCCW is a Hong Kong-based public company founded in 1925 with 14,600 employees. The company operates as a major telecommunications and media conglomerate in Asia.
TABLEAU SOFTWARE INC
Tableau Software Inc. is a United States-based private company founded in 2003 with 4,181 employees. The company develops data visualization and business intelligence software solutions.
EBAY INC.
eBay Inc. is a United States-based public company founded in 1995 with 12,300 employees. The company operates as a global e-commerce and online marketplace platform.
VERIFONE
VeriFone is a United States-based private company founded in 1981 with 5,600 employees. The company manufactures and provides payment processing solutions and point-of-sale systems.
ADOBE SYSTEMS INCORPORATED
Adobe Systems Incorporated is a United States-based public company founded in 1982 with 31,360 employees. The company develops and markets creative, document, and digital marketing software solutions.
EXL
EXL is a United States-based public company founded in 1999 with 65,000 employees. The company provides business process management, analytics, and IT services to global enterprises.
MICROSOFT
Microsoft is a United States-based public company founded in 1975 with 228,000 employees. The company develops and markets software, cloud services, and technology solutions globally.
IBM
IBM is a United States-based public company founded in 1911 with 264,300 employees. The company provides IT services, cloud computing, software, and enterprise technology solutions worldwide.
SAP
SAP is a Germany-based public company founded in 1972 with 111,038 employees. The company develops and markets enterprise resource planning (ERP) software and cloud solutions globally.
ORACLE
Oracle is a United States-based public company founded in 1977 with 141,000 employees. The company develops database software, cloud computing services, and enterprise technology solutions.
SALESFORCE
Salesforce is a United States-based public company founded in 1999 with 83,334 employees. The company provides cloud-based customer relationship management (CRM) and enterprise software solutions.
MICROSTRATEGY
MicroStrategy is a United States-based public company founded in 1989 with 1,511 employees. The company develops business intelligence and analytics software platforms.
QLIK
Qlik is a United States-based private company founded in 1993 with 2,511 employees. The company develops data analytics and business intelligence software solutions.
TERADATA
Teradata is a United States-based public company founded in 1979 with 5,100 employees. The company provides data analytics, cloud platforms, and enterprise data warehouse solutions.
WNS
WNS is an India-based private company founded in 1998 with 66,085 employees. The company provides business process management, IT services, and customer engagement solutions globally.
HCL
HCL is an India-based public company founded in 1976. The company provides IT services, software development, and technology consulting solutions to enterprises worldwide.
LIGHTSPEED COMMERCE
Lightspeed Commerce is a Canada-based public company founded in 2005 with 3,400 employees. The company provides cloud-based point-of-sale and e-commerce software solutions for retailers.
Countries within North America - compare and drill down
| Country | 2025 size (native) |
|---|---|
| US | USD 4715.9 Million |
| Canada | USD 3117.8 Million |
Country market size visualization
Reasons to Buy this Report
- Market Size & Growth Data : Access precise valuation of the North American retail analytics market ($1,860.7M in 2024) with detailed forecasts through 2029, enabling accurate business planning and investment decisions.
- Country-Level Breakdown : Obtain granular market data for US and Canada separately, allowing you to tailor strategies to each country's unique retail landscape, regulatory environment, and technology adoption rates.
- Competitive Intelligence : Understand North America's market dynamics, key growth drivers, and technology adoption trends to benchmark your offerings against regional competitors and identify market gaps.
- Strategic Investment Guidance : Leverage the 20.8% CAGR projection to justify investments in North American retail analytics capabilities and identify high-growth segments within the region's retail sector.
- Customer Targeting Insights : Identify and prioritize North American retail segments most actively adopting analytics solutions, from inventory optimization to customer personalization, to focus sales and marketing efforts.
Frequently asked questions
What is the projected size of the North America retail analytics market by 2029?
North America's retail analytics market is projected to reach $4,778.1 million by 2029, growing from $1,860.7 million in 2024.
What is the CAGR for North America's retail analytics market?
North America's retail analytics market is expected to grow at a compound annual growth rate (CAGR) of 20.8% between 2024 and 2029.
What are the primary drivers of growth in North America's retail analytics market?
North America's market growth is driven by omnichannel retail adoption, AI integration, real-time analytics capabilities, and supply chain optimization initiatives among retailers.
How does North America's retail analytics market compare to global trends?
North America's 20.8% CAGR outpaces the global average of 24% CAGR, reflecting the region's mature market dynamics and established technology infrastructure.
Which retail segments in North America are driving analytics adoption?
North America's e-commerce, specialty retail, and large-format retailers are leading analytics adoption to enhance customer insights, inventory optimization, and personalization strategies.
RESEARCH METHODOLOGY
The research methodology for the retail analytics market report involved extensive secondary research using authoritative industry sources. Company publications, regulatory documents, association materials, standards publications, and government databases supported comprehensive market understanding. Peer-reviewed journals and reputable technology publications were reviewed to identify relevant developments influencing retail analytics adoption. In-depth interviews were conducted with analytics vendors, retailers, systems integrators, consultants, technology partners, and industry specialists. These interviews helped validate market trends, technology advancements, deployment models, adoption patterns, and regional demand dynamics. Primary respondents also provided perspectives on merchandising, inventory optimization, customer analytics, pricing, and operational intelligence requirements. Retailers and industry experts provided inputs to validate key qualitative and quantitative market information. The methodology combined secondary evidence and primary insights to strengthen segmentation, competitive assessment, and forecast assumptions. This structured approach supported consistent analysis across offerings, analytics types, applications, retail formats, regions, and countries.
Secondary Research
During secondary research, multiple authoritative sources were consulted to identify, collect, and validate information for this study. Secondary sources included annual reports, press releases, investor presentations, product documentation, technical papers, and corporate blogs. Government publications, industry associations, standards organizations, and official statistics supported validation of retail market developments. Company websites provided information on analytics solutions, artificial intelligence capabilities, customer deployments, partnerships, and product developments. Retailer disclosures supported assessment of technology adoption across merchandising, inventory, ecommerce, pricing, and store operations. Official statistical sources were reviewed to understand retail sales, ecommerce activity, digitalization, and broader economic conditions. Technology documentation supported evaluation of predictive analytics, optimization, cloud architectures, data integration, and decision intelligence capabilities. Together, these sources strengthened market segmentation, vendor assessment, technology mapping, and analysis of evolving customer requirements.
Recognized associations, standards bodies, government organizations, and multilateral institutions were also consulted throughout secondary research activities. Sources included the National Retail Federation, GS1, the United States Census Bureau, the OECD, and relevant national statistical authorities. These organizations provided information on retail activity, ecommerce adoption, standards, digital transformation, and technology-related operating trends. GS1 materials supported understanding of standardized identification, product information, interoperability, and data exchange across retail ecosystems. Government statistics supported validation of retail activity, ecommerce penetration, consumer spending patterns, and country-level market conditions. Vendor materials from Oracle, Microsoft, Salesforce, SAP, Adobe, and others supported competitive and technology assessments. Secondary research also covered industry value chains, vendor positioning, product developments, partnerships, acquisitions, and deployment patterns. Information was cross-checked across multiple sources wherever possible to improve consistency, reliability, and analytical defensibility. Primary interviews subsequently validated secondary findings concerning adoption priorities, implementation challenges, investment patterns, and competitive differentiation. No syndicated market research websites were used as information sources for developing the retail analytics analysis.
Primary Research
In the primary research process, diverse stakeholders across retail analytics supply and demand ecosystems were interviewed extensively. From the supply side, participants included executives, product managers, data scientists, consultants, and technology specialists. These respondents represented companies offering retail analytics platforms, business intelligence solutions, cloud services, and AI capabilities. Systems integrators, implementation partners, consulting firms, managed service providers, and digital transformation specialists were also consulted. Demand-side respondents included retailers, ecommerce operators, merchandising leaders, supply chain managers, and technology decision-makers globally. Additional participants included finance leaders, store operations teams, marketing executives, customer analytics specialists, and procurement professionals. These interviews helped assess adoption patterns, implementation challenges, investment priorities, technology requirements, and future spending intentions. Primary insights were evaluated alongside secondary evidence to improve consistency, reliability, and market-specific analytical depth.
The primary research ensured that all critical parameters influencing the retail analytics market, including demand forecasting requirements, inventory optimization, customer analytics, pricing intelligence, merchandising analytics, cloud adoption, artificial intelligence integration, predictive analytics, prescriptive analytics, and evolving retail use cases, were thoroughly assessed. Each factor was carefully analyzed, verified through primary interviews, and evaluated to obtain precise qualitative and quantitative inputs for the study.
Once the initial phase of market engineering was completed, including detailed calculations for market statistics, segment-specific growth forecasts, vendor revenue estimates, and data triangulation, a second round of primary research was conducted. This stage was crucial for refining and validating key data points, including solutions and services adoption, cloud and on-premises deployment patterns, enterprise-size distribution, retail-type demand, regional penetration, vendor positioning, and key market dynamics such as drivers, opportunities, challenges, and restraints. Additional validation covered increasing adoption of AI-driven demand forecasting, inventory optimization, generative AI, conversational analytics, enterprise decision intelligence, omnichannel analytics, real-time data processing, and managed retail analytics services across major retail segments.
The comprehensive market engineering process, together with top-down and bottom-up approaches and multiple data triangulation methods, was extensively employed to estimate and forecast the overall market, as well as all major segments and subsegments. Extensive qualitative and quantitative validation was conducted throughout the market engineering process to capture critical information and insights across the entire retail analytics value chain.
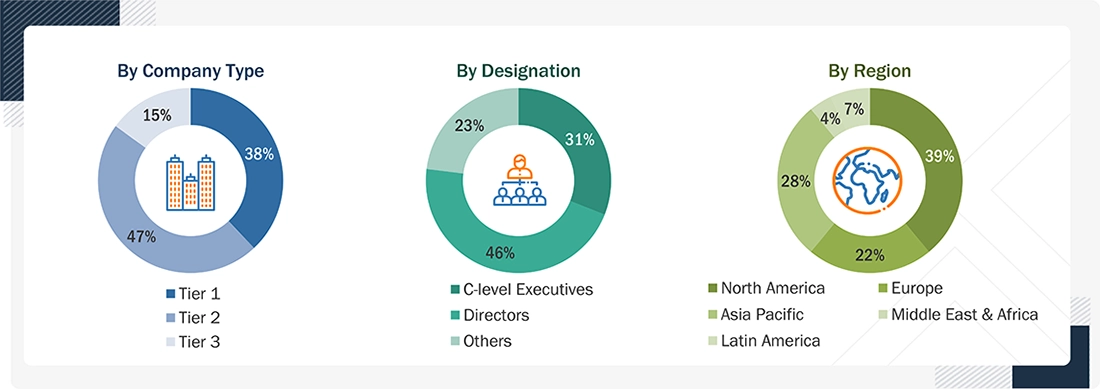
Note: Others include sales, marketing, and product managers; tier 1 companies’ revenues are more than USD 500 million, tier 2 companies’ revenues range between USD 500 and 100 million, and tier 3 companies’ revenues are equal to or less than USD 100 million.
To know about the assumptions considered for the study, download the pdf brochure
Market Size Estimation
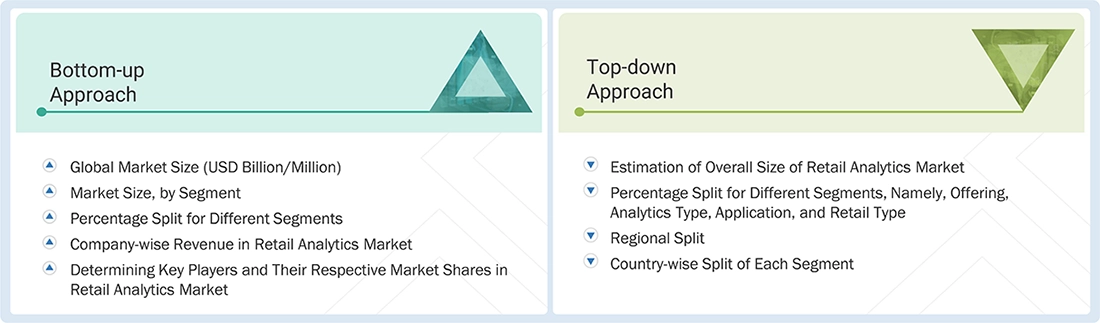
The top-down and bottom-up approaches were employed to estimate and forecast the retail analytics market, as well as its dependent submarkets. This multi-layered analysis was further reinforced through data triangulation, which incorporated primary and secondary research inputs. The market figures were also validated against the existing MarketsandMarkets repository for accuracy.
Data Triangulation
The market was divided into several segments and subsegments after determining the overall market size using the market size estimation processes described above. To complete the overall market engineering process and determine the exact statistics for each market segment and subsegment, data triangulation and market segmentation procedures were employed, wherever applicable. The overall market size was then used in the top-down approach to estimate the size of other individual markets by applying percentage splits to the market segmentation.
Market Definition
Retail analytics comprises software and services that collect, integrate, analyze, and interpret data generated across retail operations. These solutions process information from point-of-sale, ecommerce, loyalty, inventory, merchandising, supply chain, and customer interaction systems. Retail analytics converts operational and customer data into insights supporting pricing, assortment, replenishment, marketing, and store decisions. Platforms apply descriptive, diagnostic, predictive, and prescriptive techniques to explain performance and recommend actions across retail functions. Predictive models help retailers anticipate demand, purchasing behavior, inventory requirements, sales outcomes, and emerging operational risks. Prescriptive analytics combines forecasts with recommended actions for pricing, allocation, promotions, replenishment, and customer engagement decisions. Retailers also use analytics to evaluate loyalty, product performance, sell-through, inventory availability, and omnichannel customer behavior. Artificial intelligence and machine learning increasingly strengthen forecasting, recommendation, segmentation, anomaly detection, and automated decision-making capabilities. Retail analytics environments combine internal transaction histories with external information, including weather, economic, and competitive signals. These capabilities help retailers improve revenue, margins, customer satisfaction, operational efficiency, inventory productivity, and enterprise decision-making. The market includes analytics platforms, specialized applications, implementation services, managed services, and supporting data integration capabilities worldwide.
Key Stakeholders
- Retail analytics platform and solution providers
- Business intelligence and visualization platform providers
- Artificial intelligence and machine learning technology providers
- Retail merchandising and planning solution providers
- Pricing and promotion optimization solution providers
- Inventory and demand forecasting solution providers
- Customer analytics and personalization solution providers
- Point-of-sale and commerce technology providers
- Cloud service and data platform providers
- Systems integrators and implementation service providers
- Consulting and managed analytics service providers
- Retailers, distributors, technology partners, and data providers
Report Objectives
- To define, describe, and predict the retail analytics market by offering, analytics type, application, retail type, and region
- To provide detailed information related to major factors (drivers, restraints, opportunities, and industry-specific challenges) influencing market growth
- To analyze opportunities in the market and provide details of the competitive landscape for stakeholders and market leaders
- To forecast the market size of segments with respect to five main regions: North America, Europe, Asia Pacific, the Middle East & Africa, and Latin America
- To analyze each submarket with respect to individual growth trends, prospects, and contributions to the overall retail analytics market
- To analyze competitive developments, such as partnerships, new product launches, mergers & acquisitions, in the retail analytics market
- To analyze the impact of macroeconomic factors on the retail analytics market across all regions
Available customizations:
Using the provided market data, MarketsandMarkets offers customizations tailored to the company’s specific needs. The following customization options are available for the report.
Product analysis
- Product comparative analysis, which gives a detailed comparison of innovative products being offered by prominent vendors
Geographic analysis
- Further breakdown of additional European countries by offering, analytics type, application, and retail type
- Further breakdown of additional Asia Pacific countries by offering, analytics type, application, and retail type
- Further breakdown of additional Middle East & African countries by offering, analytics type, application, and retail type
- Further breakdown of additional Latin American countries by offering, analytics type, application, and retail type
Company information
- Detailed analysis and profiling of additional market players (up to five)
Get the Full Retail Analytics Market Report
Full forecast, segment splits, and company analysis for all Retail Analytics Market.
- Asean Countries Retail Analytics Market
- Rest Of Asia Pacific Retail Analytics Market
- US Retail Analytics Market
- Canada Retail Analytics Market
- UK Retail Analytics Market
- Germany Retail Analytics Market
- France Retail Analytics Market
- Spain Retail Analytics Market
- Italy Retail Analytics Market
- Rest Of Europe Retail Analytics Market
- China Retail Analytics Market
- Japan Retail Analytics Market
- India Retail Analytics Market
- South Korea Retail Analytics Market
- Anz Retail Analytics Market
Need a Tailored Report?
Customize this report to your needs
Get 10% FREE Customization
Customize This Report
