
Europe Sugar Substitutes Market (2024-2029)

The Europe Sugar Substitutes Market was valued at $3671.4 Million in 2024 and projected to reach to $4572 Million by 2029, representing a compound annual growth rate of 4.5%. Europe's sugar substitutes market is poised for sustained expansion through 2029, supported by ongoing regulatory pressures to reduce sugar consumption and growing consumer health consciousness.


| Market Size in | USD 26.32 MN |
| Market Forecast in | |
| CAGR | |
| Forecast Period | |
| Units Considered | Value (USD MN) |
Europe Sugar Substitutes Market Trends and Insights
- This 4.5% compound annual growth rate reflects Europe's strong regulatory environment and consumer demand for healthier food alternatives.
- Europe leads global adoption of sugar substitutes, driven by stringent EU regulations on added sugars and widespread health consciousness among consumers seeking to reduce caloric intake and manage weight. The European market benefits from established distribution networks, premium product positioning, and innovation in sweetening technologies.
- Europe's diverse regulatory landscape across member states creates both opportunities and challenges for manufacturers.
- By 2029, Europe is expected to maintain its position as a mature, high-value market for sugar substitutes, with continued emphasis on natural and clean-label alternatives that align with consumer preferences for transparency and sustainability..
Key Market Statistics
- CAGR (2024-2029) 4.5% CAGR
- Market Size, 2024 ~USD 3671.4 Million
- Forecast, 2029 ~USD 4572 Million
- Geography Europe
Europe Sugar Substitutes Market Overview
Market Leadership Position :
Europe commands the largest share of global sugar substitutes adoption, driven by stringent EU regulations on added sugars and consumer preference for healthier alternatives. The region's regulatory framework creates competitive advantages for compliant manufacturers.
Steady Growth Trajectory :
Europe's sugar substitutes market is valued at $3,671.4 million in 2024, expanding at a 4.5% CAGR to reach $4,572.0 million by 2029. This growth outpaces many mature markets, reflecting sustained demand for low-calorie and zero-sugar products.
Germany Dominates Regional Market :
Germany leads European adoption with $1,314.1 million in market value, followed by the UK ($938.2 million) and France ($681.8 million). These three countries represent over 70% of Europe's total sugar substitutes market.
Regulatory Compliance Advantage :
EU regulations on sugar labeling and health claims create barriers to entry that protect established players. European manufacturers benefit from harmonized standards across member states, enabling efficient cross-border distribution and economies of scale.
Europe Sugar Substitutes Market Dynamics
- The region's mature retail infrastructure and strong e-commerce penetration facilitate product innovation and market accessibility.
- Key growth drivers include reformulation of beverages and confectionery products, increasing adoption in foodservice, and premiumization of natural sweetener alternatives.
- However, market growth remains moderate compared to emerging regions, reflecting market saturation in developed segments and consumer skepticism toward artificial sweeteners.
- Strategic opportunities exist in plant-based and stevia-derived products, which align with European clean-label trends and sustainability preferences..
Market Ecosystem
Related Ecosystem
Fandb Additives
- Dairy Products
- Bakery Products
- Polyglycerol Esters
- Microorganism
- Carbohydrates
- AZELIS HOLDINGS SA
- Archer-Daniels-Midland Company
- Amway
- UNILEVER PLC
- DuPont de Nemours, Inc.
Fandb Ingredients
- Dairy Products
- Bakery Products
- Microorganism
- Polydextrose
- Carbohydrates
- AZELIS HOLDINGS SA
- Archer-Daniels-Midland Company
- Kerry Group plc
- Amway
- DSM FIRMMENICH
Key Takeaways
- Europe's sugar substitutes market will grow from $3,671.4M (2024) to $4,572.0M (2029) at a 4.5% CAGR, reflecting mature market dynamics.
- Europe's stringent regulatory framework and health-conscious consumers drive sustained demand for sugar substitute products.
- Natural and clean-label sweetening solutions are increasingly preferred across Europe, shaping product innovation strategies.
- Europe maintains premium market positioning with established distribution channels and high consumer awareness of health benefits.
Sugar Substitutes Market Report Scope
| Report Metric | Details |
|---|---|
| Base Year | 2024 |
| Fastest Growing Segment | STEVIA (Subtype) |
| Forecast Period | 2024-2029 |
| Growth Rate | CAGR of 4.9% from 2024 to 2029 |
| Largest Segment | DRY (Form) |
| Market Size Base Year (Billions) | ~USD 23.54 (2024) |
| Revenue Forecast (Billions) | ~USD 29.9 (2029) |
| Segments Covered | Type, Subtype, Application, Subapplication, Form, Source |
Europe Sugar Substitutes Market Report Segmentation
6 segment dimensions are covered across the global market.
By Type
- High-Fructose Corn Syrup
- High-Intensity Sweeteners
- Low-Intensity Sweeteners
By Subtype
- Ace-K
- Allulose
- Aspartame
- Cyclamate
- D-Tagatose
- Erythritol
- Gels
- Granules
- Maltitol
- Mannitol
- Monk Fruit Extracts
- Other Artificial High-Intensity Sweeteners
- Other Dry Forms
- Other Low-Intensity Sweeteners
- Other Natural High-Intensity Sweeteners
- Powder
- Saccharin
- Sorbitol
- Stevia
- Sucralose
- Syrups
- Xylitol
By Application
- Beverages
- Food
- Food Products
- Health & Personal Care Products
- Other Applications
- Pharmaceuticals
By Subapplication
- Alcoholic Beverages
- Bakery Products
- Carbonated Drinks
- Confectionery Products
- Dairy Products
- Flavored Alcoholic Beverages
- Fruit Drinks & Juices
- Other Beverage Applications
- Other Beverages
- Other Food Applications
- Plant-Based Beverages
- Powdered Drinks
- Sweet Spreads
- Tabletop Sweeteners
By Form
- Crystals
- Dry
- Liquid
- Powder
By Source
- Artificial
- Natural
EUROPE: SUGAR SUBSTITUTES MARKET, BY APPLICATION, 2024–2029
| Segment | 2024 | 2025 | 2026 | 2027 | 2028 | 2029 | CAGR (%) |
|---|---|---|---|---|---|---|---|
| BEVERAGES | 1564.8 | 1636.9 | 1706.5 | 1785.4 | 1871.2 | 1920.9 | 4.2 |
| FOOD | 1462.7 | 1530 | 1603.4 | 1683.6 | 1771.2 | 1866.8 | 5 |
| HEALTH & PERSONAL CARE PRODUCTS | 556.5 | 577.6 | 600.7 | 625.9 | 653.5 | 683.5 | 4.2 |
| OTHER APPLICATIONS | 35.3 | 36.3 | 37.4 | 38.7 | 40 | 41.5 | 3.3 |
| PHARMACEUTICALS | 52.1 | 53.3 | 54.5 | 56 | 57.5 | 59.3 | 2.6 |
| TOTAL | 3671.4 | 3834.1 | 4002.7 | 4189.6 | 4393.4 | 4572 | 4.5 |
REST OF EUROPE: SUGAR SUBSTITUTES MARKET, BY APPLICATION, 2024–2029
| Segment | 2024 | 2025 | 2026 | 2027 | 2028 | 2029 | CAGR (%) |
|---|---|---|---|---|---|---|---|
| BEVERAGES | 301.55 | 312.37 | 324.19 | 337.08 | 351.13 | 366.46 | 4 |
| FOOD | 278.36 | 290.89 | 304.56 | 319.48 | 335.78 | 353.57 | 4.9 |
| HEALTH & PERSONAL CARE PRODUCTS | 109.13 | 112.73 | 116.67 | 120.99 | 125.71 | 130.86 | 3.7 |
| OTHER APPLICATIONS | 2.53 | 2.57 | 2.61 | 2.66 | 2.71 | 2.77 | 1.8 |
| PHARMACEUTICALS | 4.14 | 4.29 | 4.45 | 4.63 | 4.82 | 5.03 | 4 |
| TOTAL | 695.71 | 722.84 | 752.48 | 784.83 | 820.15 | 858.7 | 4.3 |
Target Audience
- Food & Beverage Manufacturers : Reformulate product portfolios to meet EU sugar reduction targets and consumer demand. Use market data to prioritize sweetener selection, optimize cost structures, and accelerate time-to-market for compliant products.
- Sweetener Suppliers & Ingredient Companies : Understand regional demand patterns for specific sweetener types (stevia, erythritol, aspartame, sucralose). Identify growth segments and customer concentration risks to optimize production and distribution strategies.
- Retail & Distribution Partners : Evaluate shelf-space allocation and product assortment strategies for sugar substitutes. Leverage market sizing data to negotiate supplier terms and forecast inventory requirements across European markets.
- Investment & Private Equity Firms : Assess acquisition targets and investment opportunities in European sugar substitutes companies. Use market forecasts and competitive analysis to evaluate valuation multiples and growth potential.
- Regulatory & Compliance Consultants : Support clients navigating EU food regulations and health claim substantiation. Reference market data to advise on product positioning, labeling compliance, and market entry strategies across European jurisdictions.
Countries within Europe - compare and drill down
| Country | 2025 size (native) |
|---|---|
| Germany | USD 1314.1 Million |
| UK | USD 938.2 Million |
| France | USD 681.8 Million |
| Italy | USD 435.7 Million |
| Spain | USD 343.5 Million |
| Rest Of Europe | USD 858.7 Million |
Country market size visualization
Reasons to Buy this Report
- Regional Market Segmentation : Detailed breakdown of Europe's sugar substitutes market by country, including Germany, UK, France, Italy, Spain, and Rest of Europe. Understand which markets offer highest growth potential and competitive intensity.
- Regulatory Intelligence : Comprehensive analysis of EU regulations on sugar labeling, health claims, and sweetener approvals. Identify compliance requirements and market opportunities created by evolving European food safety standards.
- Competitive Landscape Analysis : Assess leading European manufacturers, their market positioning, product portfolios, and distribution strategies. Benchmark your offerings against regional competitors and identify white-space opportunities.
- Consumer Trend Insights : Deep-dive into European consumer preferences for natural vs. synthetic sweeteners, clean-label demands, and sustainability expectations. Align product development with regional consumer behavior patterns.
- Strategic Growth Roadmap : Actionable forecasts through 2029 enable informed investment decisions for market entry, expansion, or M&A activities. Identify high-growth segments and underserved geographic pockets within Europe.
Frequently asked questions
What is the current size of Europe's sugar substitutes market?
Europe's sugar substitutes market was valued at $3,671.4 million in 2024 and is projected to reach $4,572.0 million by 2029.
What is the expected growth rate for sugar substitutes in Europe?
Europe's sugar substitutes market is expected to grow at a compound annual growth rate (CAGR) of 4.5% from 2024 to 2029.
What regulatory factors influence Europe's sugar substitutes market?
Europe's stringent EU regulations on added sugars, labeling requirements, and health claims significantly shape product development and market dynamics across member states.
Which product types are driving growth in Europe's sugar substitutes market?
Natural and clean-label sweetening solutions, including stevia, monk fruit, and sugar alcohols, are increasingly preferred by European consumers seeking transparent and sustainable alternatives.
How does Europe's market compare to global sugar substitutes trends?
Europe's 4.5% CAGR is slightly below the global 4.9% CAGR, reflecting Europe's mature market status with established consumer adoption and premium positioning compared to emerging regions.
RESEARCH METHODOLOGY
The study involved two major approaches in estimating the current size of the sugar substitutes market. Exhaustive secondary research was done to collect information on the market, peer, and parent markets. The next step was to validate these findings, assumptions, and sizing with industry experts across the value chain through primary research. Both top-down and bottom-up approaches were employed to estimate the complete market size. After that, market breakdown and data triangulation were used to estimate the market size of segments and subsegments.
Secondary Research
This research study involved the extensive use of secondary sources—directories and databases such as Bloomberg Businessweek and Factiva—to identify and collect information useful for a technical, market-oriented, and commercial study of the market.
In the secondary research process, various sources such as annual reports, press releases & investor presentations of companies, white papers, food journals, certified publications, articles from recognized authors, directories, and databases were referred to identify and collect information.
Secondary research was mainly used to obtain key information about the industry’s supply chain, the total pool of key players, and market classification and segmentation as per the industry trends to the bottom-most level, regional markets, and key developments from both market- and technology-oriented perspectives.
Primary Research
Extensive primary research was conducted after obtaining information regarding the sugar substitutes market scenario through secondary research. Several primary interviews were conducted with market experts from both the demand and supply sides across major countries of North America, Europe, Asia Pacific, South America, and the Rest of the World. Primary data was collected through questionnaires, emails, and telephonic interviews. The primary sources from the supply side included various industry experts, such as Chief X Officers (CXOs), Vice Presidents (VPs), Directors from business development, marketing, research, and development teams, and related key executives from distributors and key opinion leaders. Primary interviews were conducted to gather insights such as market statistics, data on revenue collected from the products and services, market breakdowns, market size estimations, market forecasting, and data triangulation. Primary research also helped in understanding the various trends related to sugar substitutes by type, manufacturing technology, application, form, source, and region. Stakeholders from the demand side, such as food and beverage companies and health and personal care companies who are using sugar substitutes, were interviewed to understand the buyer’s perspective on the suppliers, products, and their current usage of sugar substitutes and the outlook of their business which will affect the overall market.
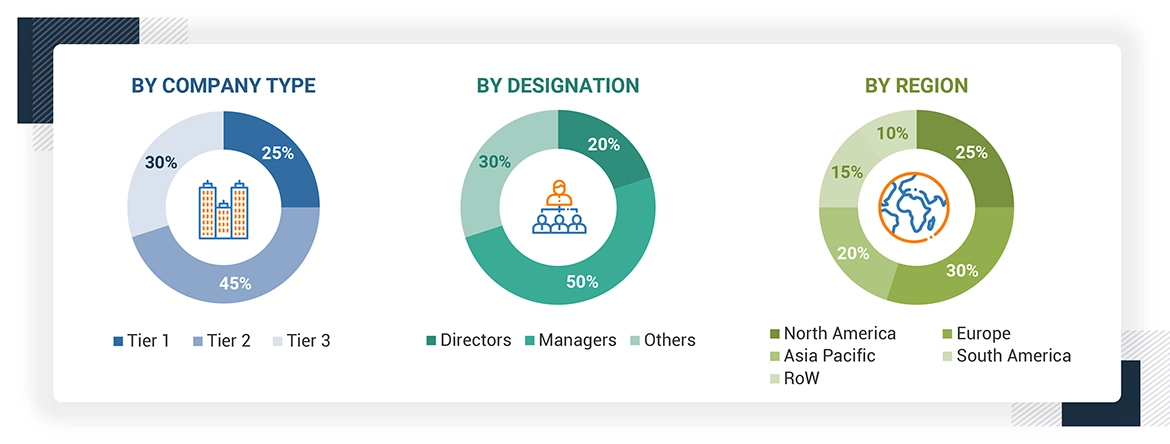
Note: The three tiers of the companies are defined based on their total revenues in 2022 or 2023, as per
the availability of financial data: Tier 1: Revenue > USD 1 billion; Tier 2: USD 100 million = Revenue = USD
1 billion; Tier 3: Revenue < USD 100 million.
To know about the assumptions considered for the study, download the pdf brochure
|
COMPANY NAME |
DESIGNATION |
|
Cargill, Incorporated (US) |
General Manager |
|
ADM (US) |
Sales Manager |
|
Ingredion (US) |
Manager |
|
International Flavors & Fragrances Inc (US) |
Head of processing department |
|
Tate & Lyle (UK) |
Marketing Manager |
|
Ajinomoto Co. Inc (Japan) |
Sales Executive |
Market Size Estimation
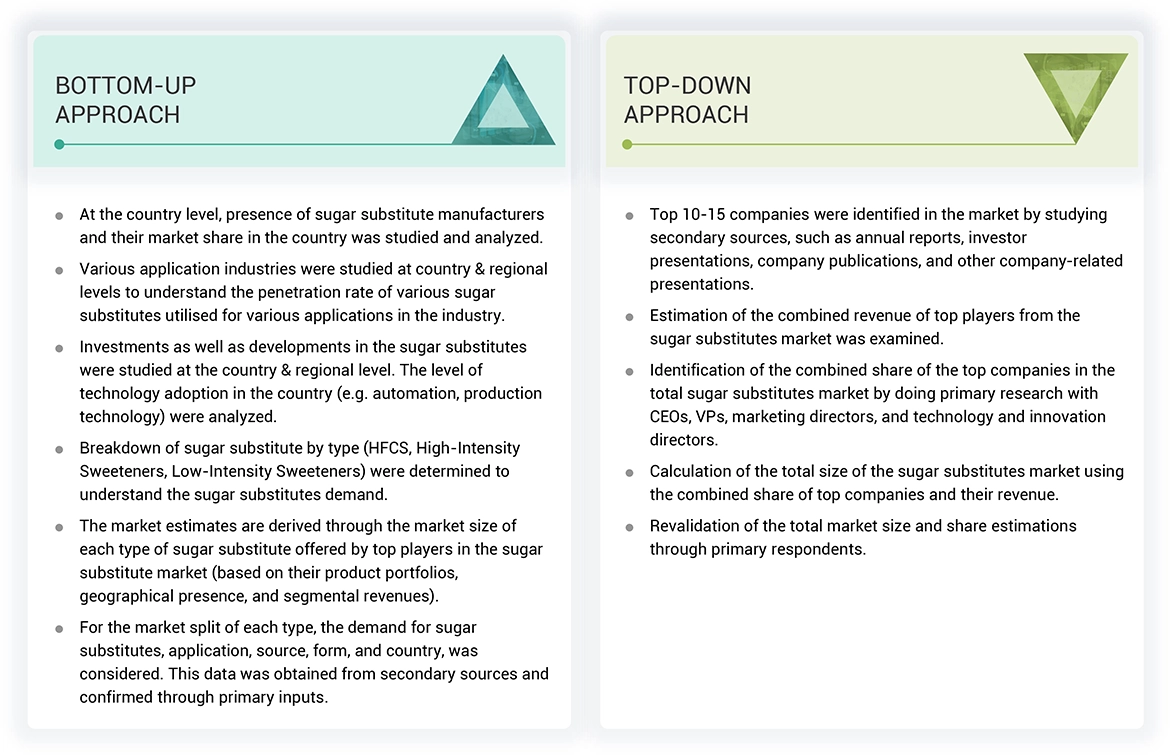
Both the top-down and bottom-up approaches were used to estimate and validate the total size of the sugar substitutes market. These approaches were also used extensively to determine the size of various subsegments in the market. The research methodology used to estimate the market size includes the following details:
- The key players in the industry and the overall markets were identified through extensive secondary research.
- All shares, splits, and breakdowns were determined using secondary sources and verified through primary sources.
- All possible parameters that affect the market covered in this research study were accounted for, viewed in extensive detail, verified through primary research, and analyzed to obtain final quantitative and qualitative data.
- The research included the study of reports, reviews, and newsletters of top market players, along with extensive interviews for opinions from leaders, such as CEOs, directors, and marketing executives.
Sugar Substitutes Market : Top-Down and Bottom-Up Approach
Data Triangulation
After arriving at the overall market size from the estimation process explained above, the total market was split into several segments and subsegments. The data triangulation and market breakdown procedures were employed, wherever applicable, to estimate the overall sugar substitutes market and arrive at the exact statistics for all segments and subsegments. The data was triangulated by studying various factors and trends from the demand and supply sides. The market size was also validated using both the top-down and bottom-up approaches
Market Definition
As defined by the FDA, “Sugar substitutes refer to substances that have little to no calories or other nutrients.” Sugar substitutes are substances used instead of sweeteners with sugar or sugar alcohol. They may also be called artificial sweeteners, non-nutritive sweeteners (NNS), and non-caloric sweeteners. A sugar substitutes can be defined as a food additive that duplicates the effect of sugar in taste, but usually with lesser food energy.
Stakeholders
- Raw material suppliers
- Regulatory bodies that include the following:
- Food safety agencies, such as the Food and Drug Administration (FDA), European Food Safety Authority (EFSA), US Department of Agriculture (USDA), Food Standards Australia New Zealand (FSANZ), Health Canada – Food Directorate, China National Center for Food Safety Risk Assessment (CFSA), and World Health Organization (WHO)
- Government agencies and NGOs
- End users include the following:
- Food & beverage manufacturers/suppliers
- Health & personal care product manufacturers/suppliers
- Retailers
- Commercial Research & Development (R&D) institutions and financial institutions
- Importers and exporters of sugar substitutes
- Traders, distributors, and suppliers
- Research organizations
- Trade associations and industry bodies
Report Objectives
- To determine and project the size of the sugar substitutes market with respect to the type, manufacturing technology, application, form, source, and regions in terms of value over five years, ranging from 2024 to 2029.
- To identify the attractive opportunities in the market by determining the largest and fastest-growing segments across regions
- To provide detailed information about the key factors influencing market growth (drivers, restraints, opportunities, and challenges)
- To analyze the opportunities in the market for stakeholders and provide details of the competitive landscape for market leaders.
- To analyze the micro-markets with respect to individual growth trends, prospects, and their contribution to the total market.
- To identify and profile the key players in the sugar substitutes market.
- To understand the competitive landscape and identify the major growth strategies adopted by players across the key regions.
Available Customizations
With the given market data, MarketsandMarkets offers customizations according to company-specific scientific needs.
The following customization options are available for the report:
Product Analysis
- Product Matrix, which gives a detailed comparison of the product portfolio of each company.
Geographic Analysis
With the given market data, MarketsandMarkets offers customizations according to company-specific scientific needs.
- Further breakdown of the Rest of Europe sugar substitutes market into key countries.
- Further breakdown of the Rest of Asia Pacific sugar substitutes market into key countries.
- Further breakdown of the Rest of South America sugar substitutes market into key countries.
Company Information
- Detailed analyses and profiling of additional market players (up to five)
Get the Full Sugar Substitutes Market Report
Full forecast, segment splits, and company analysis for all Sugar Substitutes Market.
- US Sugar Substitutes Market
- Canada Sugar Substitutes Market
- Mexico Sugar Substitutes Market
- Germany Sugar Substitutes Market
- UK Sugar Substitutes Market
- France Sugar Substitutes Market
- Italy Sugar Substitutes Market
- Spain Sugar Substitutes Market
- China Sugar Substitutes Market
- India Sugar Substitutes Market
- Japan Sugar Substitutes Market
- Brazil Sugar Substitutes Market
- Argentina Sugar Substitutes Market
- Rest Of Europe Sugar Substitutes Market
- Rest Of Asia Pacific Sugar Substitutes Market
- Rest Of South America Sugar Substitutes Market
Need a Tailored Report?
Customize this report to your needs
Get 10% FREE Customization
Customize This Report
