
Asia Pacific Switchgear Market (2025-2030)

The Asia Pacific Switchgear Market was valued at $49380 Million in 2025 and projected to reach to $67030 Million by 2030, representing a compound annual growth rate of 6.3%. Asia Pacific's switchgear market is positioned for sustained expansion, driven by the region's dominant role in global manufacturing and energy consumption.


| Market Size in | USD 26.32 MN |
| Market Forecast in | |
| CAGR | |
| Forecast Period | |
| Units Considered | Value (USD MN) |
Asia Pacific Switchgear Market Trends and Insights
- Asia Pacific's switchgear market is driven by rapid industrialization, urbanization, and increasing electricity demand across emerging economies.
- The region's infrastructure modernization initiatives and renewable energy integration are accelerating switchgear adoption in Asia Pacific, positioning it as a critical hub for global energy distribution solutions. Asia Pacific's switchgear market growth outpaces the global average of 5.7% CAGR, reflecting the region's strategic importance in the energy transition.
- Asia Pacific's investments in smart grid technologies and grid modernization are reshaping demand patterns for advanced switchgear solutions.
- By 2030, Asia Pacific will represent a substantial portion of global switchgear capacity, driven by expanding transmission and distribution networks across China, India, and Southeast Asia..
Key Market Statistics
- CAGR (2025-2030) 6.3% CAGR
- Market Size, 2025 ~USD 49380 Million
- Forecast, 2030 ~USD 67030 Million
- Geography Asia Pacific
Asia Pacific Switchgear Market Overview
Rapid Industrialization Driving Demand :
Asia Pacific's switchgear market is propelled by accelerating industrialization across emerging economies, with manufacturing sectors expanding significantly in China, India, and Southeast Asia, creating substantial demand for reliable electrical distribution infrastructure.
Renewable Energy Integration Acceleration :
The region's commitment to renewable energy targets is spurring switchgear adoption for grid modernization and distributed energy resource management, particularly in solar and wind installations across China, India, and Australia.
Urban Infrastructure Modernization :
Massive urbanization initiatives and smart city projects throughout Asia Pacific are necessitating upgraded electrical networks and advanced switchgear solutions to support growing urban populations and energy consumption.
Strong CAGR Outpacing Global Growth :
Asia Pacific's switchgear market is expanding at 6.3% CAGR through 2030, exceeding the global average of 5.7%, reflecting the region's strategic importance and investment in power infrastructure development.
Asia Pacific Switchgear Market Dynamics
- China's continued industrial growth, India's electrification initiatives, and Australia's renewable energy transition create diverse growth opportunities across multiple end-user segments.
- Infrastructure modernization programs and grid digitalization efforts are accelerating switchgear adoption across the region. The forecast period through 2030 will witness intensified competition and technological advancement as utilities and industrial operators prioritize grid reliability and efficiency.
- Investment in smart grid technologies, coupled with regulatory mandates for renewable energy integration, will further stimulate market growth.
- Asia Pacific's switchgear market is expected to capture increasing global market share as regional manufacturers enhance capabilities and expand distribution networks..
Market Ecosystem
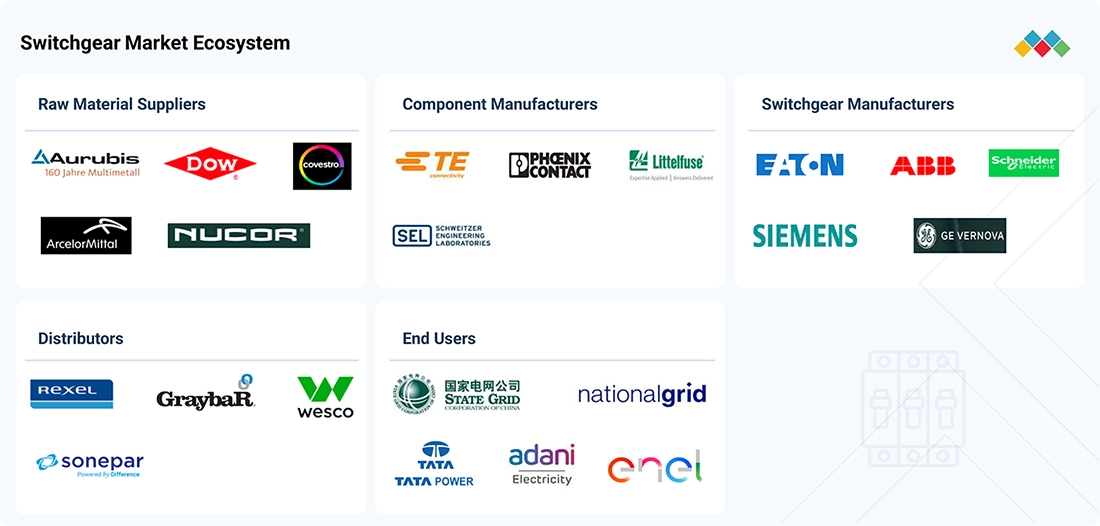
SWITCHGEAR MARKET: COMMERCIAL USE CASES ACROSS INDUSTRIES
| COMPANY | USE CASE DESCRIPTION | BENEFITS |
|---|---|---|
 |
Siemens Energy is supplying its 8VM1 Blue SF6-free gas-insulated switchgear (GIS) for the Hornsea 3 offshore wind farm off the UK coast. The 2.9 GW project comprises 197 turbines, with the switchgear installed within the wind-turbine towers. The 8VM1 Blue switchgear uses clean-air insulation and vacuum switching technology instead of SF6. As of mid-2026, Siemens Energy had delivered 2,870 GIS units for offshore wind-turbine applications. | Reduces greenhouse-gas emissions by approximately 900 tonnes of CO2 equivalent per switchgear unit compared with conventional SF6-filled bays | Eliminates the use of SF6, avoiding its high global-warming impact | Reducing the need for special handling, recycling, and reporting |
 |
TGOOD supplied 104 units of TGS-40.5 kV medium-voltage gas-insulated switchgear enclosed in prefabricated substation kiosks for the Western Downs Battery Energy Storage System (BESS) in Australia. The project was delivered in stages, with the second stage completed in July 2025. | Provides compact and integrated MV switchgear for BESS grid connection | Enabling reliable power switching and protection within prefabricated substation infrastructure while supporting faster deployment of energy-storage projects |
 |
GE Vernova commissioned 765 kV and 400 kV GIS bays at Khavda, Gujarat, for Adani, together with a 500 MVA transformer and 125 MVAR reactor. The project forms part of India's high-voltage transmission infrastructure supporting the rapidly developing renewable-energy region of Khavda. | Provides high-voltage transmission infrastructure capable of transferring large volumes of electricity from the Khavda renewable-energy zone | Supporting grid expansion and renewable-power evacuation |
Logos and trademarks shown above are the property of their respective owners. Their use here is for informational and illustrative purposes only.
Related Ecosystem
High Voltage Products And Systems
- Analytics Software
- Connected Healthcare
- Connected Logistics
- Geographical Information System (GIS)
- Network Bandwidth Management
- ABB India Limited
- Siemens ag
- SCHNEIDER ELECTRIC SE
- Eaton Corporation plc
- Fuji Electric Co., Ltd.
Power Infrastructure
- Geographical Information System (GIS)
- Cogeneration
- Battery Electric Vehicle (BEV)
- Cellular Network
- Fuel Cell
- Siemens ag
- ABB India Limited
- SCHNEIDER ELECTRIC SE
- General Electric Company
- Eaton Corporation plc
Key Takeaways
- Asia Pacific switchgear market valued at USD 49.38 billion in 2025, expanding to USD 67.03 billion by 2030 at 6.3% CAGR
- Asia Pacific's growth rate exceeds global average, driven by rapid industrialization and renewable energy integration across the region
- Smart grid modernization and transmission network expansion are primary growth catalysts in Asia Pacific's switchgear sector
- Asia Pacific represents the fastest-growing regional market, with China and India leading demand for advanced switchgear solutions
Switchgear Market Report Scope
| Report Metric | Details |
|---|---|
| Base Year | 2025 |
| Fastest Growing Segment | DATA CENTERS (End User) |
| Forecast Period | 2025-2030 |
| Growth Rate | CAGR of 5.7% from 2025 to 2030 |
| Largest Segment | AC (Current) |
| Market Size Base Year (Billions) | ~USD 103.57 (2025) |
| Revenue Forecast (Billions) | ~USD 136.65 (2030) |
| Segments Covered | Insulation, Installation, Voltage, Current, End User |
Asia Pacific Switchgear Market Report Segmentation
5 segment dimensions are covered across the global market.
By Insulation
- Air-Insulated Switchgear
- Air-Insulated Switchgears
- Gas-Insulated Switchgear
- Gas-Insulated Switchgears
- Other Insulation Types
By Installation
- Indoor
- Outdoor
By Voltage
- High (Above 36 Kv)
- Low (Up To 1 Kv)
- Medium (2-36 Kv)
By Current
- Ac
- Dc
By End User
- Commercial & Residential
- Data Centers
- Industrial
- Other End Users
- Transmission & Distribution Utilities
- Water & Wastewater
Target Audience
- Switchgear Manufacturers : Develop regional product strategies, identify market entry points, and benchmark competitive positioning across Asia Pacific's high-growth switchgear markets.
- Utility Companies & Grid Operators : Plan infrastructure investments, modernization initiatives, and technology upgrades aligned with Asia Pacific's evolving power distribution and renewable energy integration requirements.
- Industrial & Manufacturing Enterprises : Assess electrical infrastructure needs, procurement strategies, and equipment upgrades to support operations across Asia Pacific's rapidly industrializing economies.
- Investment & Private Equity Firms : Evaluate market growth potential, investment opportunities, and acquisition targets within Asia Pacific's expanding switchgear and power infrastructure sectors.
- Government & Policy Makers : Inform infrastructure planning, renewable energy policies, and grid modernization initiatives with comprehensive market data and growth forecasts for Asia Pacific.
Countries within Asia Pacific - compare and drill down
| Country | 2025 size (native) |
|---|---|
| China | USD 33420 Million |
| India | USD 8680 Million |
| Japan | USD 4670 Million |
| Australia | USD 2710 Million |
| Rest Of Apac | USD 17550 Million |
Country market size visualization
Reasons to Buy this Report
- Regional Market Segmentation : Gain detailed insights into Asia Pacific's switchgear market dynamics with country-level analysis of China, India, Japan, and Australia, enabling targeted market entry and expansion strategies.
- Growth Opportunity Identification : Identify high-growth segments and emerging opportunities across Asia Pacific's diverse industrial, utility, and renewable energy sectors with 6.3% CAGR projections through 2030.
- Competitive Landscape Analysis : Understand regional competitive dynamics, key players, and market positioning strategies specific to Asia Pacific's rapidly evolving switchgear industry.
- Infrastructure Investment Tracking : Monitor urbanization, smart city, and grid modernization initiatives across Asia Pacific that directly influence switchgear demand and procurement patterns.
- Renewable Energy Integration Insights : Access comprehensive data on renewable energy adoption and grid integration requirements driving switchgear innovation and deployment across the Asia Pacific region.
Frequently asked questions
What is the current market size of switchgear in Asia Pacific?
The Asia Pacific switchgear market is valued at USD 49,380 million in 2025 and is projected to reach USD 67,030 million by 2030.
What is the CAGR for Asia Pacific switchgear market?
Asia Pacific's switchgear market is growing at a compound annual growth rate of 6.3% from 2025 to 2030, outpacing the global average.
Which countries drive the Asia Pacific switchgear market?
China and India are the primary growth drivers in Asia Pacific's switchgear market, supported by rapid industrialization and grid modernization initiatives.
What factors are accelerating switchgear demand in Asia Pacific?
Renewable energy integration, smart grid investments, urbanization, and transmission network expansion are key drivers of switchgear demand across Asia Pacific.
How does Asia Pacific's growth compare to the global switchgear market?
Asia Pacific's 6.3% CAGR exceeds the global switchgear market CAGR of 5.7%, making the region the fastest-growing market for switchgear solutions.
RESEARCH METHODOLOGY
The research process for this technical, market-oriented, and commercial study of the 3D printing market included systematic gathering, recording, and analysis of data about companies operating in the market. It involved the extensive use of secondary sources, directories, and databases (Factiva, OANDA) to identify and collect relevant information. In-depth interviews were conducted with various primary respondents, including experts from core and related industries and preferred manufacturers, to obtain and verify critical qualitative and quantitative information, as well as to assess the growth prospects of the market. Key players in the switchgear market were identified through secondary research, and their market rankings were determined through primary and secondary research. This included studying annual reports of top players and interviewing key industry experts, such as CEOs, directors, and marketing executives.
Secondary Research
In the secondary research process, various secondary sources were referred to for identifying and collecting information relevant to this study. Secondary sources include annual reports, press releases, and investor presentations of companies; white papers, certified publications, and articles from recognized authors; directories; and databases. Secondary research was mainly conducted to obtain key information about the supply chain of the industry; the total pool of key players; segmentation of the market according to industry trends, geographic markets, and key developments from market- and technology-oriented perspectives.
Primary Research
During the primary research process, various key sources from the demand side and supply side have been interviewed to gather qualitative and quantitative data for this report. Throughout the comprehensive market engineering process, a combination of top-down and bottom-up approaches, along with multiple data triangulation methods, has been extensively employed to estimate market sizes and forecast all segments and subsegments outlined in this report. Extensive qualitative and quantitative analyses have been undertaken to ensure the integrity of the market engineering process, providing key insights throughout the report. Following completion of the market engineering process, which involved calculations of market statistics, breakdowns, size estimates, forecasts, and data triangulation, thorough primary research has been conducted to gather, verify, and validate critical data points. Primary research has also been conducted to identify market segments, industry trends, and the competitive landscape in the switchgear market.
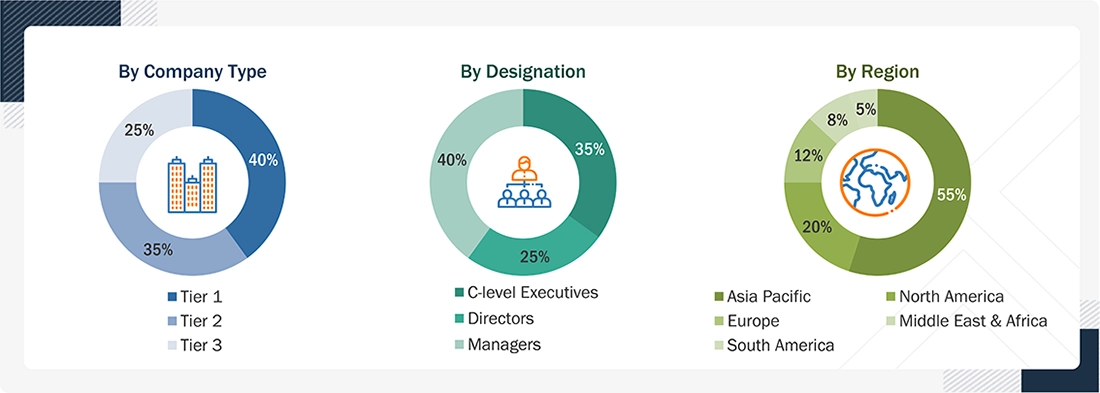
Note: Managers include sales managers, production managers, and regional managers.
Tier 1 company: revenue >USD 5 billion; tier 2 company: revenue between USD 1 and USD 5 billion; and tier 3 company: revenue <USD 1 billion in 2025
To know about the assumptions considered for the study, download the pdf brochure
Market Size Estimation
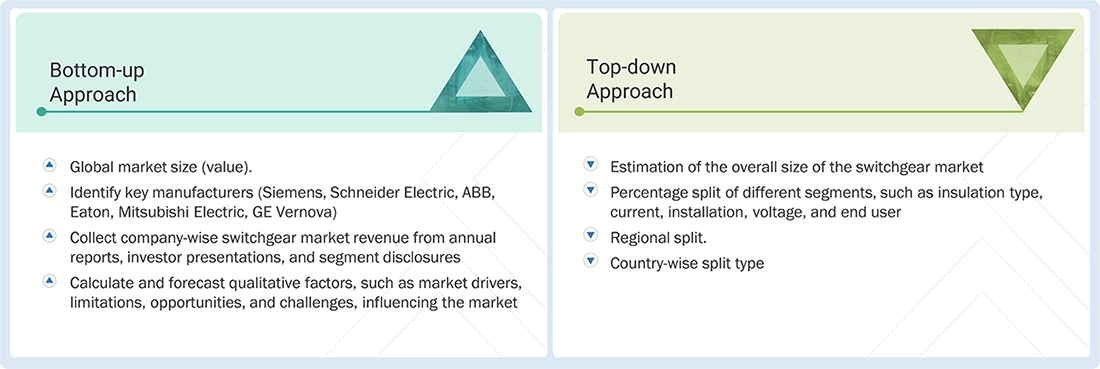
The estimation and validation of switchgear market size have been conducted using a bottom-up approach and top-down approach. These approaches were rigorously employed to ascertain the dimensions of multiple subsegments within the market. The research process comprises the following key stages.
Bottom-up Approach
- Determining the overall value of the switchgear market
- Mapping leading players in the industry, such as Siemens, Schneider Electric, ABB, Eaton, Mitsubishi Electric, GE Vernova, and TOSHIBA CORPORATION
- Gathering segment-specific revenue data for these companies from annual reports, investor presentations, and public disclosures
- Considering key qualitative inputs, including market drivers, restraints, opportunities, and challenges, into the forecasting process
Top-down Approach
- Assessing the total size of the switchgear market
- Breaking this down by segment, covering insulation type, installation, voltage, current, and end user categories
- Allocating market share across regions
- Further refining figures down to individual country-level estimates
Switchgear Market Size: Bottom-up Approach and Top-down Approach
Data Triangulation
The process of determining the overall market size involved the methodologies described earlier, followed by segmenting the market into multiple segments and subsegments. To finalize the comprehensive market analysis and obtain precise statistics for each market segment and subsegment, data triangulation and market segmentation techniques were applied, as appropriate. Data triangulation was accomplished by examining various factors and trends from both the demand and supply perspectives within the ecosystem of the switchgear market.
Market Definition
Switchgear refers to the assembly of electrical disconnect switches, circuit breakers, fuses, relays, and associated control, metering, and protection equipment used to control, protect, isolate, and de-energize electrical equipment within a power system. In simple terms, switchgear acts as the traffic controller of an electrical network, allowing power to be switched on or off, redirected across a network, and, most critically, isolating faulty sections of a circuit during abnormal conditions such as short circuits, overloads, or ground faults. In doing so, it protects expensive upstream and downstream assets, including transformers, generators, motors, and cables, while also safeguarding human operators from the consequences of electrical faults. Functionally, switchgear performs three core roles: control, through routine switching operations that connect or disconnect loads, feeders, or generation sources for operational flexibility and maintenance; protection, by detecting and interrupting fault currents within milliseconds to prevent equipment damage, fire hazards, and cascading outages; and isolation, by providing a visible and safe point of disconnection so equipment can be worked on without risk of accidental re-energization. Switchgear is deployed at virtually every point in the electricity value chain, from the moment power leaves a generating station, through transmission and distribution substations, down to the point of final consumption. This spans generation stations across thermal, nuclear, hydro, and renewable sources, transmission substations handling bulk power transfer at high voltage, and distribution networks stepping down power for end consumers. It is equally critical within industrial facilities for process control and motor protection, commercial and institutional buildings for building-level distribution, data centers for high-reliability redundant power supply to critical IT loads, renewable energy installations for collecting and evacuating power from solar and wind farms, and EV charging infrastructure for managing power distribution at charging stations and hubs. In effect, switchgear is the backbone of electrical safety and reliability, and no modern grid, industrial facility, or building can function without it.
The switchgear market, as covered in this study, encompasses the design, manufacturing, and deployment of switchgear equipment used for the control, protection, and isolation of electrical circuits across power generation, transmission, distribution, and end-use applications globally, and has been segmented and forecast to 2031 across several dimensions. By insulation type, the market covers air-insulated switchgear, which uses ambient air as the insulating and arc-quenching medium and is cost-effective where space is not a constraint; gas-insulated switchgear, which uses SF6 or SF6-alternative gases to offer a compact footprint and higher reliability in space-constrained or harsh environments; and other insulation types, comprising vacuum-insulated, oil-insulated, and fluid-insulated switchgear variants. By installation, the market is segmented into indoor switchgear, deployed within enclosed structures such as substations and industrial or commercial buildings, and outdoor switchgear, built with weatherproof enclosures for open-air deployment at substations and utility yards. By voltage, the market covers low voltage (up to 1 kV) for commercial, residential, and light industrial use; medium voltage (2 kV to 36 kV) for distribution networks, industrial plants, and renewable energy collection systems; and high voltage (above 36 kV) for transmission networks and large-scale power evacuation. By current, the market is segmented into AC, the conventional and dominant current type across the power value chain, and DC, which is gaining relevance with the growth of HVDC transmission, data centers, EV charging, and renewable energy systems. By end user, the market spans power utilities, industrial, commercial, data centers, renewables, EV charging infrastructure, and other end users. By region, the market is geographically assessed across North America, Europe, Asia Pacific, South America, and the Middle East & Africa, capturing regional variations in grid infrastructure investment, industrialization, renewable energy adoption, and regulatory frameworks driving switchgear demand. This scope collectively captures the full breadth of switchgear demand, from utility-scale transmission applications down to distributed, end-use installations, reflecting the equipment's foundational role in enabling safe, reliable, and efficient electricity delivery across the evolving global power landscape.
Key Stakeholders
- Raw Material Suppliers
- Component Manufacturers
- Switchgear Manufacturers/OEMs
- EPC Contractors
- System Integrators/Panel Builders
- Distributors/Electrical Wholesalers
- Transmission & Distribution Utilities
- Renewable Energy Developers
- Power Generation Companies
- Industrial End Users
- Data Center Operators
- Commercial & Residential Users
- Water & Wastewater Operators
- Transportation Sector
- Marine & Offshore Operators
- Standards Organizations
- Testing & Certification Bodies
- Government & Regulatory Authorities
- Environmental Regulators
- Engineering & Technical Consultants
- Digital & Automation Technology Providers
- Service & Maintenance Providers
- Retrofit & Modernization Providers
- Logistics Providers
- Financial Institutions & Project Financiers
- Insurance & Risk Assessment Companies
- Recycling & End-of-Life Providers
- Industry Associations
Report Objectives
- To define, describe, analyze, and forecast the switchgear market based on insulation type, installation, voltage, current, end user, and region
- To describe and forecast the market for five key regions: North America, Europe, Asia Pacific, South America, and the Middle East & Africa, along with their country-level market sizes, in terms of value and volume
- To forecast the switchgear market, by region, in terms of volume
- To give comprehensive details regarding the main factors, obstacles, chances, and sector-specific difficulties impacting the expansion of the switchgear market
- To systematically examine the market for switchgear in terms of each segment's contributions to the market, growth trends, and prospects
- To provide value chain analysis, trends/disruptions impacting customer business, market maps, ecosystem analysis, sustainability and regulatory landscape, pricing analysis, patent analysis, case study analysis, technology analysis, key conferences and events, Porter's five forces analysis, macroeconomic outlook, customer landscape & buyer behavior, regulatory analysis, and AI/Gen AI impact on the market.
- To conduct a strategic analysis of micromarkets1 concerning their respective growth trends, planned expansions, and market share contributions
- To sketch a competitive environment for market participants and assess the potential for stakeholders in the switchgear business
- To benchmark players within the market using the company evaluation quadrant, which analyzes market players on various parameters within the broad categories of business and product strategies
- To compare key market players for the market share, product specifications, and applications
- To strategically profile key players and comprehensively analyze their market ranking and core competencies2
- To track and analyze competitive developments in the switchgear market, such as sales contracts, agreements, investments, expansions, product launches, alliances, mergers, partnerships, joint ventures, collaborations, and acquisitions.
Available customizations:
With the given market data, MarketsandMarkets offers customizations based on the company's specific needs. The following customization options are available for the report:
PRODUCT ANALYSIS
- Product Matrix, which provides a detailed comparison of the product portfolio of each company
COMPANY INFORMATION
- Detailed analyses and profiling of additional market players (up to 5)
Get the Full Switchgear Market Report
Full forecast, segment splits, and company analysis for all Switchgear Market.
- China Switchgear Market
- India Switchgear Market
- Japan Switchgear Market
- Australia Switchgear Market
- Germany Switchgear Market
- UK Switchgear Market
- France Switchgear Market
- Italy Switchgear Market
- Canada Switchgear Market
- US Switchgear Market
- Mexico Switchgear Market
- UAE Switchgear Market
- Saudi Arabia Switchgear Market
- Egypt Switchgear Market
- South Africa Switchgear Market
- Brazil Switchgear Market
- Argentina Switchgear Market
- Rest Of Europe Switchgear Market
- Rest Of Apac Switchgear Market
- GCC Switchgear Market
- Rest Of GCC Switchgear Market
- Rest Of South America Switchgear Market
Need a Tailored Report?
Customize this report to your needs
Get 10% FREE Customization
Customize This Report
