
Australia Therapeutic Drug Monitoring Market (2024-2029)

The Australia Therapeutic Drug Monitoring Market was valued at $13.5 Million in 2024 and projected to reach to $19.9 Million by 2029, representing a compound annual growth rate of 8.1%. Australia's Therapeutic Drug Monitoring market is positioned for sustained growth through 2029, driven by increasing healthcare expenditure and the nation's commitment to precision medicine initiatives.


| Market Size in | USD 26.32 MN |
| Market Forecast in | |
| CAGR | |
| Forecast Period | |
| Units Considered | Value (USD MN) |
Australia Therapeutic Drug Monitoring Market Trends and Insights
- This growth trajectory reflects Australia's advancing healthcare infrastructure and increasing adoption of precision medicine practices across clinical settings.
- Australia's market expansion is driven by rising demand for personalized drug dosing, improved patient outcomes, and regulatory support for laboratory diagnostics. The Australian TDM market benefits from a mature healthcare system with strong pathology networks and government-funded diagnostic services.
- Australia's emphasis on evidence-based medicine and quality assurance in therapeutic drug monitoring has positioned the country as a key market within the Asia Pacific region.
- Between 2024 and 2029, Australia is expected to see accelerated adoption of automated TDM platforms and point-of-care testing solutions, supported by investments in healthcare technology and laboratory modernization..
Key Market Statistics
- CAGR (2024-2029) 8.1% CAGR
- Market Size, 2024 ~USD 13.5 Million
- Forecast, 2029 ~USD 19.9 Million
- Country Australia
Australia Therapeutic Drug Monitoring Market Overview
Market Valuation :
Australia's Therapeutic Drug Monitoring market is valued at USD 13.5 million in 2024, with a projected expansion to USD 19.9 million by 2029, representing a robust 8.1% CAGR.
Healthcare Infrastructure Growth :
Australia's advanced healthcare system and increasing adoption of precision medicine practices are driving significant demand for TDM solutions across hospitals, diagnostic centers, and clinical laboratories.
Personalized Medicine Adoption :
Rising demand for personalized treatment approaches in Australia is accelerating TDM implementation, enabling clinicians to optimize drug dosing and improve patient outcomes across various therapeutic areas.
Regulatory Support :
Australia's regulatory framework and quality standards support the integration of advanced TDM technologies, fostering innovation and market expansion among local and international healthcare providers.
Australia Therapeutic Drug Monitoring Market Dynamics
- The market benefits from Australia's sophisticated diagnostic infrastructure and growing clinical awareness of TDM's role in optimizing therapeutic outcomes.
- Healthcare providers across major cities and regional centers are increasingly implementing TDM protocols to enhance patient safety and treatment efficacy.
- Continued investment in laboratory automation and digital health integration will further accelerate market penetration.
- The convergence of aging population demographics and rising chronic disease prevalence creates sustained demand for personalized drug monitoring solutions throughout the forecast period..
Market Ecosystem
Related Ecosystem
In Vitro Diagnostics
- Polymerase Chain Reaction (PCR)
- Enzyme-Linked Immunosorbent Assay (ELISA)
- Dna Microarrays
- Assay Kits
- Microarrays
- ROCHE HOLDINGS AG
- Thermo Fisher Scientific Inc.
- Danaher Corporation
- Abbott Laboratories
- Biomerieux s.a.
Medical Devices
- Polymerase Chain Reaction (PCR)
- Magnetic Resonance Imaging (MRI)
- Disposable Autoinjectors
- Pulse Oximeters
- Blood Pressure Monitors
- Medtronic plc
- Abbott Laboratories
- Stryker Corporation
- Becton, Dickinson and Company
- CONMED Corporation
Key Takeaways
- Australia's TDM market is valued at USD 13.5 million in 2024, with projected growth to USD 19.9 million by 2029, representing an 8.1% CAGR.
- Australia's mature healthcare infrastructure and government-funded pathology services provide a strong foundation for TDM market expansion.
- Precision medicine adoption and personalized drug dosing initiatives are key growth drivers in Australia's therapeutic drug monitoring sector.
- Australia is expected to lead Asia Pacific adoption of automated TDM platforms and point-of-care testing technologies through 2029.
Therapeutic Drug Monitoring Market Report Scope
| Report Metric | Details |
|---|---|
| Base Year | 2024 |
| Fastest Growing Segment | ONCOLOGY (Therapeutic Area) |
| Forecast Period | 2024-2029 |
| Growth Rate | CAGR of 8.4% from 2024 to 2029 |
| Largest Segment | CONSUMABLES (Product) |
| Market Size Base Year (Billions) | ~USD 2.3 (2024) |
| Revenue Forecast (Billions) | ~USD 3.44 (2029) |
| Segments Covered | Product, Type, Technology, Drug Class, Therapeutic Area, Specimen, End User |
Australia Therapeutic Drug Monitoring Market Report Segmentation
7 segment dimensions are covered across the global market.
By Product
- Consumables
- Equipment
By Type
- Chemiluminescence Immunoassays
- Chromatography & Ms Detectors
- Clinical Chemistry Analyzers
- Colorimetric Immunoassays
- Enzyme-Linked Immunosorbent Assays
- Fluorescence Immunoassays
- Gas Chromatography-Mass Spectrometry
- Immunoassay Analyzers
- Liquid Chromatography- Mass Spectrometry
- Other Immunoassays
By Technology
- Chromatography-Ms
- Immunoassays
- Other Technologies
By Drug Class
- Antiarrhythmic Drugs
- Antibiotic Drugs
- Antiepileptic Drugs
- Bronchodilator Drugs
- Immunosuppressant Drugs
- Other Drugs
- Psychoactive Drugs
By Therapeutic Area
- Cardiology
- Infectious Diseases
- Neurological Disorders
- Oncology
- Other Therapeutic Areas
By Specimen
- Blood
- Other Specimens
- Saliva
By End User
- Commercial & Private Laboratories
- Hospital Laboratories
- Other End Users
AUSTRALIA: THERAPEUTIC DRUG MONITORING MARKET, BY END USER, 2022–2029
| Segment | 2022 | 2023 | 2024 | 2025 | 2026 | 2027 | 2028 | 2029 | CAGR (%) |
|---|---|---|---|---|---|---|---|---|---|
| COMMERCIAL & PRIVATE LABORATORIES | 4.6 | 4.9 | 5.2 | 5.6 | 6 | 6.4 | 6.9 | 7.4 | 7.2 |
| HOSPITAL LABORATORIES | 8.2 | 8.8 | 9.4 | 10.2 | 11 | 11.9 | 12.9 | 14.1 | 8.4 |
| OTHER END USERS | 1.9 | 2 | 2.1 | 2.2 | 2.4 | 2.5 | 2.7 | 2.8 | 6.1 |
| TOTAL | 14.7 | 15.7 | 16.8 | 18 | 19.3 | 20.8 | 22.5 | 24.3 | 7.7 |
Target Audience
- In Vitro Diagnostics Manufacturers : IVD companies need Australia-specific market data to develop localized product strategies, identify distribution partnerships, and assess market entry feasibility in the growing TDM segment.
- Healthcare System Administrators : Hospital and pathology network leaders require market insights to justify TDM infrastructure investments, optimize laboratory operations, and improve patient care delivery across Australian healthcare facilities.
- Pharmaceutical Companies : Pharma organizations need Australia market intelligence to support precision medicine initiatives, develop companion diagnostics, and enhance drug safety monitoring programs for local patient populations.
- Clinical Laboratory Operators : Pathology and diagnostic laboratory managers require detailed market forecasts and competitive analysis to guide technology investments, service expansion, and revenue growth strategies in Australia.
- Healthcare Investors & Consultants : Investment firms and management consultants need Australia-specific TDM market data to evaluate investment opportunities, assess sector growth potential, and support due diligence activities.
Reasons to Buy this Report
- Market-Specific Growth Data : Access detailed Australia-specific market sizing, CAGR analysis, and five-year forecasts to inform strategic planning and investment decisions in the local TDM sector.
- Competitive Landscape Intelligence : Understand the competitive dynamics, key players, and market positioning strategies specific to Australia's healthcare and diagnostic laboratory sectors.
- Regulatory & Reimbursement Insights : Gain comprehensive knowledge of Australia's healthcare regulations, reimbursement policies, and compliance requirements affecting TDM market operations and growth.
- Clinical Adoption Trends : Identify emerging adoption patterns across Australian hospitals, pathology networks, and clinical settings to optimize market entry and expansion strategies.
- Strategic Partnership Opportunities : Discover potential collaboration and partnership opportunities with Australian healthcare providers, diagnostic centers, and technology vendors in the TDM ecosystem.
Frequently asked questions
What is the current size of Australia's Therapeutic Drug Monitoring market?
Australia's Therapeutic Drug Monitoring market was valued at USD 13.5 million in 2024 and is projected to reach USD 19.9 million by 2029.
What is the expected growth rate for Australia's TDM market?
Australia's TDM market is expected to grow at a compound annual growth rate (CAGR) of 8.1% from 2024 to 2029.
What factors are driving growth in Australia's Therapeutic Drug Monitoring market?
Key drivers include increasing adoption of precision medicine, rising demand for personalized drug dosing, regulatory support for laboratory diagnostics, and investments in healthcare technology and laboratory modernization.
How does Australia's TDM market compare to other Asia Pacific countries?
Australia's mature healthcare infrastructure, government-funded pathology networks, and emphasis on evidence-based medicine position it as a leading TDM market within the Asia Pacific region.
What technologies are expected to drive Australia's TDM market growth through 2029?
Automated TDM platforms, point-of-care testing solutions, and laboratory information systems are expected to be key technology drivers in Australia's market expansion through 2029.
RESEARCH METHODOLOGY
The study involved major activities in estimating the current market size for the therapeutic drug monitoring market. Exhaustive secondary research was done to collect information on the therapeutic drug monitoring industry. The next step was to validate these findings, assumptions, and sizing with industry experts across the value chain using primary research. Different approaches, such as top-down and bottom-up, were employed to estimate the total market size. After that, the market breakup and data triangulation procedures were used to estimate the market size of the segments and subsegments of the therapeutic drug monitoring market.
Secondary Research
The market for the companies offering therapeutic drug monitoring solutions is arrived at by secondary data available through paid and unpaid sources, analyzing the product portfolios of the major companies in the ecosystem, and rating the companies by their performance and quality. Various sources were referred to in the secondary research process to identify and collect information for this study. The secondary sources include annual reports, press releases, investor presentations of companies, white papers, journals, certified publications, and articles from recognized authors, directories, and databases.
In the secondary research process, various secondary sources were referred to for identifying and collecting information related to the study. Secondary sources included annual reports, press releases, and investor presentations of blockchain vendors, forums, certified publications, and whitepapers. The secondary research was used to obtain critical information on the industry’s value chain, the total pool of key players, market classification, and segmentation from the market and technology-oriented perspectives.
Primary Research
In the primary research process, various primary sources from both the supply and demand sides were interviewed to obtain qualitative and quantitative information for this report. The primary sources from the supply side included industry experts, such as Chief Executive Officers (CEOs), Vice Presidents (VPs), marketing directors, technology and innovation directors, and related key executives from various key companies and organizations operating in the blockchain market. After the complete market engineering (calculations for market statistics, market breakdown, market size estimations, market forecasting, and data triangulation), extensive primary research was conducted to gather information and verify and validate the critical numbers arrived at. Primary research was also conducted to identify the segmentation types, industry trends, competitive landscape of therapeutic drug monitoring solutions offered by various market players, and key market dynamics, such as drivers, restraints, opportunities, challenges, industry trends, and key player strategies.
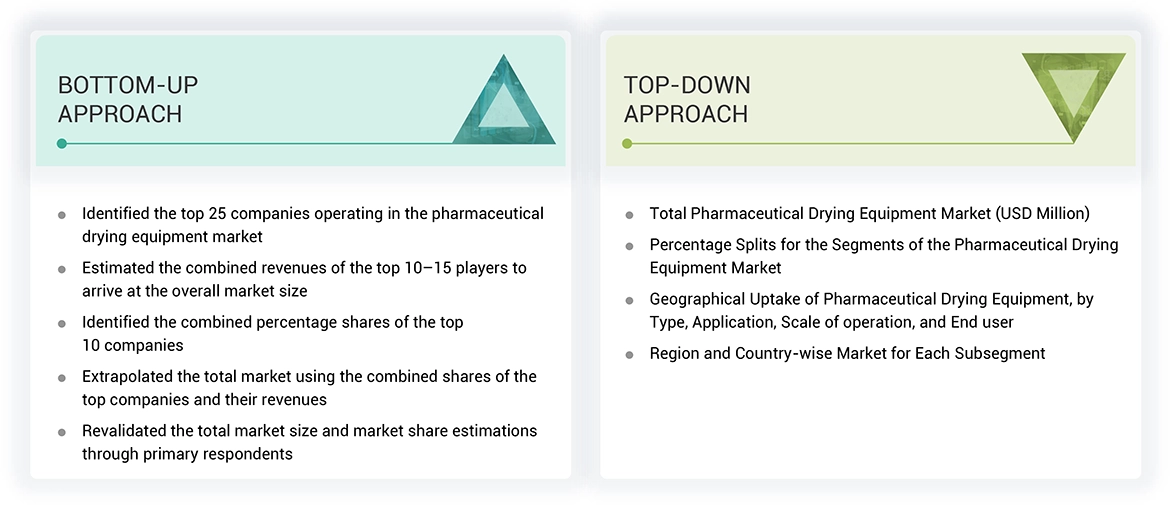
In the complete market engineering process, the top-down and bottom-up approaches were extensively used, along with several data triangulation methods, to perform the market estimation and market forecasting for the overall market segments and subsegments listed in this report. Extensive qualitative and quantitative analysis was performed on the complete market engineering process to list the key information/insights throughout the report.
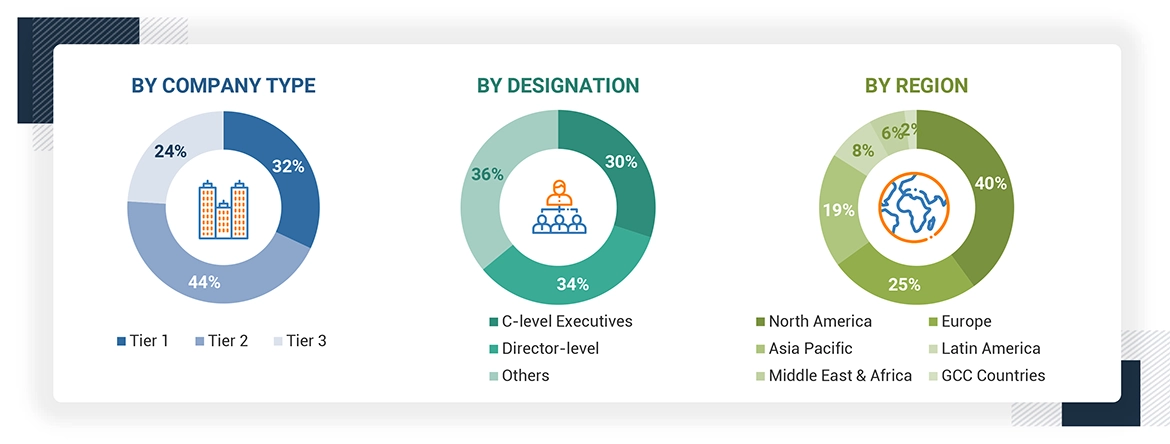
*C-level primaries include CEOs, CFOs, COOs, and VPs.
*Others include sales managers, marketing managers, business development managers, product managers, distributors, and suppliers.
Note: Companies are classified into tiers based on their total revenue. As of 2023, Tier 1 = >USD 10.00 billion, Tier 2 = USD 1.00 billion to USD 10.00 billion, and Tier 3 = < USD 1.00 billion.
Source: MarketsandMarkets Analysis
To know about the assumptions considered for the study, download the pdf brochure
Market Size Estimation
Both top-down and bottom-up approaches were used to estimate and validate the total size of the cell culture market. These methods were also used extensively to estimate the size of various subsegments in the market. The research methodology used to estimate the market size includes the following:
Data Triangulation
After arriving at the overall market size using the market size estimation processes explained above, the market was split into several segments and subsegments. The data triangulation and market breakup procedures were employed, wherever applicable, to complete the overall market engineering process and arrive at the exact statistics of each market segment and subsegment. The data was triangulated by studying various factors and trends from both the demand and supply sides.
Market Definition
Therapeutic drug monitoring (TDM) measures the concentration of specific drugs in body fluids, which helps manage drug therapy to cure, alleviate, or prevent diseases. TDM is used mainly for monitoring drugs with narrow therapeutic ranges, drugs with marked pharmacokinetic variability, medications for which target concentrations are difficult to monitor, and drugs known to cause therapeutic and adverse effects.
Stakeholders
- Therapeutic Drug Monitoring Product Manufacturers
- Healthcare Service Providers
- Research Associations
- Research Institutes
- Venture Capitalists and Investors
- Various Research and Consulting Companies
- Pharmaceutical and Biopharmaceutical Companies
- Diagnostic Associations
- Clinical Laboratories
- Suppliers/Distributors of Therapeutic Drug Monitoring Products and Consumables
- Hospitals
- Government and Non-governmental Regulatory Authorities
Report Objectives
- To define, describe, and forecast the therapeutic drug monitoring market based on – product, technology, drug class, therapeutic area, specimen, end user, and region.
- To provide detailed information about the major factors (drivers, opportunities, restraints, and challenges) influencing the growth of the market.
- To analyze opportunities for stakeholders by identifying the high-growth segments of the market
- To forecast the size of the market segments with respect to six main regions: North America, Europe, Asia Pacific, Latin America, the Middle East & Africa, and GCC Countries.
- To analyze subsegments of the market with respect to individual growth trends, prospects, and contributions to the overall market.
- To profile the key players and comprehensively analyze their market sizes and core competencies
- To track and analyze competitive developments such as product enhancements and new product launches, acquisitions, and partnerships & collaborations in the market globally.
Get the Full Therapeutic Drug Monitoring Market Report
Full forecast, segment splits, and company analysis for all Therapeutic Drug Monitoring Market.
- India Therapeutic Drug Monitoring Market
- Rest Of Europe Therapeutic Drug Monitoring Market
- Rest Of Asia Pacific Therapeutic Drug Monitoring Market
- Canada Therapeutic Drug Monitoring Market
- US Therapeutic Drug Monitoring Market
- Germany Therapeutic Drug Monitoring Market
- UK Therapeutic Drug Monitoring Market
- France Therapeutic Drug Monitoring Market
- Italy Therapeutic Drug Monitoring Market
- Spain Therapeutic Drug Monitoring Market
- Japan Therapeutic Drug Monitoring Market
- China Therapeutic Drug Monitoring Market
Need a Tailored Report?
Customize this report to your needs
Get 10% FREE Customization
Customize This Report
