
Plant-based Protein Market

Plant-based Protein Market by Source (Soy, Wheat, Pea, Canola, Rice, Oats, Potato, Faba Bean), Type (Concentrates, Isolates, Textured, Milled Protein Flours, Starch-rich Protein Flours), Application, Nature, Form, Function, and Region - Global Forecast to 2030


OVERVIEW
Source: Secondary Research, Interviews with Experts, MarketsandMarkets Analysis
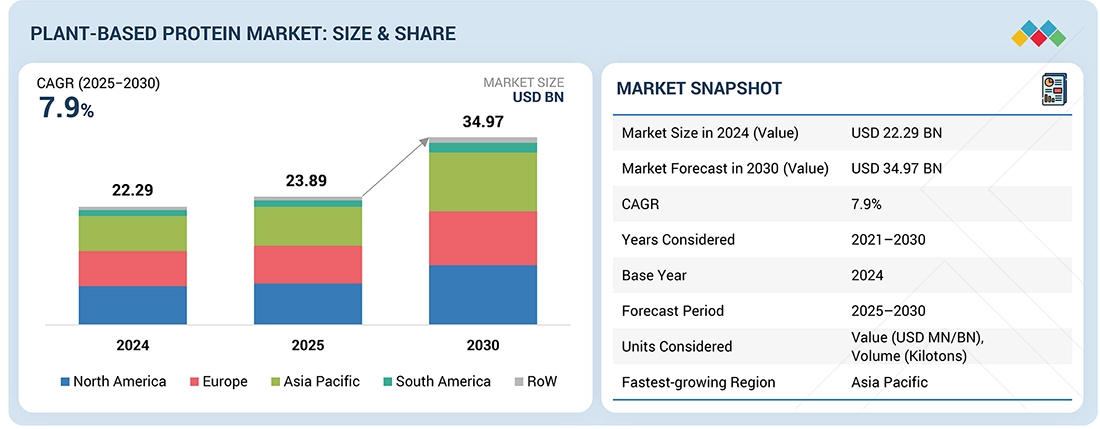
The plant-based protein market is projected to reach USD 34.97 billion by 2030 from USD 23.89 billion in 2025, at a CAGR of 7.9% from 2025 to 2030. The plant-based protein market has experienced significant growth as consumers seek alternatives to traditional animal-derived protein sources. Concerns about health, ethics, environmental awareness, and personal dietary preferences drive this trend.
Market Size and Forecast:
- Market Size Value in 2024: USD 22.29 Billion
- Market Size Value in 2025: USD 23.89 Billion
- Revenue Forecast in 2030: USD 34.97 Billion
- Growth Rate: CAGR of 7.9% from 2025 to 2030
- Data available from 2020 to 2030
- Base year: 2024
- Forecast period: 2025–2030
- North America is expected to account for a 32.5% share of the plant-based protein market in 2025.
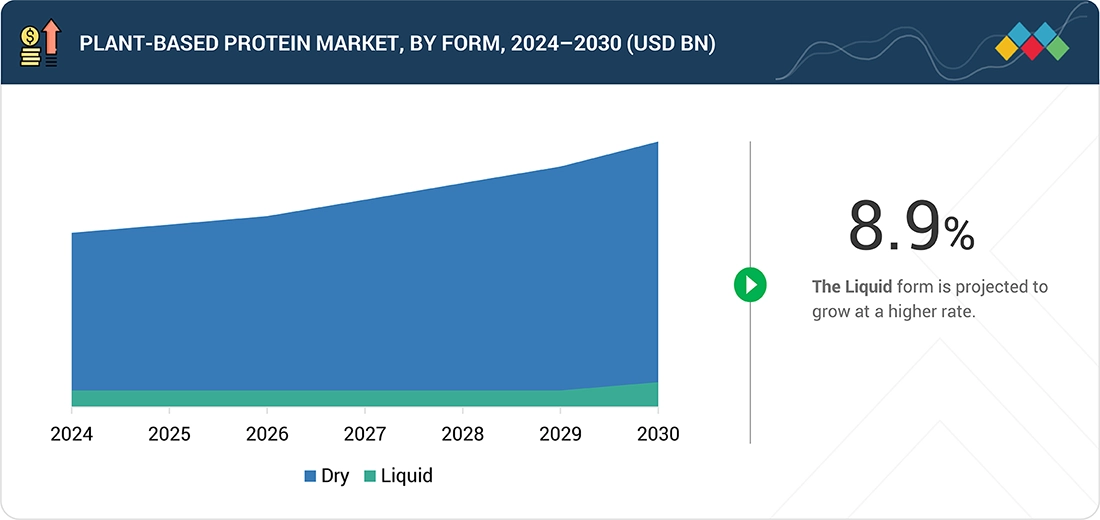
- The dry segment is expected to dominate the market, growing at a CAGR of 7.8%.
Key Market Trends and Insights
- By Type: Rising demand for soy protein, pea protein, wheat protein, and other plant-derived protein ingredients across food, beverage, sports nutrition, and dietary supplement applications is driving significant growth in the plant-based protein market.
-
Growth Drivers: Growing consumer preference for sustainable and healthy diets, increasing awareness of the nutritional benefits of plant proteins, rising vegan and flexitarian populations, and expanding use of plant-based ingredients in food formulations are accelerating market growth.
- Growing Trends: Food manufacturers are increasingly investing in clean-label, non-GMO, allergen-friendly, and high-protein product innovations. Advances in protein extraction technologies and the development of meat alternatives, dairy alternatives, and functional foods are further shaping market expansion.
- Growth Opportunities: Increasing demand for alternative protein sources, expanding plant-based food and beverage industries, growing investments in protein innovation, rising environmental concerns associated with animal protein production, and strong consumer interest in sustainable nutrition are creating substantial opportunities in the plant-based protein market.
KEY TAKEAWAYS
- North America is expected to account for a 32.5% share of the plant-based protein market in 2025.
- By source, the faba beans segment is expected to register the highest CAGR of 11.5%.
- By type, the starch-rich protein flours segment is projected to grow at the fastest rate from 2025 to 2030.
- By nature, the conventional segment is expected to dominate the market.
- By form, the dry segment is expected to dominate the market, growing at a CAGR of 7.8%.
- By application, the feed segment will grow at the fastest rate during the forecast period.
- ADM, Cargill Incorporated, and IFF were identified as star players in the plant-based protein market, given their strong market share and extensive product footprint.
- BENEO GmbH, SOTEXPRO, and Axiom Foods, Inc., among others, have distinguished themselves among startups and SMEs by securing strong footholds in specialized niche areas, underscoring their potential as emerging market leaders.
The plant-based protein market has experienced a surge in popularity. This growing popularity and interest can be attributed to rising health concerns, ethical considerations, environmental consciousness, and dietary preferences. Many individuals opt for plant-based protein products due to allergies, dietary restrictions, or a desire for a healthier lifestyle. Additionally, the demand for low-calorie and low-fat options has led to the prominence of plain and unsweetened formulations within the plant-based protein sector.
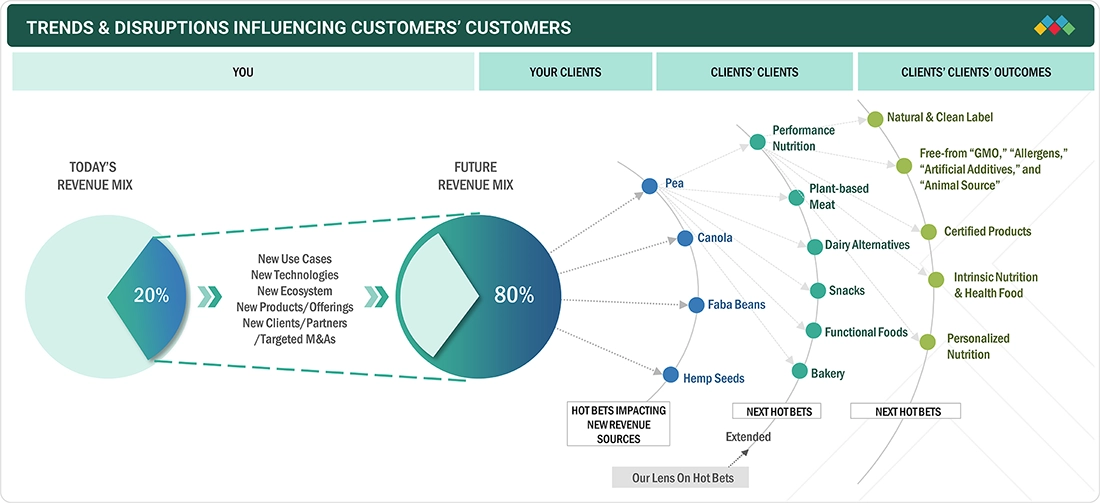
TRENDS & DISRUPTIONS IMPACTING CUSTOMERS' CUSTOMERS
The impact on consumer business emerges from customer trends or disruptions. Hotbets are new sources of plant-based protein ingredients, and plant-based product suppliers are clients of plant-based protein ingredient manufacturers. Shifts, which are changing trends or disruptions, will impact the revenues of end users. The revenue impact on end users will affect the revenue of hotbets, which will further affect the revenues of plant-based protein ingredient manufacturers.
Source: Secondary Research, Interviews with Experts, MarketsandMarkets Analysis
MARKET DYNAMICS
Level
-
Growing interest in health-centric food and beverages

-
Increased preference for meat alternatives

Level
-
Allergies associated with plant-based protein sources

-
Nutritional and vitamin deficiencies among vegans

Level
-
Effective marketing strategies and correct positioning of plant-based proteins

-
Focus on aquatic plants as new and emerging sources of protein

Level
-
Concerns related to taste and texture offered by plant-based protein

-
Economic constraints

Source: Secondary Research, Interviews with Experts, MarketsandMarkets Analysis
Driver: Growing interest in health-centric food and beverages
Changing consumer preferences are driving the growth of the plant-based protein market, with a significant portion of the millennial population in Western countries shifting toward healthier dietary choices. The trend toward organic and plant-based food products is on the rise, driven by their perceived health benefits, particularly for digestive health and preventing obesity and chronic diseases.
Restraint: Allergies associated with plant-based protein sources
Plant-based foods and beverages have functional health benefits, contain essential minerals, and trigger various allergies. For instance, soybeans are rich in nutrient content, such as vitamins, minerals, and proteins; however, the anti-nutritional components present in soy could cause allergies.
Opportunity: Effective marketing strategies and correct positioning of plant-based proteins
Effective marketing strategies and precise positioning are pivotal for driving the sales and growth of plant-based protein products. By utilizing diversified and targeted marketing strategies, businesses can generate demand among various consumer groups, including health-focused individuals, athletes, fitness enthusiasts, vegetarians, vegans, and those pursuing sustainable and eco-friendly dietary choices.
Challenge: Concerns related to taste and texture offered by plant-based protein
Consumers demand high-quality products offering consistent taste and texture, driven by a growing awareness of health and environmental concerns. As a result, they seek more nutritious, clean-label, and sustainable options. While plant-based protein presents numerous advantages, one of the primary hurdles in its adoption is achieving a satisfying taste and texture in the final product.
Plant-based Protein Market: COMMERCIAL USE CASES ACROSS INDUSTRIES
| COMPANY | USE CASE DESCRIPTION | BENEFITS |
|---|---|---|
 |
In June 2025, Roquette expanded its NUTRALYS plant protein portfolio with the launch of two new textured protein solutions: NUTRALYS T WHEAT 600L (textured wheat protein) and NUTRALYS T PEA 700XC (textured pea protein). | These innovations mark Roquette’s entry into textured wheat and strengthen its position in the plant-based space. |
 |
In November 2024, Burcon partnered with Puratos to develop innovative canola protein applications for the bakery and patisserie sectors. | The collaboration aims to deliver healthier, sustainable, and cost-effective alternatives to traditional ingredients such as eggs. |
Logos and trademarks shown above are the property of their respective owners. Their use here is for informational and illustrative purposes only.
MARKET ECOSYSTEM
The market map of the ecosystem is categorized into demand-side and supply-side companies. The plant-based protein market is a dynamic and rapidly expanding ecosystem characterized by diverse stakeholders and innovative products. Established companies and agile startups are central to this market, developing alternatives to meat, dairy, and eggs using plant-derived proteins such as soy, peas, rice, faba beans, and hemp.
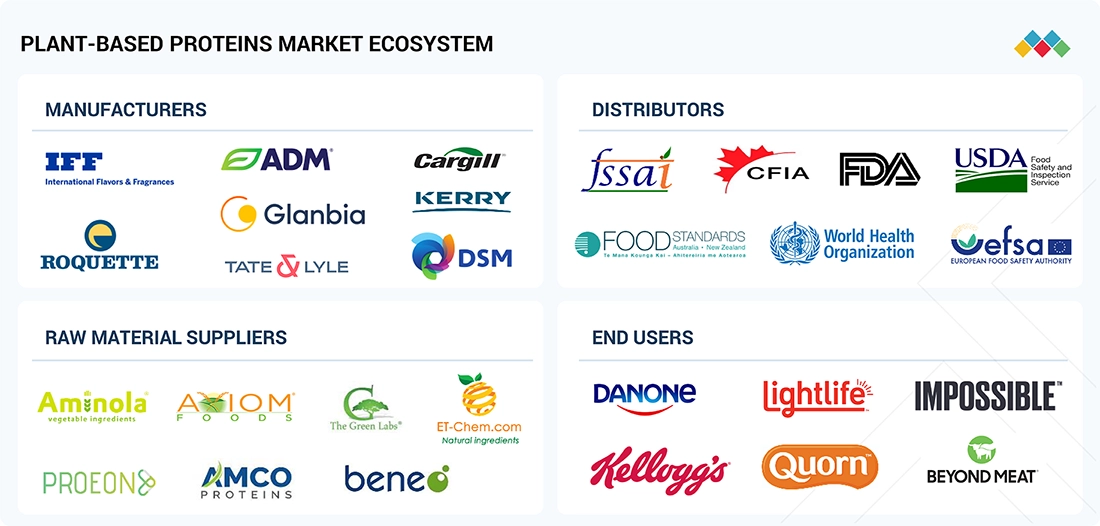
Logos and trademarks shown above are the property of their respective owners. Their use here is for informational and illustrative purposes only.
MARKET SEGMENTS
Source: Secondary Research, Interviews with Experts, MarketsandMarkets Analysis
Plant-based Protein Market, By Source
Pea protein is highly valued in the plant-based protein market for its balanced nutrient profile and growing demand for allergen-free products. It is rich in essential amino acids, particularly branched-chain amino acids (BCAAs), which support muscle growth and repair, providing a significant demand in the performance nutrition application.
Plant-based Protein Market, By Type
Plant protein isolates are favored for their excellent digestibility and versatility in various food products. They are typically produced from the de-oiled cake of legumes such as soy and peas and are considered one of the safest protein sources, suitable even for infant foods. Due to their high protein concentration, plant-based proteins show promising growth potential for isolates.
Plant-based Protein Market, By Form
The dry form of plant-based protein is experiencing a surge in market demand due to several key factors. Dry plant-based proteins have a longer shelf life than their liquid counterparts. They reduce waste and improve convenience for retailers and consumers. Additionally, they are easier to transport and store, which reduces logistical costs.
REGION
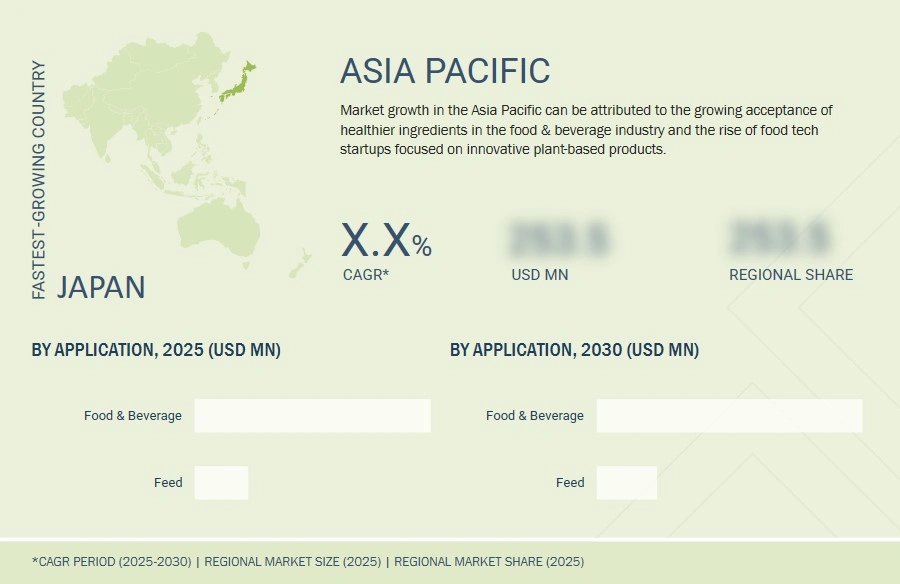
Asia Pacific market is projected to grow at a competitive rate during the forecast period
The Asia Pacific plant-based protein market is growing rapidly due to increased health awareness, a rising vegetarian and vegan population, and consumer spending on premium products. Dominated by China, India, Japan, and Australia, consumers opt for clean-label, nature-based ingredients in their healthy diets. Additionally, the perceived benefits of the health environment and religious considerations significantly contribute to adopting vegan and vegetarian diets in these regions. The rising health concerns in Asia have also led people to reduce their meat intake and add plant-based foods and proteins.
Plant-based Protein Market: COMPANY EVALUATION MATRIX
In the plant-based protein market matrix, Cargill, Incorporated (Star) leads with a strong market share and extensive product offerings. The company offers a diverse range of plant-based protein products, including pea protein, soy protein, and wheat protein. Its portfolio caters to various applications, such as meat substitutes, dairy alternatives, and nutritional products. DSM-Firmenich (Emerging Leader) is gaining visibility with its plant-based protein offerings, strengthening its position through innovation and niche portfolio.

Source: Secondary Research, Interviews with Experts, MarketsandMarkets Analysis
KEY MARKET PLAYERS
MARKET SCOPE
| REPORT METRIC | DETAILS |
|---|---|
| Market Size in 2024 (Value) | USD 22.29 Billion |
| Market Forecast in 2030 (Value) | USD 34.97 Billion |
| Growth Rate | CAGR of 7.9% from 2025-2030 |
| Years Considered | 2021-2030 |
| Base Year | 2024 |
| Forecast Period | 2025-2030 |
| Units Considered | Value (USD MN/BN), Volume (Kilotons) |
| Report Coverage | Revenue forecast, market share, competitive landscape, growth factors, and trends |
| Segments Covered |
|
| Regions Covered | North America, Europe, Asia Pacific, South America, Rest of the World (Middle East & Africa) |
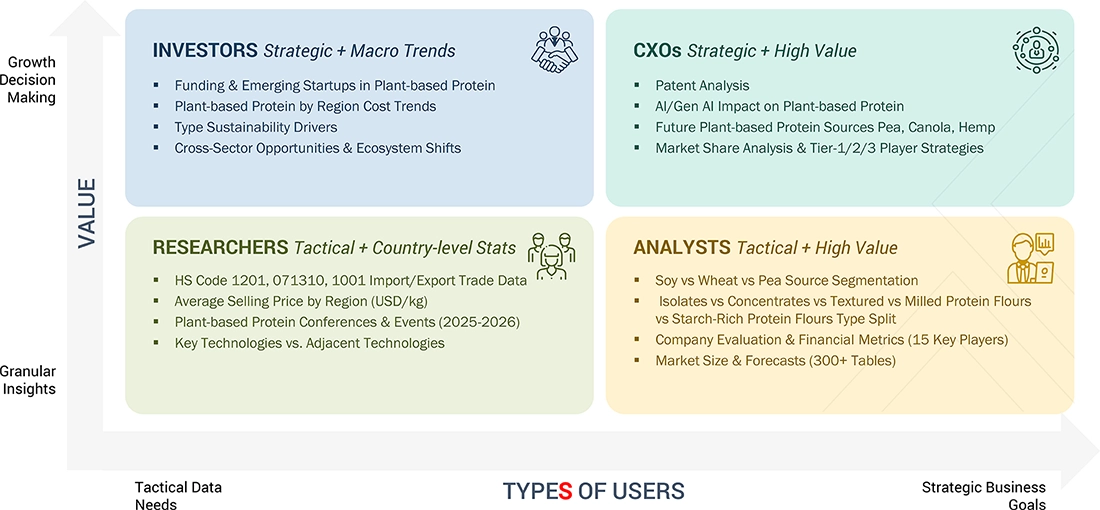
WHAT IS IN IT FOR YOU: Plant-based Protein Market REPORT CONTENT GUIDE
DELIVERED CUSTOMIZATIONS
We have successfully delivered the following deep-dive customizations:
| CLIENT REQUEST | CUSTOMIZATION DELIVERED | VALUE ADDS |
|---|---|---|
| Asia Pacific-based Plant-based Protein Manufacturers |
|
|
| Plant-based Application Segment Assessment |
|
|
RECENT DEVELOPMENTS
- November 2024: Ingredion Incorporated (US) and Lantmännen formed a strategic partnership to advance plant-based proteins, focusing on sustainably sourced yellow pea protein isolates. Lantmännen will invest over USD 108.2 million (€100 million) in a new Swedish facility, while Ingredion brings expertise in product development and market access, targeting Europe’s fast-growing alternative protein sector
- November 2024: Burcon (Canada) partnered with Puratos to develop innovative canola protein applications for the bakery and patisserie sectors. Leveraging Burcon’s Puratein canola protein and Puratos’s global R&D expertise, the collaboration aims to deliver healthier, sustainable, and cost-effective alternatives to traditional ingredients such as eggs
- November 2024: BENEO (Germany) showcased scalable plant-based and hybrid solutions using texturates from meatless and faba bean protein concentrates at Fi Europe to accelerate product development. By covering ingredient formulation to final products, BENEO helps manufacturers reduce costs and time-to-market while maintaining quality, taste, and texture for evolving consumer preferences
- February 2024: Roquette Frères (France) expanded its NURRALYS plant protein portfolio by introducing four new pea protein ingredients, including isolates, hydrolysates, and textured variants. These multi-functional pea proteins are designed to address formulation challenges in plant-based foods and high-protein nutritional products, offering opportunities for innovation in applications such as nutritional bars, protein drinks, and plant-based meat and dairy alternatives
Table of Contents
 Exclusive indicates content/data unique to MarketsandMarkets and not available with any competitors.
Methodology
The study involved two major approaches in estimating the current size of the plant-based protein market. Exhaustive secondary research collected information on the market, source, type, application, nature, and form segments. The next step was to validate these findings, assumptions, and sizing with industry experts across the value chain through primary research. Both top-down and bottom-up approaches were employed to estimate the complete market size. Data triangulation was used to estimate the market size of segments and subsegments.
Secondary Research
This research study involved extensive secondary sources—directories and databases such as Bloomberg Businessweek and Factiva—to identify and collect valuable information for a technical, market-oriented, and commercial market study. In the secondary research process, sources such as annual reports, press releases & investor presentations of companies, white papers, food journals, certified publications, articles from recognized authors, directories, and databases were referred to identify and collect information. Secondary research was mainly used to obtain key information about the industry’s supply chain, the pool of key players, and market classification and segmentation as per the industry trends to the bottom-most level, regional markets, and key developments from market- and technology-oriented perspectives.
Primary Research
Extensive primary research was conducted after obtaining information regarding the plant-based protein market scenario through secondary research. Several primary interviews were conducted with market experts from the demand and supply sides across major countries of North America, Europe, Asia Pacific, South America, and the Rest of the World. Primary data was collected through questionnaires, emails, and telephonic interviews. The primary sources from the supply side included various industry experts, such as chief officers (CXOs), vice presidents (VPs), directors from business development, marketing, research, and development teams, and related key executives from distributors and key opinion leaders.
Primary interviews were conducted to gather insights such as market statistics, data on revenue collected from the products and services, market breakdowns, market size estimations, market forecasting, and data triangulation. Primary research also helped understand the source, type, application, nature, form, and region trend. Stakeholders from the demand side, such as plant-based food manufacturers and feed & pet-food manufacturers, were interviewed to understand the buyers’ perspective on the suppliers, products, and their business outlook, which will affect the overall market.

Note: The three tiers of the companies are defined based on their total revenues in 2023 or 2024,
as per the availability of financial data: Tier 1: Revenue > USD 1 billion; Tier 2: USD 100
million = revenue = USD 1 billion; Tier 3: Revenue < USD 100 million
To know about the assumptions considered for the study, download the pdf brochure
|
COMPANY NAME |
DESIGNATION |
|
ADM (US) |
Product Development Manager |
|
Wilmar International Ltd (Singapore) |
Senior R&D Scientist |
|
Roquette Frères (France) |
Marketing Director |
|
Kerry Group PLC (Ireland) |
Sales Head |
|
International Flavors & Fragrances Inc. (US) |
Senior Research Executive |
|
Tate & Lyle (UK) |
Business Development Manager |
Market Size Estimation
The top-down and bottom-up approaches were used to estimate and validate the total size of the plant-based protein market. These approaches were also used extensively to determine the size of various subsegments in the market. The research methodology used to estimate the market size includes the following details:
- The key players in the industry and the overall markets were identified through extensive secondary research.
- All shares, splits, and breakdowns were determined using secondary sources and verified through primary sources.
- All possible parameters that affect the market covered in this research study were accounted for, viewed in extensive detail, verified through primary research, and analyzed to obtain final quantitative and qualitative data.
- The research included the study of reports, reviews, and newsletters of top market players, along with extensive interviews for opinions from leaders, such as CEOs, directors, and marketing executives.
Plant-based Protein Market : Top-Down and Bottom-Up Approach

Data Triangulation
After determining the overall market size from the estimation process explained above, the total market was split into several segments and subsegments. The data triangulation procedure was employed, wherever applicable, to estimate the overall plant-based protein market and arrive at the exact statistics for all segments and subsegments. The data was triangulated by studying various factors and trends from the demand and supply sides. The market size was also validated using both the top-down and bottom-up approaches.
Market Definition
Plant-based protein is derived from plant-based sources, such as pulses, grains, and seeds. Plant-based protein sources include soy, wheat, peas, faba beans, canola, rice, and potatoes. Proteins are polymers of amino acids used in various applications for their nutritional and functional properties. Their potential to increase the nutritional level in a healthy diet makes them one of the key ingredients in the food and feed industries.
Milled protein flours are plant protein products with enhanced protein content (20–80%) and reduced starch levels (10–40%), produced through conventional milling combined with protein concentration techniques to achieve specific functional and nutritional profiles.
Starch-rich protein flours are plant-based flour products characterized by moderate protein content (15–35%) with substantial starch retention (35–55%), produced through mild processing techniques that preserve the natural macronutrient balance of the source material.
Stakeholders
- Raw material suppliers of plant-based protein
- Intermediate stakeholders, including distributors, retailers, associations, regulatory bodies, and others
- Manufacturers and traders of plant-based protein ingredients, such as soy, wheat, peas, canola, oats, rice, and potatoes
- Manufacturers and traders of food products, including dairy alternatives, meat alternatives, bakery products, nutritional products, convenience foods, and other food applications
- Manufacturers and traders of non-food applications, such as feed and pet food
- Government organizations, institutes, and research organizations
-
Associations and Industry Bodies:
- Food and Agriculture Organization (FAO)
- United States Department of Agriculture (USDA)
- U.S. Food and Drug Administration (FDA)
- European Food Safety Authority (EFSA)
- European Association of Specialty Feed Ingredients and their Mixtures (FEFANA)
- Organization for Economic Co-operation and Development (OECD)
- Plant-based Food Associations (PBFA)
- United Soybean Board (USB)
- European Plant-based Foods Association (ENSA)
- European Vegetable Protein Association (EUVEPRO)
- Food Standards Australia New Zealand (FSANZ)
Report Objectives
- To determine and project the size of the plant-based protein market based on source, type, application, nature, form, function (qualitative), and region over five years, ranging from 2025 to 2030
- To identify the attractive opportunities in the market by determining the largest and fastest-growing segments across regions
- To provide detailed information about the key factors influencing market growth (drivers, restraints, opportunities, and challenges)
- To analyze the opportunities in the market for stakeholders and provide details of the competitive landscape for market leaders
- To analyze the micromarkets concerning individual growth trends, prospects, and their contribution to the total market
- To identify and profile the key players in the plant-based protein market
- To understand the competitive landscape and identify the major growth strategies adopted by players across the key regions
Available Customizations
With the given market data, MarketsandMarkets offers customizations according to company-specific scientific needs.
The following customization options are available for the report:
Product Analysis
- Product matrix, which gives a detailed comparison of the product portfolio of each company.
Geographic Analysis as per Feasibility
With the given market data, MarketsandMarkets offers customizations according to company-specific scientific needs.
- Further breakdown of the Rest of European plant-based protein market into key countries
- Further breakdown of the Rest of Asia Pacific plant-based protein market into key countries
- Further breakdown of the Rest of South American plant-based protein market into key countries
Company Information
- Detailed analyses and profiling of additional market players (up to five)
Key Questions Addressed by the Report
What is the projected size of the plant-based protein market?
The plant-based protein market was valued at USD 22.29 billion in 2024 and is projected to reach USD 34.97 billion by 2030, at a CAGR of 7.9% from 2025 to 2030.
Which are the key players in the plant-based protein market, and how intense is the competition?
Key players include Cargill, Incorporated (US), ADM (US), Kerry Group PLC (Ireland), International Flavors & Fragrances Inc. (US), Ingredion Incorporated (US), Wilmar International Ltd. (Singapore), Roquette Frères (France), Glanbia PLC (Ireland), DSM-Firmenich (Switzerland), AGT Food and Ingredients (Canada), Tate & Lyle (UK), Burcon (Canada), Emsland Group (Germany), PURIS (US), and COSUCRA (Belgium). The market competition is intense, with continuous R&D investments, mergers, acquisitions, and innovations in encapsulation technologies.
What are the growth prospects for the plant-based protein market in the next five years?
The plant-based protein market is expected to grow robustly over the next five years, driven by the global shift toward healthier lifestyles and the rising vegan and vegetarian populations.
What kind of information is provided in the company profiles section?
The company profiles offer valuable information, such as a comprehensive business overview, including details on the company’s various business segments, financial performance, geographical reach, revenue composition, and the breakdown of their business revenue. Additionally, these profiles offer insights into the company’s product offerings, significant milestones, and expert analyst perspectives to further explain the company’s potential.
How is the Asia Pacific region contributing to market growth?
The Asia Pacific region is becoming a key growth driver for the plant-based protein market, driven by rising health awareness, urbanization, and increasing disposable incomes. Consumers in China, India, Japan, and Southeast Asian countries are adopting plant-based diets for cultural, environmental, and health reasons, particularly among younger urban populations. Government initiatives promoting wellness and a rise in lifestyle-related health issues are boosting demand. Moreover, the growth of e-commerce and mobile health platforms improves product accessibility, allowing more consumers to explore plant-based options.
Need a Tailored Report?
Customize this report to your needs
Get 10% FREE Customization
Customize This ReportPersonalize This Research
- Triangulate with your Own Data
- Get Data as per your Format and Definition
- Gain a Deeper Dive on a Specific Application, Geography, Customer or Competitor
- Any level of Personalization
Let Us Help You
- What are the Known and Unknown Adjacencies Impacting the Plant-based Protein Market
- What will your New Revenue Sources be?
- Who will be your Top Customer; what will make them switch?
- Defend your Market Share or Win Competitors
- Get a Scorecard for Target Partners

Custom Market Research Services
We Will Customise The Research For You, In Case The Report Listed Above Does Not Meet With Your Requirements
Get 10% Free CustomisationTESTIMONIALS

Business Innovation Director
US Based Leading Agribusiness,
Food and Ingredients ManufacturerI highly appreciate the team's efficiency for a well-conducted study that helped us clarify some blind spots in the area of proteins. Although compiling information for B2B ingredients is very difficult, the MnM team pulled out the task successfully. The quality of research, level of insights, and the responsiveness of the team were commendable!


Growth opportunities and latent adjacency in Plant-based Protein Market