
Precision Aquaculture Market Size, Share & Trends

Precision Aquaculture Market Size, Share, Growth & Trends by Sensors, Camera Systems, Control Systems, Software (On Cloud, On Premises), Services, Smart Feeding Systems, Monitoring and Control Systems, Underwater ROV Systems, Feed Optimization, Monitoring & Surveillance, Yield Analysis & Measurement, Open Aquaculture Farms and RAS Farms - Global Forecast to 2030


PRECISION AQUACULTURE MARKET SIZE, SHARE & TRENDS
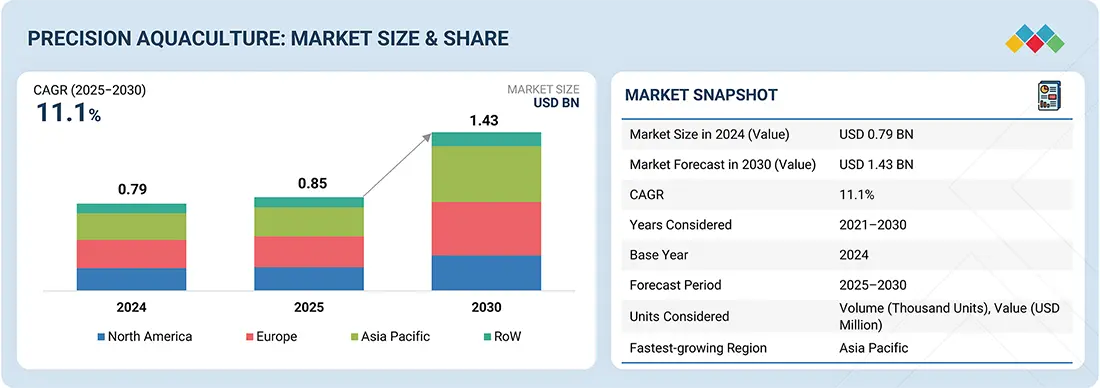
According to Marketsandmarkets, the global precision aquaculture market size was valued at USD 0.85 billion in 2025 and is projected to reach USD 1.43 billion by 2030, growing at a CAGR of 11.1% from 2025 to 2030. The growing use of advanced ROVs with high-resolution cameras and environmental sensors is driving the market. These systems allow real-time monitoring of fish health, net integrity, and feeding behaviour. When integrated with AI and cloud analytics, ROVs support predictive maintenance and performance optimization with minimal manual input. This reduces diver dependency, enhances operational efficiency, and enables early issue detection. As large-scale and offshore farms seek smarter, safer, and more efficient solutions, ROVs have become essential tools, accelerating their adoption and playing a pivotal role in advancing automation and productivity across the precision aquaculture sector.
MARKET SNAPSHOT TABLE
| REPORT METRIC | DETAILS |
|---|---|
| Market Size in 2025 (Value) | USD 0.85 Billion |
| Market Forecast in 2030 (Value) | USD 1.43 Billion |
| Growth Rate | CAGR of 11.1% from 2025-2030 |
| Years Considered | 2021-2024 |
| Base Year | 2024 |
| Forecast Period | 2025-2030 |
| Units Considered | Volume (Thousand Units) and Value (USD Million) |
| Report Coverage | Revenue forecast, company ranking, competitive landscape, growth factors, and trends |
| Top Companies |
|
| Growth Drivers |
|
| Segments Covered |
|
| Regions Covered | North America, Europe, Asia Pacific, and RoW |
Market Size & Forecast
KEY TAKEAWAYS
-
BY OFFERINGThe precision aquaculture market features hardware, software, and services, with hardware leading in real-time data collection via sensors and cameras. Software boosts efficiency with AI analytics, while services ensure technology integration and maintenance.
-
BY SYSTEM TYPEBy system type, smart feeding systems lead by optimizing feed use, while monitoring systems track water quality and fish health. Underwater ROVs enable inspections, and other systems support niche applications.
-
BY APPLICATIONFeed optimization reduces costs, monitoring enhances security, and yield analysis improves productivity. Other applications, like disease prediction, support sustainability.
-
BY FARM TYPEOpen aquaculture farms dominate with cost-effective technologies, while RAS farms grow rapidly due to biosecurity and water recycling. Both segments meet demand for sustainable production.
-
BY REGIONEurope is estimated to lead the precision aquaculture market, driven by advanced salmon farming in Norway, Scotland, and Iceland. Strong regulations, high demand for quality-certified seafood, and a skilled workforce support technology adoption. The presence of leading companies, robust R&D, and EU-backed digital initiatives further strengthens its position in smart aquaculture solutions.
-
COMPETITIVE LANDSCAPEThe precision aquaculture market features major players, such as AKVA Group (Norway), ScaleAQ (Norway), Skretting (Norway), Innovasea Systems Inc. (US), and Aquabyte (US). These players have incorporated various organic and inorganic growth strategies, including collaborations, acquisitions, product launches, partnerships, expansions, and agreements to strengthen their international footprint and capture a greater share in the precision aquaculture market.
Opportunities in the precision aquaculture market growth are growing due to strategic acquisitions and rising demand for integrated, data-driven farm management solutions. Innovasea Systems’ acquisition of UK-based Aquanetix enhances end-to-end farm visibility and operational efficiency across over 200 farms in 31 countries. Expansion into the Mediterranean and Middle Eastern markets strengthens local service capabilities and taps emerging growth areas. With increasing digitalization in aquaculture, companies focusing on regional penetration and platform integration are well-positioned to drive adoption of precision farming technologies.
Source: Secondary Research, Interviews with Experts, MarketsandMarkets Analysis
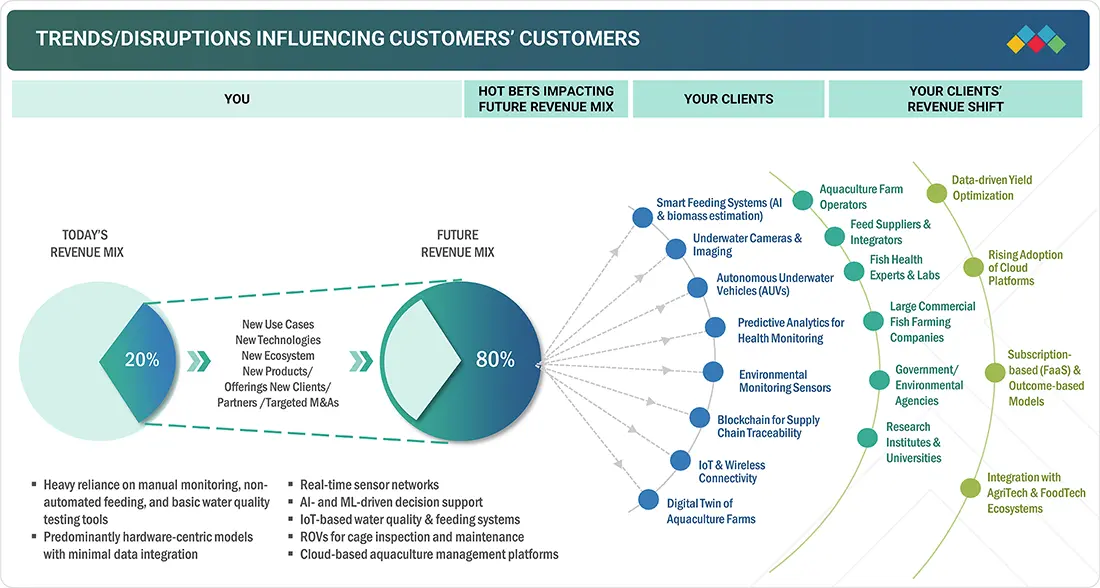
TRENDS & DISRUPTIONS IMPACTING CUSTOMERS' CUSTOMERS
The precision aquaculture industry is being transformed by AI-powered analytics, IoT, automated feeding systems, and underwater ROVs, enabling real-time monitoring, improved yield predictability, and greater operational efficiency. Sensors and cloud platforms support remote farm management, while stringent regulations drive adoption of early disease detection and proactive health measures. Emerging Farm-as-a-Service models and outcome-based pricing are making precision tools more accessible, accelerating digitalization, and promoting sustainable aquaculture practices.
Source: Secondary Research, Interviews with Experts, MarketsandMarkets Analysis
PRECISION AQUACULTURE MARKET DYNAMICS
Level
-
Surging adoption of advanced technologies such as IoT, ROVs, and AI for real-time monitoring of aquaculture farms

-
Growing investments in technological research and product innovations

Level
-
High upfront costs and capital expenditure

-
Lack of technological awareness among aquaculture farmers

Level
-
Rising demand for smart technologies in land-based recirculating aquaculture systems (RAS)

-
Emergence of Farm-as-a-Service (FaaS) models

Level
-
Environmental concerns due to extensive aquaculture farming

-
Lack of common information management system platform in the aquaculture industry

Source: Secondary Research, Interviews with Experts, MarketsandMarkets Analysis
Driver: Surging adoption of advanced technologies such as IoT, ROVs, and AI for real-time monitoring of aquaculture farms
Precision aquaculture leverages IoT sensors, AI analytics, automated feeding, and underwater ROVs to enhance the efficiency, sustainability, and productivity of aquaculture operations. By enabling real-time monitoring of water quality, fish behaviour, and biomass, it supports informed decision-making, feed optimization, disease detection, and stock management. This approach reduces resource wastage, labour costs, and mortality rates while promoting traceable, high-quality seafood. As global demand for sustainable seafood rises, precision aquaculture is becoming essential for resilient and environmentally responsible food production.
Restraint: High upfront costs and capital expenditure
A major restraint to the adoption of precision aquaculture is the high initial capital investment required for advanced technologies, including sensors, ROVs, automated feeding systems, and integrated monitoring platforms. Costs for installation, integration, training, and ongoing maintenance pose significant challenges, especially for small and medium-sized farms. Limited access to funding in developing regions further restricts adoption, making the delayed return on investment a key barrier to scaling precision aquaculture globally.
Opportunity: Rising demand for smart technologies in land-based recirculating aquaculture systems (RAS)
The rising adoption of land-based recirculating aquaculture systems (RAS) presents a major growth opportunity in the precision aquaculture market trends. RAS enables high-density, environmentally sustainable fish farming with controlled conditions, requiring advanced technologies like water quality sensors, AI-driven feeding, and real-time monitoring. These precision tools optimize aquatic conditions, improve feed conversion ratios, and reduce mortality, supporting consistent yields. Increasing regulatory focus, sustainability goals, urban aquaculture initiatives, and growing investments in land-based systems are driving strong demand for precision aquaculture solutions in RAS operations.
Challenge: Lack of common information management system platform in the aquaculture industry
A major challenge in the precision aquaculture market share is the lack of unified, standardized information systems across farms. Proprietary platforms and non-interoperable technologies create data silos, reducing the effectiveness of sensors, automated feeding systems, environmental monitors, and ROVs. This fragmentation hampers real-time decision-making, predictive analytics, and performance benchmarking, particularly for small and mid-sized producers with limited technical resources. Without industry-wide data standards, collaboration between technology providers, researchers, and regulators is constrained, limiting the scalability and full potential of precision aquaculture solutions.
Precision Aquaculture Market Growth: COMMERCIAL USE CASES ACROSS INDUSTRIES
| COMPANY | USE CASE DESCRIPTION | BENEFITS |
|---|---|---|
 |
Provides integrated aquaculture solutions, including automated feeding systems, monitoring platforms, and software for fish farming operations | Enhances operational efficiency, improves feed conversion ratios, reduces labor costs, and enables real-time farm monitoring |
|
|
Offers smart farm management solutions combining sensors, IoT, and automation tools for marine and land-based aquaculture farm | Optimizes water quality, fish health, and resource usage while supporting data-driven decision-making and sustainability |
|
|
Specializes in precision feed solutions and nutrition optimization for aquaculture, integrating AI and monitoring technologies | Improves feed efficiency, growth performance, and fish health, reducing feed waste and operational costs |
 |
Provides end-to-end solutions including monitoring, tracking, and farm management platforms, integrating IoT and cloud-based analytics | Enables comprehensive visibility from hatchery to harvest, supports predictive analytics, and enhances operational decision-making |
Logos and trademarks shown above are the property of their respective owners. Their use here is for informational and illustrative purposes only.
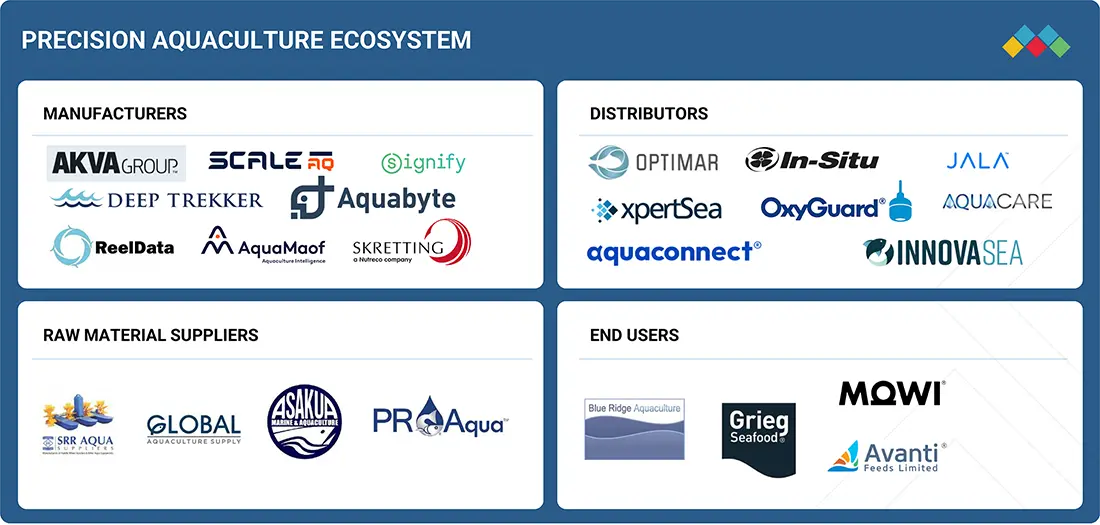
PRECISION AQUACULTURE MARKET ECOSYSTEM
The precision aquaculture ecosystem involves identifying and analyzing interconnected relationships among stakeholders, including hardware manufacturers, software and service providers, distributors, and end users. Hardware manufacturers supply essential equipment like sensors and feeders, while software and service providers offer AI-driven analytics and monitoring solutions to optimize farm operations. Distributors facilitate the supply chain between manufacturers and end users, such as aquaculture farms, enhancing efficiency and supporting sustainable production practices.
Logos and trademarks shown above are the property of their respective owners. Their use here is for informational and illustrative purposes only.
PRECISION AQUACULTURE MARKET SEGMENTS
Source: Secondary Research, Interviews with Experts, MarketsandMarkets Analysis
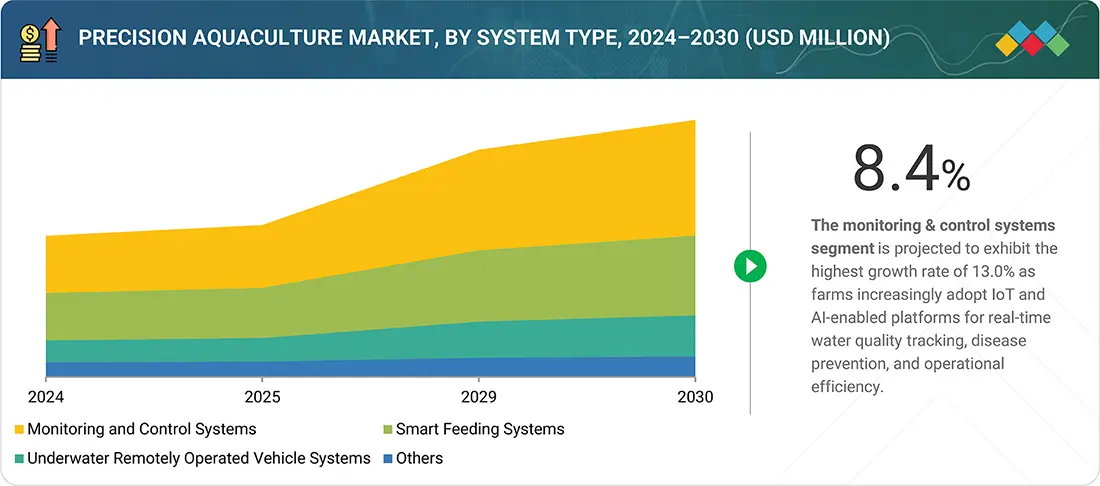
Precision Aquaculture Market Trends, System Type
The monitoring and control system segment dominates the precision aquaculture market share, as it enables real-time management of water quality, feed, and fish health. By integrating sensors, IoT, and automation, these systems improve operational efficiency, reduce manual intervention, prevent disease outbreaks, and ensure regulatory compliance, driving their widespread adoption in modern aquaculture operations.
Precision Aquaculture Market, Offering
The hardware segment leads the precision aquaculture market, driven by the essential role of sensors, cameras, and control systems in enabling real-time data collection and operational control. As aquaculture operations scale and adopt advanced technologies, demand for durable, high-performance hardware grows, especially in offshore and land-based farms requiring robust equipment.
Precision Aquaculture Market, Application
The monitoring and surveillance application leads the precision aquaculture market, as it enables real-time tracking of environmental parameters like oxygen, temperature, salinity, and pH. This helps ensure fish welfare, prevent disease outbreaks, and improve yield quality. Growing focus on sustainability, traceability, and regulatory compliance further drives the adoption of these systems across marine and land-based aquaculture operations.
Precision Aquaculture Market, Farm Type
The open aquaculture farms segment dominates the precision aquaculture market, driven by the widespread use of large-scale cage farming in regions like Northern Europe, Chile, and Southeast Asia. Operating in challenging marine environments, these farms rely on advanced monitoring and control systems to optimize fish health, resource use, and regulatory compliance, boosting the adoption of precision technologies.
REGION
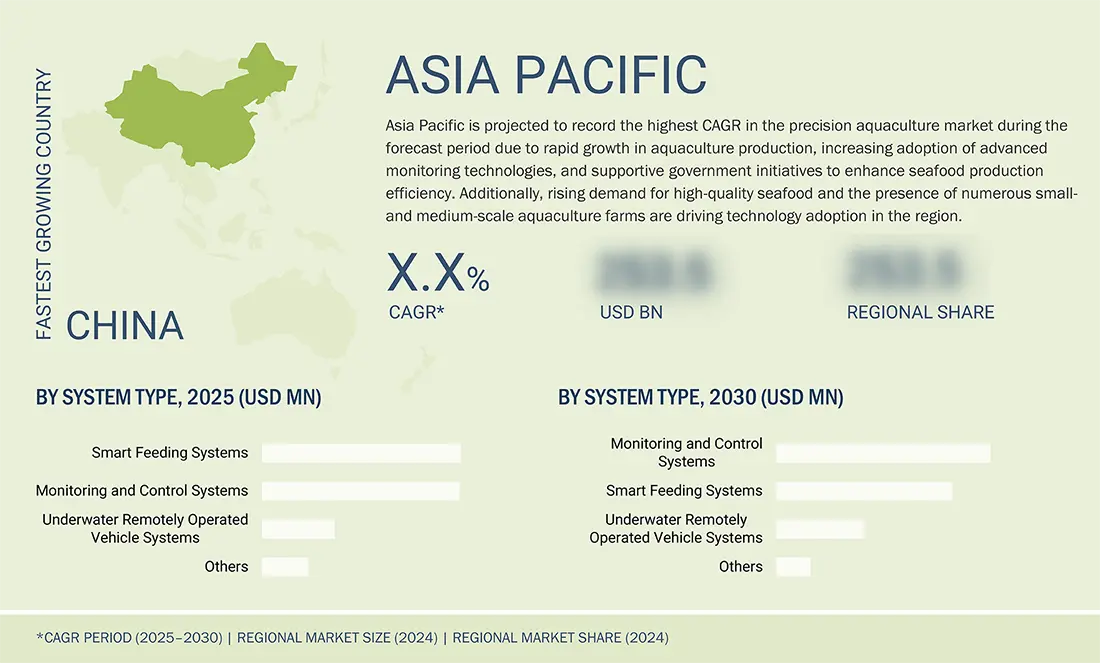
Asia Pacific to hold the largest market share in the global precision aquaculture market share during the forecast period
The Asia Pacific precision aquaculture market share is expected to grow at the highest CAGR due to the region's leading role in global aquaculture, rising demand for sustainable and efficient farming, and rapid adoption of smart technologies like IoT monitoring, automated feeding, and RAS systems. Supportive government initiatives, growing seafood consumption, and partnerships between local startups and global tech providers are further driving adoption, while export opportunities and sustainability certifications reinforce the need for precision solutions.
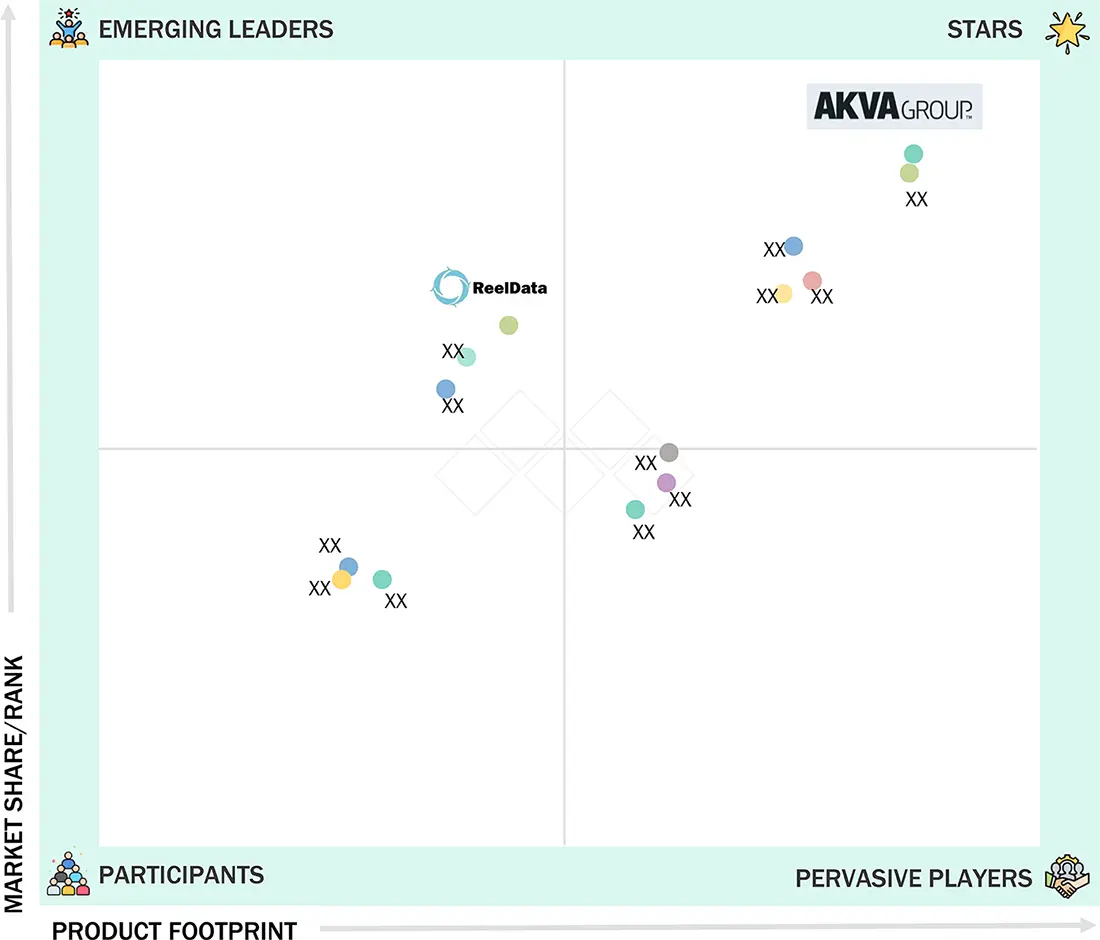
precision aquaculture market: COMPANY EVALUATION MATRIX
In the precision aquaculture market matrix, AKVA Group is positioned as a star due to its strong product footprint and dominant market share, reflecting its leadership in both innovation and adoption across OEMs. ReelData, on the other hand, is seen as an emerging leader, holding a significant market share but with a comparatively smaller product footprint, indicating strong growth potential as it expands its precision aquaculture offerings.
Source: Secondary Research, Interviews with Experts, MarketsandMarkets Analysis
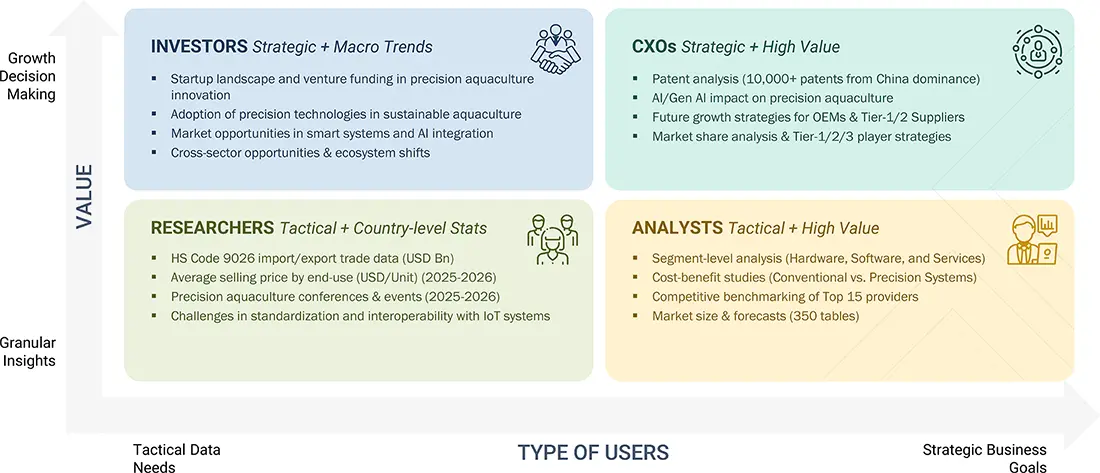
WHAT IS IN IT FOR YOU: precision aquaculture market REPORT CONTENT GUIDE
DELIVERED CUSTOMIZATIONS
We have successfully delivered the following deep-dive customizations:
| CLIENT REQUEST | CUSTOMIZATION DELIVERED | VALUE ADDS |
|---|---|---|
| European Seafood Cooperative |
|
|
| Australian Aquaculture Equipment Distributor |
|
|
| Industrial IoT Platform Provider for Aquaculture |
|
|
| Global Aquaculture Equipment Manufacturer |
|
|
| Aquaculture Feed Manufacturer |
|
|
RECENT DEVELOPMENTS
- March 2025 : AKVA Group launched Fishtalk 5, a cloud-based precision feeding platform offering faster performance, improved stability, and API integration with AI tools like Submerged and Observe. It would enhance feeding efficiency, fish welfare, and operational control through real-time, browser-based insights.
- November 2024 : ScaleAQ significantly amplified its operational presence in the Faroe Islands by signing a service agreement with KSS, a maritime and aquaculture services provider based in Klaksvík with nearly a century of regional expertise. Under the agreement, KSS would stock essential spare parts and deliver maintenance services for ScaleAQ’s installed equipment, enabling faster local support and improved uptime in the region’s challenging conditions. The partnership enhances service reliability while meeting the specific needs of Faroe Islands aquaculture customers.
- October 2024 : ReelData and Samherji announced an expansion agreement to deploy ReelData’s AI-powered technologies across Samherji’s land-based aquaculture facilities, supporting enhanced efficiency and sustainability in fish farming operations.
- April 2024 : Innovasea Systems Inc. launched HydroAI, a cloud-powered AI system that uses high-resolution cameras to deliver real-time fish counts and species identification at hydroelectric dams, helping operators enhance environmental compliance, streamline regulatory reporting, and optimize operations by reducing manual monitoring currently deployed at multiple Nova Scotia Power sites, with further installations planned.
- May 2023 : Skretting Southern Europe officially introduced Skretting?360+, a precision farming platform developed in collaboration with Israel-based startup Go Smart. Tailored for Mediterranean aquaculture (e.g., seabass, seabream), the system combined underwater IoT sensors, analytics, feeding protocols, AquaSim software, and technical advice to enable remote monitoring of biomass and environmental conditions, optimize feed strategies, and improve operational efficiency and sustainability across farms.
Table of Contents
 Exclusive indicates content/data unique to MarketsandMarkets and not available with any competitors.
Methodology
The study involved major activities in estimating the current market size for the precision aquaculture market. Exhaustive secondary research was done to collect information on the precision aquaculture industry. The next step was to validate these findings, assumptions, and sizing with industry experts across the value chain using primary research. Different approaches, such as top-down and bottom-up, were employed to estimate the total market size. After that, the data triangulation procedure was used to estimate the market size of the segments and subsegments of the precision aquaculture market.
Secondary Research
Secondary research for this study involved gathering information from various credible sources such as company reports, white papers, journals, and industry publications. This process helped understand the supply and value chains, identify key players, analyze market segmentation and regional trends, and track major market and technology developments. The data collected was used to estimate the overall market size, which was later validated through primary research.
Primary Research
Extensive primary research was conducted after gaining knowledge about the current scenario of the precision aquaculture market through secondary research. Several primary interviews were conducted with experts from the demand and supply sides across four main regions—North America, Europe, Asia Pacific, and RoW. This primary data was collected through questionnaires, emails, and telephonic interviews.

Note: RoW mainly comprises the Middle East, Africa, and South America.
Other designations include product managers, sales managers, and marketing managers.
Tier 1 companies include market players with revenues above USD 500 million; tier 2 companies earn revenues between USD 100 million and USD 500 million; and tier 3 companies earn revenues of up to USD 100 million.
To know about the assumptions considered for the study, download the pdf brochure
Market Size Estimation
The bottom-up procedure has been employed to arrive at the overall size of the precision aquaculture market.
- Analyzed major manufacturers of precision aquaculture, studied their portfolios, and understood products based on their features and functions
- Analyzed the segmental revenue and scope revenue of the companies profiled in the study
- Arrived at the global precision aquaculture market size by adding the scope revenue of key manufacturers
- Conducted multiple discussions with key opinion leaders to understand different precision aquaculture system types, applications, offerings, farm types, and current trends in the market, and analyzed the breakup of the scope of study by major manufacturing companies
The top-down approach has been used to estimate and validate the total size of the precision aquaculture market.
- The global size of the precision aquaculture market was estimated through the data sanity of major companies offering precision aquaculture hardware, software, and services
- The system type segment splits were estimated using secondary sources
- The market size for the global offering and farm type was determined by understanding the penetration split of each offering and farm type by each system type
- The market size of each region was analyzed based on the farm type
- The country-level penetration split was analyzed for each region to estimate the market size
- The global application market size was estimated by analyzing the penetration split of each offering for each application
Precision Aquaculture Market : Top-Down and Bottom-Up Approach

Data Triangulation
After arriving at the overall market size using the market size estimation processes as explained above, the market has been split into several segments and subsegments. To complete the entire market engineering process and arrive at the exact statistics of each market segment and subsegment, data triangulation and market breakdown procedures have been employed, wherever applicable. The data has been triangulated by studying various factors and trends from the demand and supply sides in the precision aquaculture market.
Market Definition
Precision aquaculture refers to the application of advanced technologies such as sensors, automation, artificial intelligence (AI), Internet of Things (IoT), and data analytics to monitor, manage, and optimize aquaculture operations in real-time. It enables farmers to collect and analyze critical parameters like water quality, fish behavior, feeding patterns, and environmental conditions to improve decision-making, enhance fish health, reduce feed waste, and increase productivity. By minimizing manual intervention and enabling data-driven control, precision aquaculture supports more sustainable, efficient, and traceable farming practices, aligning with the growing global demand for responsible seafood production.
Key Stakeholders
- Component suppliers
- Electronics component and device manufacturers
- Original aquaculture equipment manufacturers (OEMs)
- IoT product manufacturers for the aquaculture industry
- Component and device suppliers and distributors
- Software, service, and technology providers
- Standardization and testing firms
- Government bodies such as regulatory authorities and policymakers
- Associations, organizations, forums, and alliances related to aquaculture industries
- Research institutes and organizations
- End users such as RAS-based aquaculture farmers, cage-based farming companies, and pond-based aquaculture farming individuals and corporations
- Global and regional aquaculture associations and farming communities
Report Objectives
- To define, describe, and forecast the size of the precision aquaculture market, by offering, farm type, system type, application, and region, in terms of value
- To describe and forecast the size of the precision aquaculture market, by offering, in terms of volume
-
To forecast the market for various segments concerning the main regions, namely,
North America, Europe, Asia Pacific, and the Rest of the World (RoW), in terms of value - To provide macroeconomic outlooks concerning the main regions, namely, North America, Europe, Asia Pacific, and the Rest of the World (RoW)
- To provide detailed information regarding the drivers, restraints, opportunities, and challenges influencing the market’s growth
- To strategically analyze micromarkets concerning individual growth trends, prospects, and contributions to the total market
- To provide ecosystem analysis, value chain, trends/disruptions impacting customer business, technology analysis, pricing analysis, case study analysis, trade analysis, patent analysis, Porter’s five forces, key conferences & events, AI impact, impact of 2025 US tariff, and regulations related to the precision aquaculture market
- To analyze the opportunities in the market for stakeholders by identifying high-growth segments and detailing the competitive landscape for market players
- To strategically profile key players and comprehensively analyze their market rankings, core competencies, company evaluation matrix, competitive scenario, along with detailing the competitive landscape for the market leaders
- To analyze the competitive developments, such as product launches, agreements, collaborations, and acquisitions, carried out by market players
- To benchmark players within the market using the competitive leadership mapping framework, which analyzes market players on various parameters within the broad categories of business strategy excellence and strength of product portfolio
Available customizations:
With the given market data, MarketsandMarkets offers customizations according to the company‘s specific needs. The following customization options are available for the report.
Company Information:
- Detailed analysis and profiling of additional market players (up to five)
Key Questions Addressed by the Report
What is the current size of the global precision aquaculture market?
The global precision aquaculture market is estimated to reach USD 0.85 billion in 2025 in 2025. The market includes sensors, camera systems, control systems, software, services, smart feeding systems, monitoring systems, and underwater ROV solutions. (MarketsandMarkets)
What will be the projected size of the precision aquaculture market by 2030?
The precision aquaculture market is projected to reach USD 1.43 billion (USD 1,434.5 million) by 2030. (MarketsandMarkets)
What is the growth rate (CAGR) of the precision aquaculture market?
The market is expected to grow at a CAGR of 11.1% from 2025 to 2030 due to increasing adoption of automation, IoT-based monitoring, and smart farming technologies. (MarketsandMarkets)
What are the major growth drivers of the precision aquaculture industry?
Key growth drivers include increasing demand for sustainable seafood production, real-time monitoring of fish health, automated feeding systems, reduction of feed waste, disease prevention, and adoption of AI, IoT, and sensor-based technologies. (MarketsandMarkets)
What are the major trends shaping the precision aquaculture market?
Major trends include AI-powered analytics, IoT-enabled farm monitoring, cloud-based aquaculture management platforms, automated feeding, underwater ROV adoption, predictive health monitoring, and Farm-as-a-Service models. (MarketsandMarkets)
Which industries and applications are driving precision aquaculture adoption?
Precision aquaculture is used in commercial fish farming, marine aquaculture, land-based Recirculating Aquaculture Systems (RAS), seafood production, and sustainable food production industries. Major applications include feed optimization, monitoring & surveillance, and yield analysis & measurement. (MarketsandMarkets)
Which companies are major players in the precision aquaculture market?
Key companies include AKVA Group, ScaleAQ, Skretting, Innovasea Systems Inc., and Aquabyte. These companies focus on smart feeding, monitoring systems, sensors, software platforms, and digital aquaculture solutions. (MarketsandMarkets)
Which segment dominates the precision aquaculture market?
The hardware segment leads the market due to strong demand for sensors, cameras, and control systems used for real-time data collection. Among system types, monitoring and control systems are expected to dominate due to their role in managing water quality, fish health, and farm operations. (MarketsandMarkets)
Which region is expected to lead the precision aquaculture market?
Europe is estimated to lead the precision aquaculture market due to advanced salmon farming operations in Norway, Scotland, and Iceland, strict sustainability regulations, and strong adoption of digital aquaculture technologies. Asia Pacific is expected to record the highest CAGR during 2025–2030 due to large aquaculture production and increasing smart farming adoption. (MarketsandMarkets)
What does the MarketsandMarkets precision aquaculture market report cover?
The report covers market size forecasts, competitive landscape, growth drivers, trends, challenges, opportunities, and segmentation by offering (hardware, software, services), system type (smart feeding, monitoring & control, underwater ROV systems), application, farm type, and region. The report covers 2021–2030, with analysis across North America, Europe, Asia Pacific, and Rest of World. (PR Newswire)
Need a Tailored Report?
Customize this report to your needs
Get 10% FREE Customization
Customize This ReportPersonalize This Research
- Triangulate with your Own Data
- Get Data as per your Format and Definition
- Gain a Deeper Dive on a Specific Application, Geography, Customer or Competitor
- Any level of Personalization
Let Us Help You
- What are the Known and Unknown Adjacencies Impacting the Precision Aquaculture Market
- What will your New Revenue Sources be?
- Who will be your Top Customer; what will make them switch?
- Defend your Market Share or Win Competitors
- Get a Scorecard for Target Partners

Custom Market Research Services
We Will Customise The Research For You, In Case The Report Listed Above Does Not Meet With Your Requirements
Get 10% Free CustomisationTESTIMONIALS

Tetsuya Ohhira
Business Development Manager-Technology Business
Nikon Corporation,
Leading Japanese MNC specializing in optics and imaging productswww.nikon.com
MarketsandMarkets™ response
is quick. Their attitude is flexible and positive. Analyst Insights are globally considered and
significant. Client Services quickly respond to our inquiry and demand. Their wide range of global
surveys help us make our strategic plan.
We hope Knowledge Store will be easier to search
for a report.
VP - Marketing & Business Development
Leading Provider of Process Control Solutions
We engaged with MarketsandMarkets on a study to perform an analysis and recommend a Go-To-Market strategy for metrology and process control in the semiconductor market. The study was tailored to our targets and needs with well-defined milestones. Our overall experience with the MarketsandMarkets team was very good throughout the project in all aspects including the analysis methodologies used, the quality and depth of primary and secondary data sets, the professionalism and flexibility of the team and the ability to meet the target schedule and milestones. We want to thank MarketsandMarkets team for a job well done.
Growth opportunities and latent adjacency in Precision Aquaculture Market


Edward
Apr, 2026
Are trends in automation, IoT integration, and AI adoption in aquaculture discussed in depth?.
Aaron
Apr, 2026
Overall, this report is a valuable tool for anyone looking to understand the precision aquaculture market and plan growth strategies..