2
RESEARCH METHODOLOGY
34
5
MARKET OVERVIEW
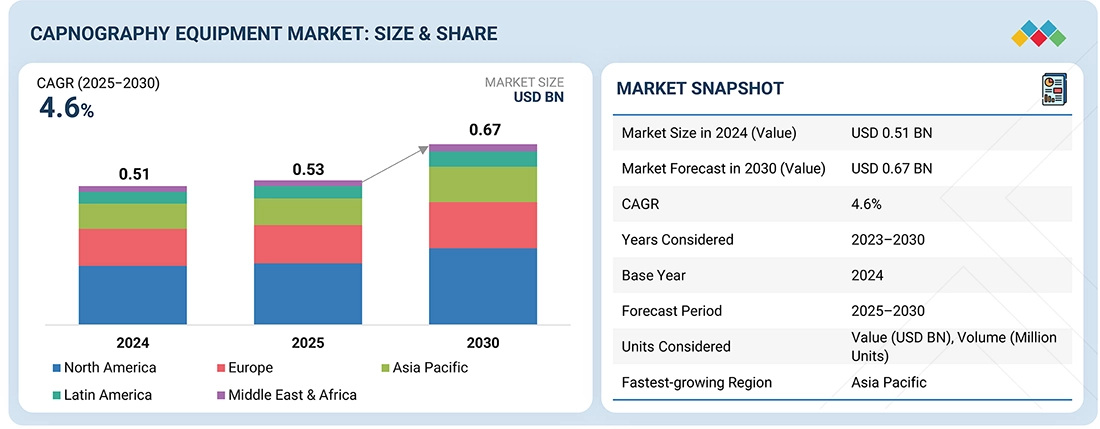
Capnography market poised for growth with tech advancements and emerging economy opportunities despite regulatory hurdles.
55
5.1.1.1
INCREASING PREVALENCE OF RESPIRATORY DISEASES
5.1.1.2
CLINICAL BENEFITS OF CAPNOGRAPHY OVER PULSE OXIMETRY
5.1.1.3
RISING NUMBER OF SURGERIES AND TARGET DISEASES REQUIRING CO2 MONITORING
5.1.1.4
TECHNOLOGICAL ADVANCEMENTS
5.1.2.1
COMPLEX REGULATORY FRAMEWORK FOR APPROVAL OF CAPNOGRAPHY EQUIPMENT
5.1.2.2
HIGH EQUIPMENT AND MAINTENANCE COSTS
5.1.3.1
INCREASED AVAILABILITY OF CLINICAL RESEARCH EVIDENCE
5.1.3.2
GROWTH OPPORTUNITIES FOR HEALTHCARE INDUSTRY IN EMERGING ECONOMIES
5.1.3.3
AI AND DATA ANALYTICS INTEGRATION
5.1.4.1
LACK OF SKILLED TECHNICIANS AND NEED FOR SPECIALIZED TRAINING FOR OPERATING CAPNOMETERS
5.2
UNMET NEEDS & WHITE SPACES
5.2.1
UNMET NEEDS IN CAPNOGRAPHY EQUIPMENT MARKET
5.2.2
WHITE SPACE OPPORTUNITIES
5.3
INTERCONNECTED MARKETS & CROSS-SECTOR OPPORTUNITIES
5.3.1
INTERCONNECTED MARKETS
5.3.2
CROSS-SECTOR OPPORTUNITIES
5.4
STRATEGIC MOVES BY TIER-1/2/3 PLAYERS
6
INDUSTRY TRENDS
Key takeaways succinctly distilled.
67
6.1
PORTER’S FIVE FORCES ANALYSIS
6.1.1
THREAT OF NEW ENTRANTS
6.1.2
BARGAINING POWER OF SUPPLIERS
6.1.3
BARGAINING POWER OF BUYERS
6.1.4
THREAT OF SUBSTITUTES
6.1.5
INTENSITY OF COMPETITIVE RIVALRY
6.2
MACROECONOMIC OUTLOOK
6.2.2
GDP TRENDS AND FORECAST
6.2.3
TRENDS IN GLOBAL RESPIRATORY CARE DEVICES INDUSTRY
6.2.4
TRENDS IN GLOBAL PATIENT MONITORING DEVICES INDUSTRY
6.3
SUPPLY CHAIN ANALYSIS
6.3.1
PROMINENT COMPANIES
6.3.2
SMALL AND MEDIUM-SIZED ENTERPRISES
6.5.1
INDICATIVE SELLING PRICE OF TOP THREE APPLICATIONS, BY KEY PLAYER (2024)
6.5.2
AVERAGE SELLING PRICE TREND OF CAPNOGRAPHY EQUIPMENT, BY TYPE (2022–2024)
6.5.3
AVERAGE SELLING PRICE TREND OF CAPNOGRAPHY EQUIPMENT, BY REGION (2022–2024)
6.6.1
IMPORT DATA FOR HS CODE 9018
6.6.2
EXPORT DATA FOR HS CODE 9018
6.7
KEY CONFERENCES & EVENTS, 2025–2026
6.8
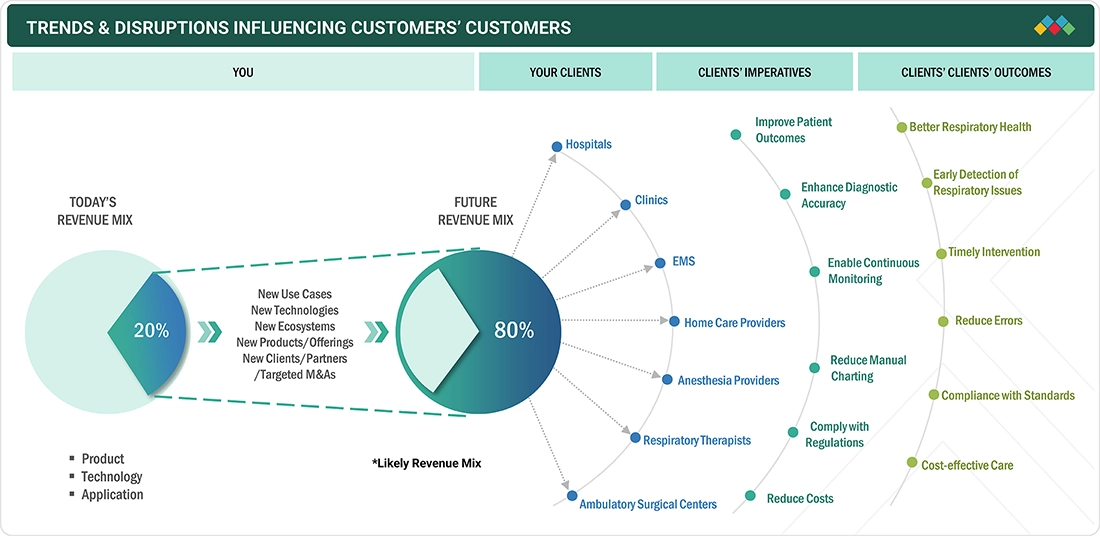
TRENDS/DISRUPTIONS IMPACTING CUSTOMERS’ BUSINESSES
6.9
INVESTMENT & FUNDING SCENARIO
6.10.1
CASE STUDY 1: INCORPORATING CAPNOGRAPHY MONITORING IN PATIENT-CONTROLLED ANALGESIA (PCA) POST-OPERATIVE CARE
6.10.2
CASE STUDY 2: AVAILABILITY AND USEFULNESS OF PORTABLE CAPNOMETERS IN CHILDREN WITH TRACHEOSTOMY
6.10.3
CASE STUDY 3: RANDOMIZED CONTROLLED TRIAL OF CAPNOGRAPHY IN CORRECTION OF SIMULATED ET DISLODGEMENT
6.11
IMPACT OF 2025 US TARIFFS ON CAPNOGRAPHY EQUIPMENT MARKET
6.11.3
PRICE IMPACT ANALYSIS
6.11.4
IMPACT ON COUNTRY/REGION
6.11.5
IMPACT ON END-USER INDUSTRIES
7
TECHNOLOGICAL ADVANCEMENTS, AI-DRIVEN IMPACT, PATENTS, INNOVATIONS, AND FUTURE APPLICATIONS
Key takeaways succinctly distilled.
86
7.1
KEY EMERGING TECHNOLOGIES
7.1.1
MAINSTREAM CAPNOGRAPHY
7.1.2
SIDE-STREAM CAPNOGRAPHY
7.1.3
WAVEFORM CAPNOGRAPHY
7.1.4
COMPLEMENTARY TECHNOLOGIES
7.2
TECHNOLOGY/PRODUCT ROADMAP
7.2.1
SHORT TERM (2025–2027) | FOUNDATION & EARLY COMMERCIALIZATION
7.2.2
MID TERM (2027–2030) | EXPANSION & STANDARDIZATION
7.2.3
LONG TERM (2030–2035+) | MASS COMMERCIALIZATION & DISRUPTION
7.4
FUTURE APPLICATIONS OF CAPNOGRAPHY EQUIPMENT
7.5
IMPACT OF AI/GEN AI ON CAPNOGRAPHY EQUIPMENT MARKET
7.5.1
TOP USE CASES AND MARKET POTENTIAL
7.5.2
BEST PRACTICES IN CAPNOGRAPHY EQUIPMENT PROCESSING
7.5.3
CASE STUDIES OF AI IMPLEMENTATION IN CAPNOGRAPHY EQUIPMENT MARKET
7.5.4
INTERCONNECTED ADJACENT ECOSYSTEM AND IMPACT ON MARKET PLAYERS
7.5.5
CLIENTS’ READINESS TO ADOPT GENERATIVE AI IN CAPNOGRAPHY EQUIPMENT MARKET
8
REGULATORY LANDSCAPE
Navigate complex global regulations with clarity on regional compliance and industry standards.
95
8.1
REGIONAL REGULATIONS AND COMPLIANCE
8.1.1
REGULATORY BODIES, GOVERNMENT AGENCIES, AND OTHER ORGANIZATIONS
8.1.2
REGULATORY FRAMEWORK
8.2
CERTIFICATIONS, LABELING, ECO-STANDARDS
9
CUSTOMER LANDSCAPE & BUYER BEHAVIOR
Key takeaways succinctly distilled.
107
9.1
DECISION-MAKING PROCESS
9.2
BUYER STAKEHOLDERS & BUYING EVALUATION CRITERIA
9.2.1
KEY STAKEHOLDERS IN BUYING PROCESS
9.2.2
KEY BUYING CRITERIA
9.3
ADOPTION BARRIERS & INTERNAL CHALLENGES
9.4
UNMET NEEDS FROM VARIOUS END-USE INDUSTRIES
9.5.3
MARGIN OPPORTUNITIES IN KEY APPLICATIONS
10
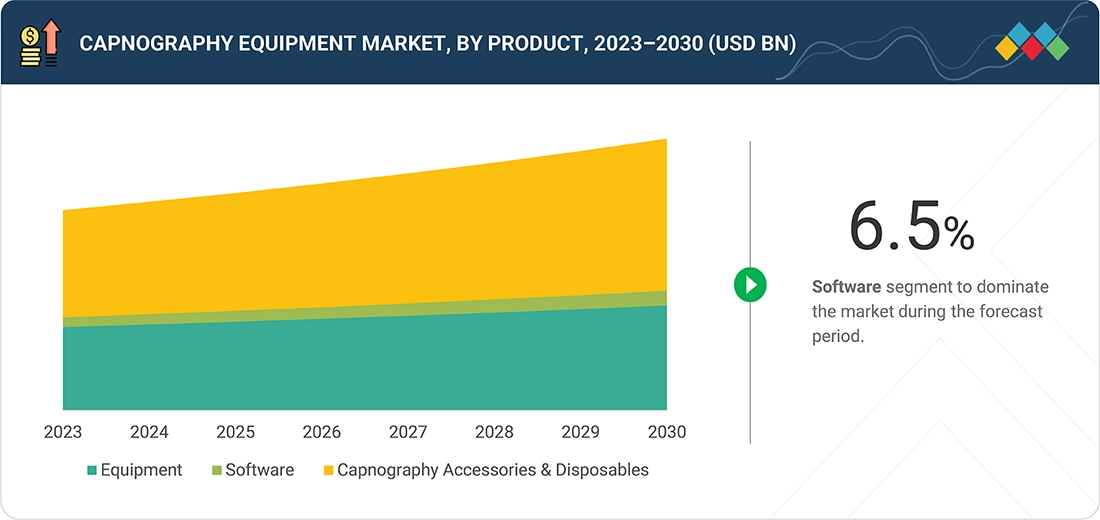
CAPNOGRAPHY EQUIPMENT MARKET, BY PRODUCT
Market Size & Growth Rate Forecast Analysis to 2030 in USD Million and Units | 16 Data Tables
112
10.2.1
MULTIPARAMETER CAPNOMETERS
10.2.1.1
HANDHELD MULTIPARAMETER CAPNOMETERS
10.2.1.2
CONVENTIONAL MULTIPARAMETER CAPNOMETERS
10.2.2
STANDALONE CAPNOMETERS
10.2.2.1
HANDHELD STANDALONE CAPNOMETERS
10.2.2.2
CONVENTIONAL STANDALONE CAPNOMETERS
10.3.1
BETTER CLINICAL DECISION-MAKING AND PATIENT MANAGEMENT TO FUEL MARKET GROWTH
10.4
CAPNOGRAPHY ACCESSORIES & DISPOSABLES
10.4.1
FAVORABLE REIMBURSEMENT SCENARIO TO SUPPORT MARKET GROWTH
11
CAPNOGRAPHY EQUIPMENT MARKET, BY TECHNOLOGY
Market Size & Growth Rate Forecast Analysis to 2030 in USD Million | 4 Data Tables
121
11.2
MAINSTREAM CAPNOGRAPHY
11.2.1
HIGH ACCURACY, FAST RESPONSE TIME, AND IMPROVED SUITABILITY FOR NEONATES TO AID MARKET GROWTH
11.3
SIDESTREAM CAPNOGRAPHY
11.3.1
RELIABLE MEASUREMENT OF END-TIDAL CO2 LEVELS TO PROPEL ADOPTION IN CLINICAL SETTINGS
11.4
MICROSTREAM CAPNOGRAPHY
11.4.1
LIMITATIONS IN BLACK-BODY INFRARED TECHNOLOGY TO LIMIT USAGE IN OPERATING ROOMS
12
CAPNOGRAPHY EQUIPMENT MARKET, BY APPLICATION
Market Size & Growth Rate Forecast Analysis to 2030 in USD Million | 5 Data Tables
125
12.2.1
INCREASING NUMBER OF CARDIOPULMONARY SURGERIES TO DRIVE MARKET GROWTH
12.3
TRAUMA & EMERGENCY CARE
12.3.1
INCREASING NUMBER OF ROAD ACCIDENTS TO SPUR MARKET GROWTH
12.4
RESPIRATORY MONITORING
12.4.1
RISING PREVALENCE OF TARGET RESPIRATORY CONDITIONS TO SUPPORT MARKET GROWTH
13
CAPNOGRAPHY EQUIPMENT MARKET, BY END USER
Market Size & Growth Rate Forecast Analysis to 2030 in USD Million | 4 Data Tables
130
13.2.1
FOCUS ON REDUCING AIRWAY-RELATED DEATHS IN ICU PATIENTS TO ACCELERATE MARKET GROWTH
13.3
AMBULATORY SURGERY CENTERS & HOME CARE SETTINGS
13.3.1
INCREASING NUMBER OF REIMBURSEMENT-APPROVED MEDICAL PROCEDURES UNDER ASC PAYMENT SYSTEM TO DRIVE MARKET
14
CAPNOGRAPHY EQUIPMENT MARKET, BY REGION
Comprehensive coverage of 8 Regions with country-level deep-dive of 14 Countries | 178 Data Tables.
134
14.2.1.1
US TO DOMINATE NORTH AMERICAN CAPNOGRAPHY EQUIPMENT MARKET DURING FORECAST PERIOD
14.2.2.1
RISING PREVALENCE OF TARGET RESPIRATORY DISEASES TO SUPPORT MARKET GROWTH
14.3.1.1
DEVELOPED HEALTHCARE INFRASTRUCTURE AND HIGH GOVERNMENT INVESTMENTS TO SPUR MARKET GROWTH
14.3.2.1
INCREASING TARGET PATIENT POPULATION AND RISING HEALTHCARE EXPENDITURE TO PROPEL MARKET GROWTH
14.3.3.1
GROWING AWARENESS OF CAPNOGRAPHY MONITORING PROCEDURES AND INCREASING NUMBER OF TRAUMA CASES TO AUGMENT MARKET GROWTH
14.3.4.1
RISE IN DIABETES CASES AND HIGH GERIATRIC POPULATION TO BOOST MARKET GROWTH
14.3.5.1
INCREASING PREVALENCE OF LIFESTYLE DISEASES TO DRIVE DEMAND FOR CAPNOGRAPHY EQUIPMENT
14.4.1.1
RISING GERIATRIC POPULATION AND GROWING PREVALENCE OF OBESITY TO AUGMENT MARKET GROWTH
14.4.2.1
HIGH TARGET PATIENT POPULATION AND IMPROVED INPATIENT SERVICE AVAILABILITY TO SUPPORT MARKET GROWTH
14.4.3.1
FAVORABLE REGULATORY POLICIES AND HIGH PUBLIC HEALTHCARE EXPENDITURE TO AID MARKET GROWTH
14.4.4.1
GROWING PATIENT POPULATION AND RISING AVAILABILITY OF GRANTS TO FUEL MARKET GROWTH
14.4.5.1
INCREASED FOCUS ON R&D ACTIVITIES AND HIGH PENETRATION OF HEALTH INSURANCE TO PROPEL MARKET GROWTH
14.4.6
REST OF ASIA PACIFIC
14.5.1.1
IMPROVED HEALTHCARE SECTOR AND INCREASED PRIVATE-PUBLIC INVESTMENTS TO DRIVE MARKET
14.5.2.1
FAVORABLE TRADE ENVIRONMENT AND EASY ENTRY OF FOREIGN PLAYERS TO FUEL MARKET GROWTH
14.5.3
REST OF LATIN AMERICA
14.6
MIDDLE EAST & AFRICA
14.6.1.1
HEALTHCARE INFRASTRUCTURAL DEVELOPMENTS AND INCREASED FOCUS ON PATIENT SAFETY TO DRIVE MARKET
14.6.2
REST OF MIDDLE EAST & AFRICA
15
COMPETITIVE LANDSCAPE
Uncover strategic insights and market positioning of top capnography equipment players and emerging startups.
204
15.2
KEY PLAYER STRATEGY/RIGHT TO WIN
15.2.1
OVERVIEW OF STRATEGIES ADOPTED BY PLAYERS IN CAPNOGRAPHY EQUIPMENT MARKET
15.3
REVENUE ANALYSIS, 2020–2024
15.4
MARKET SHARE ANALYSIS, 2024
15.4.1
RANKING OF KEY MARKET PLAYERS
15.5
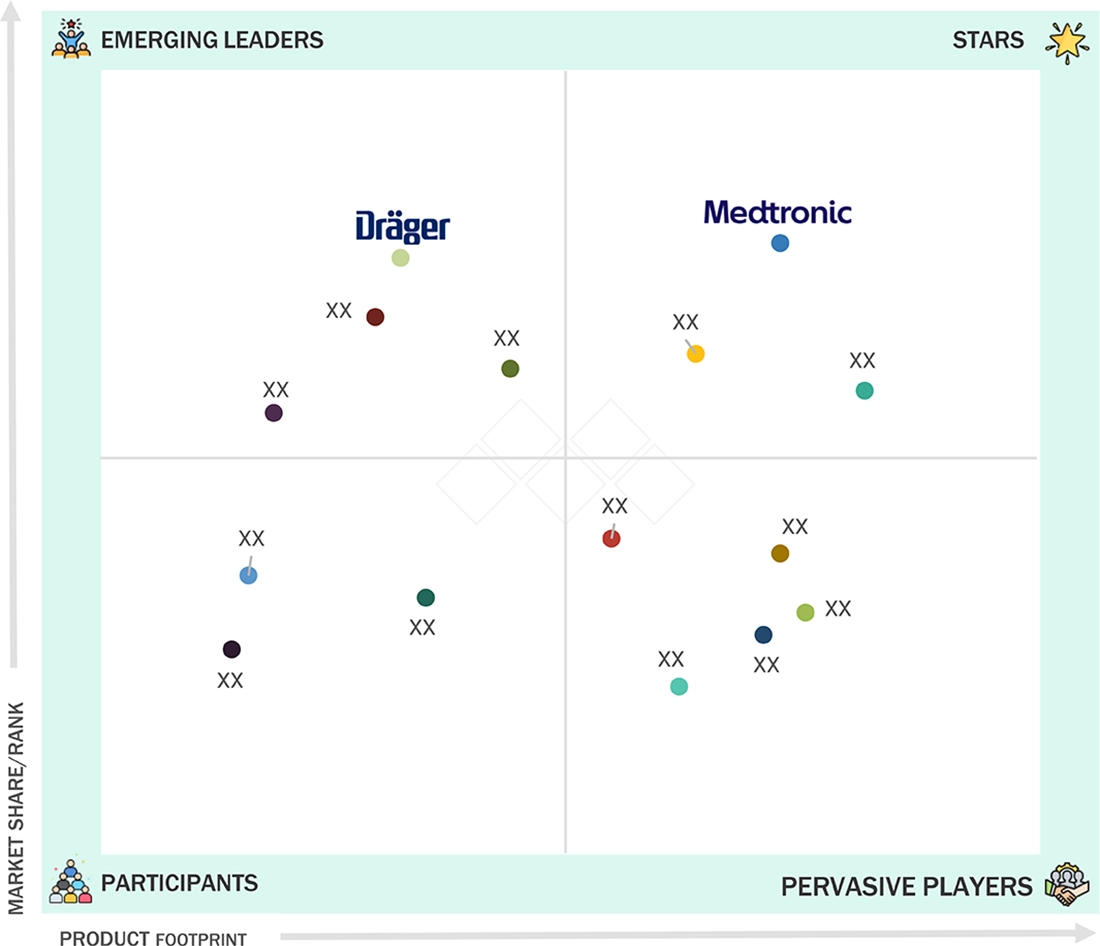
COMPANY EVALUATION MATRIX: KEY PLAYERS, 2024
15.5.5
COMPANY FOOTPRINT: KEY PLAYERS, 2024
15.5.5.1
COMPANY FOOTPRINT
15.5.5.2
REGION FOOTPRINT
15.5.5.3
PRODUCT FOOTPRINT
15.5.5.4
TECHNOLOGY FOOTPRINT
15.5.5.5
APPLICATION FOOTPRINT
15.5.5.6
END-USER FOOTPRINT
15.6
COMPANY EVALUATION MATRIX: STARTUPS/SMES, 2024
15.6.1
PROGRESSIVE COMPANIES
15.6.2
RESPONSIVE COMPANIES
15.6.5
COMPETITIVE BENCHMARKING: STARTUPS/SMES, 2024
15.6.5.1
DETAILED LIST OF KEY STARTUPS/SMES
15.6.5.2
COMPETITIVE BENCHMARKING OF KEY STARTUPS/SMES
15.7
COMPANY VALUATION & FINANCIAL METRICS
15.8
BRAND/PRODUCT COMPARISON
15.9
COMPETITIVE SCENARIO
16
COMPANY PROFILES
In-depth Company Profiles of Leading Market Players with detailed Business Overview, Product and Service Portfolio, Recent Developments, and Unique Analyst Perspective (MnM View)
226
16.1.1.1
BUSINESS OVERVIEW
16.1.1.2
PRODUCTS OFFERED
16.1.1.3
RECENT DEVELOPMENTS
16.1.2
KONINKLIJKE PHILIPS N.V.
16.1.3
MASIMO CORPORATION
16.1.5
BECTON, DICKINSON AND COMPANY
16.1.6
DRÄGERWERK AG & CO. KGAA
16.1.7
NIHON KOHDEN CORPORATION
16.1.9
SHENZHEN MINDRAY BIO-MEDICAL ELECTRONICS CO., LTD.
16.1.10
ZOLL MEDICAL CORPORATION
16.1.11
EDAN INSTRUMENTS, INC.
16.2.2
BPL MEDICAL TECHNOLOGIES
16.2.3
BURTONS MEDICAL EQUIPMENT, LTD.
16.2.4
CRITICARE TECHNOLOGIES, INC.
16.2.5
DIAMEDICA (UK) LIMITED
16.2.7
SPACELABS HEALTHCARE
16.2.8
NIDEK MEDICAL INDIA
16.2.9
RECORDERS & MEDICARE SYSTEMS PVT. LTD.
16.2.10
ZOE MEDICAL, INCORPORATED
17.2
KNOWLEDGESTORE: MARKETSANDMARKETS’ SUBSCRIPTION PORTAL
17.3
CUSTOMIZATION OPTIONS
TABLE 1
CAPNOGRAPHY EQUIPMENT MARKET: INCLUSIONS & EXCLUSIONS
TABLE 2
RISK ASSESSMENT: CAPNOGRAPHY EQUIPMENT MARKET
TABLE 3
NUMBER OF DEATHS DUE TO COVID-19, INFLUENZA, AND RSV, 2020–2024 (TILL FEBRUARY 17)
TABLE 4
CAPNOGRAPHY EQUIPMENT MARKET: CURRENT UNMET NEEDS
TABLE 5
CAPNOGRAPHY EQUIPMENT MARKET: PORTER’S FIVE FORCES
TABLE 6
GDP PERCENTAGE CHANGE, BY KEY COUNTRY, 2021–2030
TABLE 7
INDICATIVE SELLING PRICE OF TOP THREE APPLICATIONS, BY KEY PLAYER, 2024 (USD THOUSAND)
TABLE 8
AVERAGE SELLING PRICE TREND OF CAPNOGRAPHY EQUIPMENT, BY TYPE, 2022–2024 (USD THOUSAND)
TABLE 9
AVERAGE PRICING TREND OF CAPNOGRAPHY EQUIPMENT, BY REGION, 2022–2024 (USD THOUSAND)
TABLE 10
IMPORT DATA FOR HS CODE 9018, BY COUNTRY, 2020–2024 (USD THOUSAND)
TABLE 11
EXPORT DATA FOR HS CODE 9018, BY COUNTRY, 2020–2024 (USD THOUSAND)
TABLE 12
CAPNOGRAPHY EQUIPMENT MARKET: DETAILED LIST OF KEY CONFERENCES & EVENTS (2025–2026)
TABLE 13
US-ADJUSTED RECIPROCAL TARIFF RATES
TABLE 14
KEY PRODUCT-RELATED TARIFFS EFFECTIVE FOR CAPNOGRAPHY EQUIPMENT
TABLE 15
TOP USE CASES AND MARKET POTENTIAL
TABLE 16
CAPNOGRAPHY EQUIPMENT MARKET: CASE STUDIES RELATED TO AI IMPLEMENTATION
TABLE 17
INTERCONNECTED ADJACENT ECOSYSTEM AND IMPACT ON MARKET PLAYERS
TABLE 18
NORTH AMERICA: REGULATORY BODIES, GOVERNMENT AGENCIES, AND OTHER ORGANIZATIONS
TABLE 19
EUROPE: REGULATORY BODIES, GOVERNMENT AGENCIES, AND OTHER ORGANIZATIONS
TABLE 20
ASIA PACIFIC: REGULATORY BODIES, GOVERNMENT AGENCIES, AND OTHER ORGANIZATIONS
TABLE 21
LATIN AMERICA: REGULATORY BODIES, GOVERNMENT AGENCIES, AND OTHER ORGANIZATIONS
TABLE 22
MIDDLE EAST & AFRICA: REGULATORY BODIES, GOVERNMENT AGENCIES, AND OTHER ORGANIZATIONS
TABLE 23
US FDA: MEDICAL DEVICE REGULATORY APPROVAL PROCESS
TABLE 24
GLOBAL STANDARDS IN CAPNOGRAPHY EQUIPMENT MARKET
TABLE 25
CERTIFICATIONS, LABELING, ECO-STANDARDS IN CAPNOGRAPHY EQUIPMENT MARKET
TABLE 26
INFLUENCE OF STAKEHOLDERS ON BUYING PROCESS FOR THREE END USERS
TABLE 27
KEY BUYING CRITERIA FOR TOP THREE CAPNOGRAPHY EQUIPMENT END USERS
TABLE 28
CAPNOGRAPHY EQUIPMENT MARKET: UNMET NEEDS/END-USER EXPECTATIONS
TABLE 29
CAPNOGRAPHY EQUIPMENT MARKET, BY PRODUCT, 2023–2030 (USD MILLION)
TABLE 30
CAPNOGRAPHY EQUIPMENT MARKET, BY PRODUCT, 2023 (UNITS)
TABLE 31
EQUIPMENT MARKET, BY TYPE, 2023–2030 (USD MILLION)
TABLE 32
EQUIPMENT MARKET, BY REGION, 2023–2030 (USD MILLION)
TABLE 33
EQUIPMENT MARKET, BY REGION, 2023–2030 (UNITS)
TABLE 34
MULTIPARAMETER CAPNOMETERS MARKET, BY TYPE, 2023–2030 (USD MILLION)
TABLE 35
MULTIPARAMETER CAPNOMETERS MARKET, BY REGION, 2023–2030 (USD MILLION)
TABLE 36
HANDHELD MULTIPARAMETER CAPNOMETERS MARKET, BY REGION, 2023–2030 (USD MILLION)
TABLE 37
CONVENTIONAL MULTIPARAMETER CAPNOMETERS MARKET, BY REGION, 2023–2030 (USD MILLION)
TABLE 38
STANDALONE CAPNOMETERS MARKET, BY TYPE, 2023–2030 (USD MILLION)
TABLE 39
STANDALONE CAPNOMETERS MARKET, BY REGION, 2023–2030 (USD MILLION)
TABLE 40
HANDHELD STANDALONE CAPNOMETERS MARKET, BY REGION, 2023–2030 (USD MILLION)
TABLE 41
CONVENTIONAL STANDALONE CAPNOMETERS MARKET, BY REGION, 2023–2030 (USD MILLION)
TABLE 42
SOFTWARE MARKET, BY REGION, 2023–2030 (USD MILLION)
TABLE 43
CAPNOGRAPHY ACCESSORIES & DISPOSABLES MARKET, BY REGION, 2023–2030 (USD MILLION)
TABLE 44
CAPNOGRAPHY ACCESSORIES & DISPOSABLES MARKET, BY REGION, 2023–2030 (UNITS)
TABLE 45
CAPNOGRAPHY EQUIPMENT MARKET, BY TECHNOLOGY, 2023–2030 (USD MILLION)
TABLE 46
MAINSTREAM CAPNOGRAPHY MARKET, BY REGION, 2023–2030 (USD MILLION)
TABLE 47
SIDESTREAM CAPNOGRAPHY MARKET, BY REGION, 2023–2030 (USD MILLION)
TABLE 48
MICROSTREAM CAPNOGRAPHY MARKET, BY REGION 2023–2030 (USD MILLION)
TABLE 49
CAPNOGRAPHY EQUIPMENT MARKET, BY APPLICATION, 2023–2030 (USD MILLION)
TABLE 50
CAPNOGRAPHY EQUIPMENT MARKET FOR CARDIAC CARE APPLICATIONS, BY REGION, 2023–2030 (USD MILLION)
TABLE 51
CAPNOGRAPHY EQUIPMENT MARKET FOR TRAUMA & EMERGENCY CARE APPLICATIONS, BY REGION, 2023–2030 (USD MILLION)
TABLE 52
CAPNOGRAPHY EQUIPMENT MARKET FOR RESPIRATORY MONITORING APPLICATIONS, BY REGION, 2023–2030 (USD MILLION)
TABLE 53
CAPNOGRAPHY EQUIPMENT MARKET FOR OTHER APPLICATIONS, BY REGION, 2023–2030 (USD MILLION)
TABLE 54
CAPNOGRAPHY EQUIPMENT MARKET, BY END USER, 2023–2030 (USD MILLION)
TABLE 55
CAPNOGRAPHY EQUIPMENT MARKET FOR HOSPITALS, BY REGION, 2023–2030 (USD MILLION)
TABLE 56
CAPNOGRAPHY EQUIPMENT MARKET FOR AMBULATORY SURGERY CENTERS & HOME CARE SETTINGS, BY REGION, 2023–2030 (USD MILLION)
TABLE 57
CAPNOGRAPHY EQUIPMENT MARKET FOR OTHER END USERS, BY REGION, 2023–2030 (USD MILLION)
TABLE 58
CAPNOGRAPHY EQUIPMENT MARKET, BY REGION, 2023–2030 (USD MILLION)
TABLE 59
NORTH AMERICA: CAPNOGRAPHY EQUIPMENT MARKET, BY COUNTRY, 2023–2030 (USD MILLION)
TABLE 60
NORTH AMERICA: CAPNOGRAPHY EQUIPMENT MARKET, BY PRODUCT, 2023–2030 (USD MILLION)
TABLE 61
NORTH AMERICA: EQUIPMENT MARKET, BY TYPE, 2023–2030 (USD MILLION)
TABLE 62
NORTH AMERICA: MULTIPARAMETER CAPNOMETERS MARKET, BY TYPE, 2023–2030 (USD MILLION)
TABLE 63
NORTH AMERICA: STANDALONE CAPNOMETERS MARKET, BY TYPE, 2023–2030 (USD MILLION)
TABLE 64
NORTH AMERICA: CAPNOGRAPHY EQUIPMENT MARKET, BY TECHNOLOGY, 2023–2030 (USD MILLION)
TABLE 65
NORTH AMERICA: CAPNOGRAPHY EQUIPMENT MARKET, BY APPLICATION, 2023–2030 (USD MILLION)
TABLE 66
NORTH AMERICA: CAPNOGRAPHY EQUIPMENT MARKET, BY END USER, 2023–2030 (USD MILLION)
TABLE 67
US: CAPNOGRAPHY EQUIPMENT MARKET, BY PRODUCT, 2023–2030 (USD MILLION)
TABLE 68
US: EQUIPMENT MARKET, BY TYPE, 2023–2030 (USD MILLION)
TABLE 69
US: MULTIPARAMETER CAPNOMETERS MARKET, BY TYPE, 2023–2030 (USD MILLION)
TABLE 70
US: STANDALONE CAPNOMETERS MARKET, BY TYPE, 2023–2030 (USD MILLION)
TABLE 71
US: CAPNOGRAPHY EQUIPMENT MARKET, BY TECHNOLOGY, 2023–2030 (USD MILLION)
TABLE 72
US: CAPNOGRAPHY EQUIPMENT MARKET, BY APPLICATION, 2023–2030 (USD MILLION)
TABLE 73
US: CAPNOGRAPHY EQUIPMENT MARKET, BY END USER, 2023–2030 (USD MILLION)
TABLE 74
CANADA: CAPNOGRAPHY EQUIPMENT MARKET, BY PRODUCT, 2023–2030 (USD MILLION)
TABLE 75
CANADA: EQUIPMENT MARKET, BY TYPE, 2023–2030 (USD MILLION)
TABLE 76
CANADA: MULTIPARAMETER CAPNOMETERS MARKET, BY TYPE, 2023–2030 (USD MILLION)
TABLE 77
CANADA: STANDALONE CAPNOMETERS MARKET, BY TYPE, 2023–2030 (USD MILLION)
TABLE 78
CANADA: CAPNOGRAPHY EQUIPMENT MARKET, BY TECHNOLOGY, 2023–2030 (USD MILLION)
TABLE 79
CANADA: CAPNOGRAPHY EQUIPMENT MARKET, BY APPLICATION, 2023–2030 (USD MILLION)
TABLE 80
CANADA: CAPNOGRAPHY EQUIPMENT MARKET, BY END USER, 2023–2030 (USD MILLION)
TABLE 81
EUROPE: CAPNOGRAPHY EQUIPMENT MARKET, BY COUNTRY, 2023–2030 (USD MILLION)
TABLE 82
EUROPE: CAPNOGRAPHY EQUIPMENT MARKET, BY PRODUCT, 2023–2030 (USD MILLION)
TABLE 83
EUROPE: EQUIPMENT MARKET, BY TYPE, 2023–2030 (USD MILLION)
TABLE 84
EUROPE: MULTIPARAMETER CAPNOMETERS MARKET, BY TYPE, 2023–2030 (USD MILLION)
TABLE 85
EUROPE: STANDALONE CAPNOMETERS MARKET, BY TYPE, 2023–2030 (USD MILLION)
TABLE 86
EUROPE: CAPNOGRAPHY EQUIPMENT MARKET, BY TECHNOLOGY, 2023–2030 (USD MILLION)
TABLE 87
EUROPE: CAPNOGRAPHY EQUIPMENT MARKET, BY APPLICATION, 2023–2030 (USD MILLION)
TABLE 88
EUROPE: CAPNOGRAPHY EQUIPMENT MARKET, BY END USER, 2023–2030 (USD MILLION)
TABLE 89
GERMANY: CAPNOGRAPHY EQUIPMENT MARKET, BY PRODUCT, 2023–2030 (USD MILLION)
TABLE 90
GERMANY: EQUIPMENT MARKET, BY TYPE, 2023–2030 (USD MILLION)
TABLE 91
GERMANY: MULTIPARAMETER CAPNOMETERS MARKET, BY TYPE, 2023–2030 (USD MILLION)
TABLE 92
GERMANY: STANDALONE CAPNOMETERS MARKET, BY TYPE, 2023–2030 (USD MILLION)
TABLE 93
GERMANY: CAPNOGRAPHY EQUIPMENT MARKET, BY TECHNOLOGY, 2023–2030 (USD MILLION)
TABLE 94
GERMANY: CAPNOGRAPHY EQUIPMENT MARKET, BY APPLICATION, 2023–2030 (USD MILLION)
TABLE 95
GERMANY: CAPNOGRAPHY EQUIPMENT MARKET, BY END USER, 2023–2030 (USD MILLION)
TABLE 96
UK: CAPNOGRAPHY EQUIPMENT MARKET, BY PRODUCT, 2023–2030 (USD MILLION)
TABLE 97
UK: CAPNOGRAPHY EQUIPMENT MARKET, BY PRODUCT, 2023 (UNITS)
TABLE 98
UK: EQUIPMENT MARKET, BY TYPE, 2023–2030 (USD MILLION)
TABLE 99
UK: MULTIPARAMETER CAPNOMETERS MARKET, BY TYPE, 2023–2030 (USD MILLION)
TABLE 100
UK: STANDALONE CAPNOMETERS MARKET, BY TYPE, 2023–2030 (USD MILLION)
TABLE 101
UK: CAPNOGRAPHY EQUIPMENT MARKET, BY TECHNOLOGY, 2023–2030 (USD MILLION)
TABLE 102
UK: CAPNOGRAPHY EQUIPMENT MARKET, BY APPLICATION, 2023–2030 (USD MILLION)
TABLE 103
UK: CAPNOGRAPHY EQUIPMENT MARKET, BY END USER, 2023–2030 (USD MILLION)
TABLE 104
FRANCE: CAPNOGRAPHY EQUIPMENT MARKET, BY PRODUCT, 2023–2030 (USD MILLION)
TABLE 105
FRANCE: EQUIPMENT MARKET, BY TYPE, 2023–2030 (USD MILLION)
TABLE 106
FRANCE: MULTIPARAMETER CAPNOMETERS MARKET, BY TYPE, 2023–2030 (USD MILLION)
TABLE 107
FRANCE: STANDALONE CAPNOMETERS MARKET, BY TYPE, 2023–2030 (USD MILLION)
TABLE 108
FRANCE: CAPNOGRAPHY EQUIPMENT MARKET, BY TECHNOLOGY, 2023–2030 (USD MILLION)
TABLE 109
FRANCE: CAPNOGRAPHY EQUIPMENT MARKET, BY APPLICATION, 2023–2030 (USD MILLION)
TABLE 110
FRANCE: CAPNOGRAPHY EQUIPMENT MARKET, BY END USER, 2023–2030 (USD MILLION)
TABLE 111
ITALY: CAPNOGRAPHY EQUIPMENT MARKET, BY PRODUCT, 2023–2030 (USD MILLION)
TABLE 112
ITALY: EQUIPMENT MARKET, BY TYPE, 2023–2030 (USD MILLION)
TABLE 113
ITALY: MULTIPARAMETER CAPNOMETERS MARKET, BY TYPE, 2023–2030 (USD MILLION)
TABLE 114
ITALY: STANDALONE CAPNOMETERS MARKET, BY TYPE, 2023–2030 (USD MILLION)
TABLE 115
ITALY: CAPNOGRAPHY EQUIPMENT MARKET, BY TECHNOLOGY, 2023–2030 (USD MILLION)
TABLE 116
ITALY: CAPNOGRAPHY EQUIPMENT MARKET, BY APPLICATION, 2023–2030 (USD MILLION)
TABLE 117
ITALY: CAPNOGRAPHY EQUIPMENT MARKET, BY END USER, 2023–2030 (USD MILLION)
TABLE 118
SPAIN: CAPNOGRAPHY EQUIPMENT MARKET, BY PRODUCT, 2023–2030 (USD MILLION)
TABLE 119
SPAIN: EQUIPMENT MARKET, BY TYPE, 2023–2030 (USD MILLION)
TABLE 120
SPAIN: MULTIPARAMETER CAPNOMETERS MARKET, BY TYPE, 2023–2030 (USD MILLION)
TABLE 121
SPAIN: STANDALONE CAPNOMETERS MARKET, BY TYPE, 2023–2030 (USD MILLION)
TABLE 122
SPAIN: CAPNOGRAPHY EQUIPMENT MARKET, BY TECHNOLOGY, 2023–2030 (USD MILLION)
TABLE 123
SPAIN: CAPNOGRAPHY EQUIPMENT MARKET, BY APPLICATION, 2023–2030 (USD MILLION)
TABLE 124
SPAIN: CAPNOGRAPHY EQUIPMENT MARKET, BY END USER, 2023–2030 (USD MILLION)
TABLE 125
REST OF EUROPE: CAPNOGRAPHY EQUIPMENT MARKET, BY PRODUCT, 2023–2030 (USD MILLION)
TABLE 126
REST OF EUROPE: EQUIPMENT MARKET, BY TYPE, 2023–2030 (USD MILLION)
TABLE 127
REST OF EUROPE: MULTIPARAMETER CAPNOMETERS MARKET, BY TYPE, 2023–2030 (USD MILLION)
TABLE 128
REST OF EUROPE: STANDALONE CAPNOMETERS MARKET, BY TYPE, 2023–2030 (USD MILLION)
TABLE 129
REST OF EUROPE: CAPNOGRAPHY EQUIPMENT MARKET, BY TECHNOLOGY, 2023–2030 (USD MILLION)
TABLE 130
REST OF EUROPE: CAPNOGRAPHY EQUIPMENT MARKET, BY APPLICATION, 2023–2030 (USD MILLION)
TABLE 131
REST OF EUROPE: CAPNOGRAPHY EQUIPMENT MARKET, BY END USER, 2023–2030 (USD MILLION)
TABLE 132
ASIA PACIFIC: CAPNOGRAPHY EQUIPMENT MARKET, BY COUNTRY, 2023–2030 (USD MILLION)
TABLE 133
ASIA PACIFIC: CAPNOGRAPHY EQUIPMENT MARKET, BY PRODUCT, 2023–2030 (USD MILLION)
TABLE 134
ASIA PACIFIC: EQUIPMENT MARKET, BY TYPE, 2023–2030 (USD MILLION)
TABLE 135
ASIA PACIFIC: MULTIPARAMETER CAPNOMETERS MARKET, BY TYPE, 2023–2030 (USD MILLION)
TABLE 136
ASIA PACIFIC: STANDALONE CAPNOMETERS MARKET, BY TYPE, 2023–2030 (USD MILLION)
TABLE 137
ASIA PACIFIC: CAPNOGRAPHY EQUIPMENT MARKET, BY TECHNOLOGY, 2023–2030 (USD MILLION)
TABLE 138
ASIA PACIFIC: CAPNOGRAPHY EQUIPMENT MARKET, BY APPLICATION, 2023–2030 (USD MILLION)
TABLE 139
ASIA PACIFIC: CAPNOGRAPHY EQUIPMENT MARKET, BY END USER, 2023–2030 (USD MILLION)
TABLE 140
JAPAN: CAPNOGRAPHY EQUIPMENT MARKET, BY PRODUCT, 2023–2030 (USD MILLION)
TABLE 141
JAPAN: EQUIPMENT MARKET, BY TYPE, 2023–2030 (USD MILLION)
TABLE 142
JAPAN: MULTIPARAMETER CAPNOMETERS MARKET, BY TYPE, 2023–2030 (USD MILLION)
TABLE 143
JAPAN: STANDALONE CAPNOMETERS MARKET, BY TYPE, 2023–2030 (USD MILLION)
TABLE 144
JAPAN: CAPNOGRAPHY EQUIPMENT MARKET, BY TECHNOLOGY, 2023–2030 (USD MILLION)
TABLE 145
JAPAN: CAPNOGRAPHY EQUIPMENT MARKET, BY APPLICATION, 2023–2030 (USD MILLION)
TABLE 146
JAPAN: CAPNOGRAPHY EQUIPMENT MARKET, BY END USER, 2023–2030 (USD MILLION)
TABLE 147
CHINA: CAPNOGRAPHY EQUIPMENT MARKET, BY PRODUCT, 2023–2030 (USD MILLION)
TABLE 148
CHINA: EQUIPMENT MARKET, BY TYPE, 2023–2030 (USD MILLION)
TABLE 149
CHINA: MULTIPARAMETER CAPNOMETERS MARKET, BY TYPE, 2023–2030 (USD MILLION)
TABLE 150
CHINA: STANDALONE CAPNOMETERS MARKET, BY TYPE, 2023–2030 (USD MILLION)
TABLE 151
CHINA: CAPNOGRAPHY EQUIPMENT MARKET, BY TECHNOLOGY, 2023–2030 (USD MILLION)
TABLE 152
CHINA: CAPNOGRAPHY EQUIPMENT MARKET, BY APPLICATION, 2023–2030 (USD MILLION)
TABLE 153
CHINA: CAPNOGRAPHY EQUIPMENT MARKET, BY END USER, 2023–2030 (USD MILLION)
TABLE 154
INDIA: CAPNOGRAPHY EQUIPMENT MARKET, BY PRODUCT, 2023–2030 (USD MILLION)
TABLE 155
INDIA: EQUIPMENT MARKET, BY TYPE, 2023–2030 (USD MILLION)
TABLE 156
INDIA: MULTIPARAMETER CAPNOMETERS MARKET, BY TYPE, 2023–2030 (USD MILLION)
TABLE 157
INDIA: STANDALONE CAPNOMETERS MARKET, BY TYPE, 2023–2030 (USD MILLION)
TABLE 158
INDIA: CAPNOGRAPHY EQUIPMENT MARKET, BY TECHNOLOGY, 2023–2030 (USD MILLION)
TABLE 159
INDIA: CAPNOGRAPHY EQUIPMENT MARKET, BY APPLICATION, 2023–2030 (USD MILLION)
TABLE 160
INDIA: CAPNOGRAPHY EQUIPMENT MARKET, BY END USER, 2023–2030 (USD MILLION)
TABLE 161
AUSTRALIA: CAPNOGRAPHY EQUIPMENT MARKET, BY PRODUCT, 2023–2030 (USD MILLION)
TABLE 162
AUSTRALIA: EQUIPMENT MARKET, BY TYPE, 2023–2030 (USD MILLION)
TABLE 163
AUSTRALIA: MULTIPARAMETER CAPNOMETERS MARKET, BY TYPE, 2023–2030 (USD MILLION)
TABLE 164
AUSTRALIA: STANDALONE CAPNOMETERS MARKET, BY TYPE, 2023–2030 (USD MILLION)
TABLE 165
AUSTRALIA: CAPNOGRAPHY EQUIPMENT MARKET, BY TECHNOLOGY, 2023–2030 (USD MILLION)
TABLE 166
AUSTRALIA: CAPNOGRAPHY EQUIPMENT MARKET, BY APPLICATION, 2023–2030 (USD MILLION)
TABLE 167
AUSTRALIA: CAPNOGRAPHY EQUIPMENT MARKET, BY END USER, 2023–2030 (USD MILLION)
TABLE 168
SOUTH KOREA: CAPNOGRAPHY EQUIPMENT MARKET, BY PRODUCT, 2023–2030 (USD MILLION)
TABLE 169
SOUTH KOREA: EQUIPMENT MARKET, BY TYPE, 2023–2030 (USD MILLION)
TABLE 170
SOUTH KOREA: MULTIPARAMETER CAPNOMETERS MARKET, BY TYPE, 2023–2030 (USD MILLION)
TABLE 171
SOUTH KOREA: STANDALONE CAPNOMETERS MARKET, BY TYPE, 2023–2030 (USD MILLION)
TABLE 172
SOUTH KOREA: CAPNOGRAPHY EQUIPMENT MARKET, BY TECHNOLOGY, 2023–2030 (USD MILLION)
TABLE 173
SOUTH KOREA: CAPNOGRAPHY EQUIPMENT MARKET, BY APPLICATION, 2023–2030 (USD MILLION)
TABLE 174
SOUTH KOREA: CAPNOGRAPHY EQUIPMENT MARKET, BY END USER, 2023–2030 (USD MILLION)
TABLE 175
REST OF ASIA PACIFIC: CAPNOGRAPHY EQUIPMENT MARKET, BY PRODUCT, 2023–2030 (USD MILLION)
TABLE 176
REST OF ASIA PACIFIC: EQUIPMENT MARKET, BY TYPE, 2023–2030 (USD MILLION)
TABLE 177
REST OF ASIA PACIFIC: MULTIPARAMETER CAPNOMETERS MARKET, BY TYPE, 2023–2030 (USD MILLION)
TABLE 178
REST OF ASIA PACIFIC: STANDALONE CAPNOMETERS MARKET, BY TYPE, 2023–2030 (USD MILLION)
TABLE 179
REST OF ASIA PACIFIC: CAPNOGRAPHY EQUIPMENT MARKET, BY TECHNOLOGY, 2023–2030 (USD MILLION)
TABLE 180
REST OF ASIA PACIFIC: CAPNOGRAPHY EQUIPMENT MARKET, BY APPLICATION, 2023–2030 (USD MILLION)
TABLE 181
REST OF ASIA PACIFIC: CAPNOGRAPHY EQUIPMENT MARKET, BY END USER, 2023–2030 (USD MILLION)
TABLE 182
LATIN AMERICA: CAPNOGRAPHY EQUIPMENT MARKET, BY COUNTRY, 2023–2030 (USD MILLION)
TABLE 183
LATIN AMERICA: CAPNOGRAPHY EQUIPMENT MARKET, BY PRODUCT, 2023–2030 (USD MILLION)
TABLE 184
LATIN AMERICA: EQUIPMENT MARKET, BY TYPE, 2023–2030 (USD MILLION)
TABLE 185
LATIN AMERICA: MULTIPARAMETER CAPNOMETERS MARKET, BY TYPE, 2023–2030 (USD MILLION)
TABLE 186
LATIN AMERICA: STANDALONE CAPNOMETERS MARKET, BY TYPE, 2023–2030 (USD MILLION)
TABLE 187
LATIN AMERICA: CAPNOGRAPHY EQUIPMENT MARKET, BY TECHNOLOGY, 2023–2030 (USD MILLION)
TABLE 188
LATIN AMERICA: CAPNOGRAPHY EQUIPMENT MARKET, BY APPLICATION, 2023–2030 (USD MILLION)
TABLE 189
LATIN AMERICA: CAPNOGRAPHY EQUIPMENT MARKET, BY END USER, 2023–2030 (USD MILLION)
TABLE 190
BRAZIL: CAPNOGRAPHY EQUIPMENT MARKET, BY PRODUCT, 2023–2030 (USD MILLION)
TABLE 191
BRAZIL: EQUIPMENT MARKET, BY TYPE, 2023–2030 (USD MILLION)
TABLE 192
BRAZIL: MULTIPARAMETER CAPNOMETERS MARKET, BY TYPE, 2023–2030 (USD MILLION)
TABLE 193
BRAZIL: STANDALONE CAPNOMETERS MARKET, BY TYPE, 2023–2030 (USD MILLION)
TABLE 194
BRAZIL: CAPNOGRAPHY EQUIPMENT MARKET, BY TECHNOLOGY, 2023–2030 (USD MILLION)
TABLE 195
BRAZIL: CAPNOGRAPHY EQUIPMENT MARKET, BY APPLICATION, 2023–2030 (USD MILLION)
TABLE 196
BRAZIL: CAPNOGRAPHY EQUIPMENT MARKET, BY END USER, 2023–2030 (USD MILLION)
TABLE 197
MEXICO: CAPNOGRAPHY EQUIPMENT MARKET, BY PRODUCT, 2023–2030 (USD MILLION)
TABLE 198
MEXICO: CAPNOGRAPHY EQUIPMENT MARKET, BY PRODUCT, 2023 (UNITS)
TABLE 199
MEXICO: EQUIPMENT MARKET, BY TYPE, 2023–2030 (USD MILLION)
TABLE 200
MEXICO: MULTIPARAMETER CAPNOMETERS MARKET, BY TYPE, 2023–2030 (USD MILLION)
TABLE 201
MEXICO: STANDALONE CAPNOMETERS MARKET, BY TYPE, 2023–2030 (USD MILLION)
TABLE 202
MEXICO: CAPNOGRAPHY EQUIPMENT MARKET, BY TECHNOLOGY, 2023–2030 (USD MILLION)
TABLE 203
MEXICO: CAPNOGRAPHY EQUIPMENT MARKET, BY APPLICATION, 2023–2030 (USD MILLION)
TABLE 204
MEXICO: CAPNOGRAPHY EQUIPMENT MARKET, BY END USER, 2023–2030 (USD MILLION)
TABLE 205
REST OF LATIN AMERICA: CAPNOGRAPHY EQUIPMENT MARKET, BY PRODUCT, 2023–2030 (USD MILLION)
TABLE 206
REST OF LATIN AMERICA: CAPNOGRAPHY EQUIPMENT MARKET, BY PRODUCT, 2023 (UNITS)
TABLE 207
REST OF LATIN AMERICA: EQUIPMENT MARKET, BY TYPE, 2023–2030 (USD MILLION)
TABLE 208
REST OF LATIN AMERICA: MULTIPARAMETER CAPNOMETERS MARKET, BY TYPE, 2023–2030 (USD MILLION)
TABLE 209
REST OF LATIN AMERICA: STANDALONE CAPNOMETERS MARKET, BY TYPE, 2023–2030 (USD MILLION)
TABLE 210
REST OF LATIN AMERICA: CAPNOGRAPHY EQUIPMENT MARKET, BY TECHNOLOGY, 2023–2030 (USD MILLION)
TABLE 211
REST OF LATIN AMERICA: CAPNOGRAPHY EQUIPMENT MARKET, BY APPLICATION, 2023–2030 (USD MILLION)
TABLE 212
REST OF LATIN AMERICA: CAPNOGRAPHY EQUIPMENT MARKET, BY END USER, 2023–2030 (USD MILLION)
TABLE 213
MIDDLE EAST & AFRICA: CAPNOGRAPHY EQUIPMENT MARKET, BY REGION, 2023–2030 (USD MILLION)
TABLE 214
MIDDLE EAST & AFRICA: CAPNOGRAPHY EQUIPMENT MARKET, BY PRODUCT, 2023–2030 (USD MILLION)
TABLE 215
MIDDLE EAST & AFRICA: EQUIPMENT MARKET, BY TYPE, 2023–2030 (USD MILLION)
TABLE 216
MIDDLE EAST & AFRICA: MULTIPARAMETER CAPNOMETERS MARKET, BY TYPE, 2023–2030 (USD MILLION)
TABLE 217
MIDDLE EAST & AFRICA: STANDALONE CAPNOMETERS MARKET, BY TYPE, 2023–2030 (USD MILLION)
TABLE 218
MIDDLE EAST & AFRICA: CAPNOGRAPHY EQUIPMENT MARKET, BY TECHNOLOGY, 2023–2030 (USD MILLION)
TABLE 219
MIDDLE EAST & AFRICA: CAPNOGRAPHY EQUIPMENT MARKET, BY APPLICATION, 2023–2030 (USD MILLION)
TABLE 220
MIDDLE EAST & AFRICA: CAPNOGRAPHY EQUIPMENT MARKET, BY END USER, 2023–2030 (USD MILLION)
TABLE 221
GCC COUNTRIES: CAPNOGRAPHY EQUIPMENT MARKET, BY PRODUCT, 2023–2030 (USD MILLION)
TABLE 222
GCC COUNTRIES: EQUIPMENT MARKET, BY TYPE, 2023–2030 (USD MILLION)
TABLE 223
GCC COUNTRIES: MULTIPARAMETER CAPNOMETERS MARKET, BY TYPE, 2023–2030 (USD MILLION)
TABLE 224
GCC COUNTRIES: STANDALONE CAPNOMETERS MARKET, BY TYPE, 2023–2030 (USD MILLION)
TABLE 225
GCC COUNTRIES: CAPNOGRAPHY EQUIPMENT MARKET, BY TECHNOLOGY, 2023–2030 (USD MILLION)
TABLE 226
GCC COUNTRIES: CAPNOGRAPHY EQUIPMENT MARKET, BY APPLICATION, 2023–2030 (USD MILLION)
TABLE 227
GCC COUNTRIES: CAPNOGRAPHY EQUIPMENT MARKET, BY END USER, 2023–2030 (USD MILLION)
TABLE 228
REST OF MIDDLE EAST & AFRICA: CAPNOGRAPHY EQUIPMENT MARKET, BY PRODUCT, 2023–2030 (USD MILLION)
TABLE 229
REST OF MIDDLE EAST & AFRICA: CAPNOGRAPHY EQUIPMENT MARKET, BY PRODUCT, 2023 (UNITS)
TABLE 230
REST OF MIDDLE EAST & AFRICA: EQUIPMENT MARKET, BY TYPE, 2023–2030 (USD MILLION)
TABLE 231
REST OF MIDDLE EAST & AFRICA: MULTIPARAMETER CAPNOMETERS MARKET, BY TYPE, 2023–2030 (USD MILLION)
TABLE 232
REST OF MIDDLE EAST & AFRICA: STANDALONE CAPNOMETERS MARKET, BY TYPE, 2023–2030 (USD MILLION)
TABLE 233
REST OF MIDDLE EAST & AFRICA: CAPNOGRAPHY EQUIPMENT MARKET, BY TECHNOLOGY, 2023–2030 (USD MILLION)
TABLE 234
REST OF MIDDLE EAST & AFRICA: CAPNOGRAPHY EQUIPMENT MARKET, BY APPLICATION, 2023–2030 (USD MILLION)
TABLE 235
REST OF MIDDLE EAST & AFRICA: CAPNOGRAPHY EQUIPMENT MARKET, BY END USER, 2023–2030 (USD MILLION)
TABLE 236
STRATEGIES ADOPTED BY KEY PLAYERS IN CAPNOGRAPHY EQUIPMENT MARKET, JANUARY 2021–OCTOBER 2025
TABLE 237
CAPNOGRAPHY EQUIPMENT MARKET: DEGREE OF COMPETITION
TABLE 238
CAPNOGRAPHY EQUIPMENT MARKET: REGION FOOTPRINT
TABLE 239
CAPNOGRAPHY EQUIPMENT MARKET: PRODUCT FOOTPRINT
TABLE 240
CAPNOGRAPHY EQUIPMENT MARKET: TECHNOLOGY FOOTPRINT
TABLE 241
CAPNOGRAPHY EQUIPMENT MARKET: APPLICATION FOOTPRINT
TABLE 242
CAPNOGRAPHY EQUIPMENT MARKET: END-USER FOOTPRINT
TABLE 243
CAPNOGRAPHY EQUIPMENT MARKET: DETAILED LIST OF KEY STARTUPS/SMES
TABLE 244
CAPNOGRAPHY EQUIPMENT MARKET: COMPETITIVE BENCHMARKING OF KEY STARTUPS/SMES
TABLE 245
CAPNOGRAPHY EQUIPMENT MARKET: PRODUCT APPROVALS, JANUARY 2021–OCTOBER 2025
TABLE 246
CAPNOGRAPHY EQUIPMENT MARKET: DEALS, JANUARY 2021–OCTOBER 2025
TABLE 247
MEDTRONIC PLC: COMPANY OVERVIEW
TABLE 248
MEDTRONIC PLC: PRODUCTS OFFERED
TABLE 249
MEDTRONIC PLC: PRODUCT APPROVALS, JANUARY 2021–OCTOBER 2025
TABLE 250
MEDTRONIC PLC: DEALS, JANUARY 2021–OCTOBER 2025
TABLE 251
KONINKLIJKE PHILIPS N.V.: COMPANY OVERVIEW
TABLE 252
KONINKLIJKE PHILIPS N.V.: PRODUCTS OFFERED
TABLE 253
KONINKLIJKE PHILIPS N.V.: PRODUCT APPROVALS, JANUARY 2021–OCTOBER 2025
TABLE 254
KONINKLIJKE PHILIPS N.V.: DEALS, JANUARY 2021–OCTOBER 2025
TABLE 255
MASIMO CORPORATION: COMPANY OVERVIEW
TABLE 256
MASIMO CORPORATION: PRODUCTS OFFERED
TABLE 257
MASIMO CORPORATION: PRODUCT APPROVALS, JANUARY 2021–OCTOBER 2025
TABLE 258
MASIMO CORPORATION: DEALS, JANUARY 2021–OCTOBER 2025
TABLE 259
GE HEALTHCARE: COMPANY OVERVIEW
TABLE 260
GE HEALTHCARE: PRODUCTS OFFERED
TABLE 261
GE HEALTHCARE: PRODUCT APPROVALS, JANUARY 2021–OCTOBER 2025
TABLE 262
GE HEALTHCARE: DEALS, JANUARY 2021–OCTOBER 2025
TABLE 263
BECTON, DICKINSON AND COMPANY: COMPANY OVERVIEW
TABLE 264
BECTON, DICKINSON AND COMPANY: PRODUCTS OFFERED
TABLE 265
DRÄGERWERK AG & CO. KGAA: COMPANY OVERVIEW
TABLE 266
DRÄGERWERK AG & CO. KGAA: PRODUCTS OFFERED
TABLE 267
DRÄGERWERK AG & CO. KGAA: PRODUCT APPROVALS, JANUARY 2021–OCTOBER 2025
TABLE 268
NIHON KOHDEN CORPORATION: COMPANY OVERVIEW
TABLE 269
NIHON KOHDEN CORPORATION: PRODUCTS OFFERED
TABLE 270
NIHON KOHDEN CORPORATION: DEALS, JANUARY 2021–OCTOBER 2025
TABLE 271
ICU MEDICAL, INC.: COMPANY OVERVIEW
TABLE 272
ICU MEDICAL, INC.: PRODUCTS OFFERED
TABLE 273
ICU MEDICAL, INC.: DEALS, JANUARY 2021–OCTOBER 2025
TABLE 274
SHENZHEN MINDRAY BIO-MEDICAL ELECTRONICS CO., LTD.: COMPANY OVERVIEW
TABLE 275
SHENZHEN MINDRAY BIO-MEDICAL ELECTRONICS CO., LTD.: PRODUCTS OFFERED
TABLE 276
SHENZHEN MINDRAY BIO-MEDICAL ELECTRONICS CO., LTD.: PRODUCT LAUNCHES, JANUARY 2021–OCTOBER 2025
TABLE 277
SHENZHEN MINDRAY BIO-MEDICAL ELECTRONICS CO., LTD.: DEALS, JANUARY 2021–OCTOBER 2025
TABLE 278
ZOLL MEDICAL CORPORATION: COMPANY OVERVIEW
TABLE 279
ZOLL MEDICAL CORPORATION: PRODUCTS OFFERED
TABLE 280
ZOLL MEDICAL CORPORATION: DEALS, JANUARY 2021–OCTOBER 2025
TABLE 281
EDAN INSTRUMENTS, INC.: COMPANY OVERVIEW
TABLE 282
EDAN INSTRUMENTS, INC.: PRODUCTS OFFERED
TABLE 283
HAMILTON MEDICAL: COMPANY OVERVIEW
TABLE 284
HAMILTON MEDICAL: PRODUCTS OFFERED
TABLE 285
HAMILTON MEDICAL: PRODUCT LAUNCHES, JANUARY 2021–OCTOBER 2025
TABLE 286
NONIN: COMPANY OVERVIEW
TABLE 287
NONIN: PRODUCTS OFFERED
TABLE 288
NONIN: PRODUCT LAUNCHES, JANUARY 2021–OCTOBER 2025
TABLE 289
NONIN: DEALS, JANUARY 2021–OCTOBER 2025
TABLE 290
SCHILLER: COMPANY OVERVIEW
TABLE 291
SCHILLER: PRODUCTS OFFERED
TABLE 292
RESMED INC.: COMPANY OVERVIEW
TABLE 293
RESMED INC.: PRODUCTS OFFERED
TABLE 294
BIONICS CO., LTD.: COMPANY OVERVIEW
TABLE 295
BPL MEDICAL TECHNOLOGIES: COMPANY OVERVIEW
TABLE 296
BURTONS MEDICAL EQUIPMENT, LTD.: COMPANY OVERVIEW
TABLE 297
CRITICARE TECHNOLOGIES, INC.: COMPANY OVERVIEW
TABLE 298
DIAMEDICA (UK) LIMITED: COMPANY OVERVIEW
TABLE 299
INFINIUM MEDICAL: COMPANY OVERVIEW
TABLE 300
SPACELABS HEALTHCARE: COMPANY OVERVIEW
TABLE 301
NIDEK MEDICAL INDIA: COMPANY OVERVIEW
TABLE 302
RECORDERS & MEDICARE SYSTEMS PVT. LTD.: COMPANY OVERVIEW
TABLE 303
ZOE MEDICAL, INCORPORATED: COMPANY OVERVIEW
FIGURE 1
CAPNOGRAPHY EQUIPMENT MARKET SEGMENTATION & REGIONAL SCOPE
FIGURE 2
CAPNOGRAPHY EQUIPMENT MARKET: YEARS CONSIDERED
FIGURE 5
BOTTOM-UP APPROACH
FIGURE 6
TOP-DOWN APPROACH
FIGURE 7
SUPPLY-SIDE MARKET SIZE ESTIMATION: REVENUE SHARE ANALYSIS
FIGURE 8
REVENUE SHARE ANALYSIS ILLUSTRATION: MEDTRONIC PLC
FIGURE 9
SUPPLY-SIDE MARKET ESTIMATION: CAPNOGRAPHY EQUIPMENT MARKET (2024)
FIGURE 10
DEMAND-SIDE MARKET ESTIMATION
FIGURE 11
CAGR PROJECTIONS: SUPPLY-SIDE ANALYSIS
FIGURE 12
DATA TRIANGULATION METHODOLOGY
FIGURE 13
RESEARCH ASSUMPTIONS
FIGURE 14
KEY INSIGHTS & MARKET HIGHLIGHTS
FIGURE 15
CAPNOGRAPHY EQUIPMENT MARKET, 2025–2030
FIGURE 16
MAJOR STRATEGIES ADOPTED BY KEY PLAYERS IN CAPNOGRAPHY EQUIPMENT MARKET
FIGURE 17
DISRUPTIVE TRENDS IMPACTING GROWTH OF CAPNOGRAPHY EQUIPMENT MARKET
FIGURE 18
HIGH-GROWTH SEGMENTS AND EMERGING FRONTIERS IN CAPNOGRAPHY EQUIPMENT MARKET, 2024
FIGURE 19
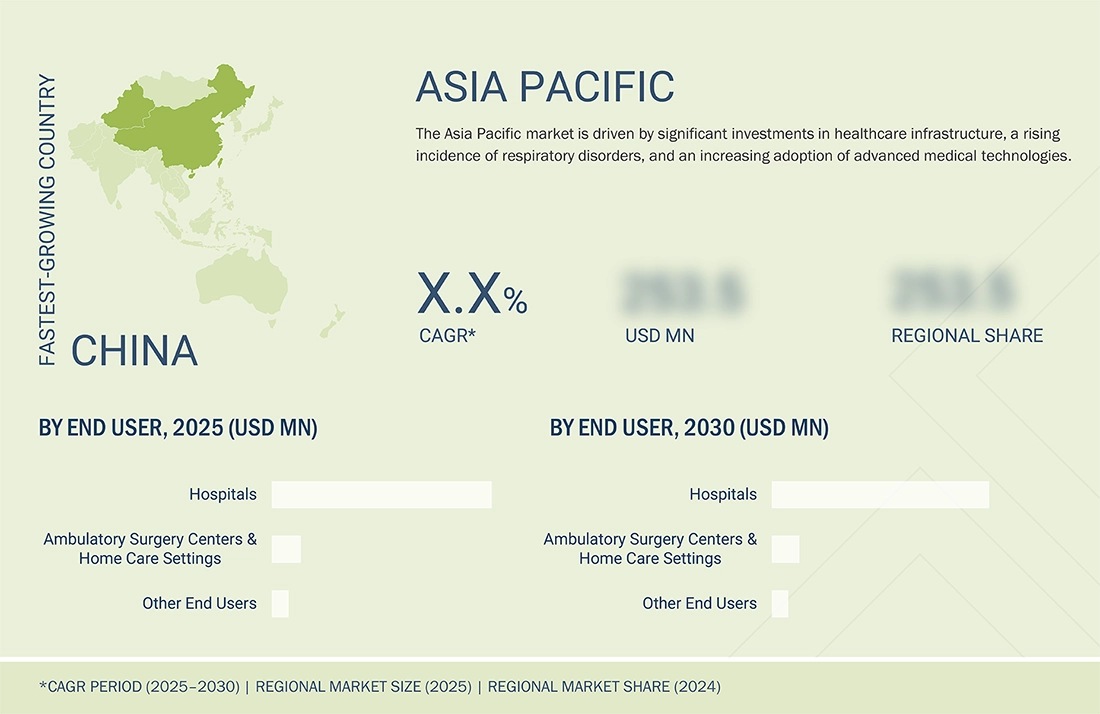
ASIA PACIFIC TO REGISTER HIGHEST GROWTH DURING FORECAST PERIOD
FIGURE 20
INCREASING NUMBER OF CRITICAL SURGERIES AND GROWING FOCUS ON PATIENT SAFETY TO DRIVE MARKET
FIGURE 21
ASIA PACIFIC CAPNOGRAPHY EQUIPMENT MARKET TO REGISTER HIGHEST GROWTH RATE DURING STUDY PERIOD
FIGURE 22
US AND HOSPITALS SEGMENT TO ACCOUNT FOR LARGEST MARKET SHARE IN 2024
FIGURE 23
CHINA TO REGISTER HIGHEST CAGR FROM 2025 TO 2030
FIGURE 24
DEVELOPING MARKETS TO REGISTER HIGHEST GROWTH DURING FORECAST PERIOD
FIGURE 25
CAPNOGRAPHY EQUIPMENT MARKET: DRIVERS, RESTRAINTS, OPPORTUNITIES, AND CHALLENGES
FIGURE 26
CAPNOGRAPHY EQUIPMENT MARKET: PORTER’S FIVE FORCES ANALYSIS
FIGURE 27
CAPNOGRAPHY EQUIPMENT MARKET: SUPPLY CHAIN ANALYSIS
FIGURE 28
CAPNOGRAPHY EQUIPMENT MARKET: ECOSYSTEM ANALYSIS
FIGURE 29
TRENDS/DISRUPTIONS IMPACTING CUSTOMERS’ BUSINESSES
FIGURE 30
INVESTMENT/VENTURE CAPITAL SCENARIO IN CAPNOGRAPHY EQUIPMENT MARKET, 2020–2023
FIGURE 31
TOP PATENT APPLICANTS AND OWNERS (COMPANIES/INSTITUTES) FOR CAPNOGRAPHY EQUIPMENT MARKET (JANUARY 2015–OCTOBER 2025)
FIGURE 32
TOP PATENT APPLICANT COUNTRIES FOR CAPNOGRAPHY EQUIPMENT (JANUARY 2014–DECEMBER 2024)
FIGURE 33
INFLUENCE OF STAKEHOLDERS ON BUYING PROCESS FOR THREE END USERS
FIGURE 34
KEY BUYING CRITERIA FOR TOP THREE END USERS
FIGURE 35
NORTH AMERICA: CAPNOGRAPHY EQUIPMENT MARKET SNAPSHOT
FIGURE 36
ASIA PACIFIC: CAPNOGRAPHY EQUIPMENT MARKET SNAPSHOT
FIGURE 37
REVENUE ANALYSIS OF KEY PLAYERS IN CAPNOGRAPHY EQUIPMENT MARKET, 2020–2024 (USD MILLION)
FIGURE 38
MARKET SHARE ANALYSIS OF KEY PLAYERS IN CAPNOGRAPHY EQUIPMENT MARKET (2024)
FIGURE 39
RANKING OF KEY PLAYERS IN CAPNOGRAPHY EQUIPMENT MARKET, 2024
FIGURE 40
CAPNOGRAPHY EQUIPMENT MARKET: COMPANY EVALUATION MATRIX (KEY PLAYERS), 2024
FIGURE 41
CAPNOGRAPHY EQUIPMENT MARKET: COMPANY FOOTPRINT
FIGURE 42
CAPNOGRAPHY EQUIPMENT MARKET: COMPANY EVALUATION MATRIX (STARTUPS/SMES), 2024
FIGURE 43
EV/EBITDA OF KEY VENDORS
FIGURE 44
YEAR-TO-DATE (YTD) PRICE TOTAL RETURN AND 5-YEAR STOCK BETA OF KEY VENDORS
FIGURE 45
CAPNOGRAPHY EQUIPMENT MARKET: BRAND/PRODUCT COMPARATIVE ANALYSIS
FIGURE 46
MEDTRONIC PLC: COMPANY SNAPSHOT (2025)
FIGURE 47
KONINKLIJKE PHILIPS N.V.: COMPANY SNAPSHOT (2024)
FIGURE 48
MASIMO CORPORATION: COMPANY SNAPSHOT (2024)
FIGURE 49
GE HEALTHCARE: COMPANY SNAPSHOT (2024)
FIGURE 50
BECTON, DICKINSON AND COMPANY: COMPANY SNAPSHOT (2024)
FIGURE 51
DRÄGERWERK AG & CO. KGAA: COMPANY SNAPSHOT (2024)
FIGURE 52
NIHON KOHDEN CORPORATION: COMPANY SNAPSHOT (2023)
FIGURE 53
ICU MEDICAL, INC.: COMPANY SNAPSHOT (2024)
FIGURE 54
SHENZHEN MINDRAY BIO-MEDICAL ELECTRONICS CO., LTD.: COMPANY SNAPSHOT (2024)
FIGURE 55
RESMED INC.: COMPANY SNAPSHOT (2025)

 Request Customisation


Growth opportunities and latent adjacency in Capnography Equipment Market