
Asia Pacific 3D Machine Vision Market (2026-2031)

The Asia Pacific 3D Machine Vision Market was valued at $2257.9 Million in 2026 and projected to reach to $4623.5 Million by 2031, representing a compound annual growth rate of CAGR 12.7%. Asia Pacific's 3D machine vision market is poised for exceptional growth through 2031, driven by the region's unparalleled concentration of semiconductor and electronics manufacturing.


| Market Size in | USD 26.32 MN |
| Market Forecast in | |
| CAGR | |
| Forecast Period | |
| Units Considered | Value (USD MN) |
Asia Pacific 3D Machine Vision Market Trends and Insights
- This accelerated expansion in Asia Pacific significantly outpaces the global average, driven by the region's leadership in semiconductor manufacturing, electronics assembly, and industrial automation.
- Asia Pacific's technological infrastructure and investment in Industry 4.0 initiatives position it as the epicenter of 3D machine vision adoption across quality control, inspection, and robotic guidance applications. The Asia Pacific market benefits from the concentration of major electronics and semiconductor production hubs, particularly in China, Japan, South Korea, and Taiwan.
- Asia Pacific manufacturers are increasingly integrating 3D machine vision systems to enhance precision, reduce defects, and optimize production efficiency.
- Between 2026 and 2031, Asia Pacific is expected to capture substantial market share as regional players invest in advanced imaging technologies and AI-enabled vision solutions.
- The region's competitive manufacturing landscape and rising labor costs are compelling Asia Pacific enterprises to adopt automation, further accelerating 3D machine vision market penetration..
Key Market Statistics
- CAGR (2026-2031) CAGR 12.7%
- Market Size, 2026 ~USD 2257.9 Million
- Forecast, 2031 ~USD 4623.5 Million
- Geography Asia Pacific
Asia Pacific 3D Machine Vision Market Overview
Regional Market Leadership :
Asia Pacific commands the largest share of the global 3D machine vision market, valued at USD 2,257.9 million in 2026, reflecting the region's dominance in advanced manufacturing and semiconductor production.
Accelerated Growth Trajectory :
The region's 12.7% CAGR significantly outpaces the global average of 11.5%, driven by rapid industrialization, increasing automation adoption, and massive investments in semiconductor fabrication facilities across China, Taiwan, South Korea, and Japan.
Projected Market Expansion :
Asia Pacific's 3D machine vision market is forecast to nearly double, reaching USD 4,623.5 million by 2031, underscoring the region's critical role in shaping global technology manufacturing standards and innovation.
Manufacturing Hub Concentration :
The region's dominance is anchored by its concentration of electronics assembly, semiconductor manufacturing, and industrial automation sectors, creating sustained demand for precision inspection and quality control solutions.
Asia Pacific 3D Machine Vision Market Dynamics
- Countries including China, Taiwan, South Korea, and Japan are investing heavily in Industry 4.0 technologies, creating substantial demand for advanced vision systems in quality assurance, defect detection, and automated inspection processes. The region's competitive manufacturing landscape and rising labor costs are accelerating automation adoption, further propelling 3D machine vision adoption.
- With government initiatives supporting smart manufacturing and digital transformation, Asia Pacific will continue commanding market leadership, attracting significant technology investments and fostering innovation in vision-based inspection solutions tailored to high-volume production environments..
Market Ecosystem
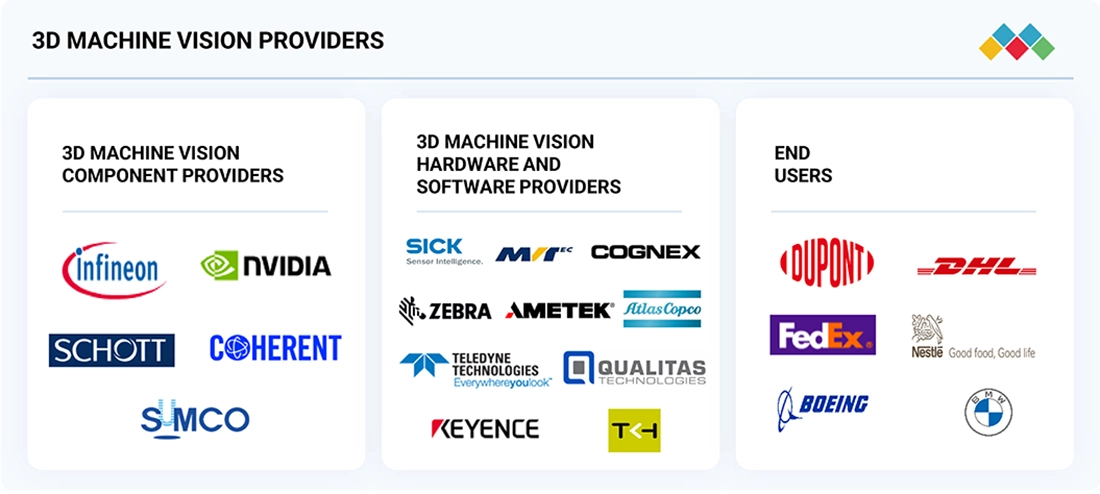
3D MACHINE VISION MARKET: COMMERCIAL USE CASES ACROSS INDUSTRIES
| COMPANY | USE CASE DESCRIPTION | BENEFITS |
|---|---|---|
 |
Deploys 3D vision systems for inline dimensional inspection, surface defect detection, and robotic guidance in automotive and electronics manufacturing. | Improves measurement accuracy, reduces defect rates, and enhances production throughput. |
 |
Provides high resolution 3D cameras and sensors for semiconductor inspection, metrology, and precision assembly validation. | Enables precise depth capture, supports high speed inspection, and improves yield consistency. |
 |
Offers 3D machine vision solutions for automated quality inspection, bin picking, and logistics automation. | Enhances object recognition accuracy, reduces manual intervention, and improves operational efficiency. |
 |
Supplies 3D vision technologies for industrial inspection and smart manufacturing applications. | Strengthens process control, ensures reliable defect detection, and supports scalable automation. |
 |
Integrates 3D vision in assembly and quality assurance systems for automotive and industrial production lines. | Improves assembly precision, reduces rework, and enhances overall production reliability. |
Logos and trademarks shown above are the property of their respective owners. Their use here is for informational and illustrative purposes only.
Related Ecosystem
Industrial Iot
- Sensors
- Pressure Sensors
- Flow Sensors
- Gas Sensors
- Image Sensors
- Siemens ag
- ABB India Limited
- HONEYWELL INTERNATIONAL INC.
- Emerson Electric Co.
- SCHNEIDER ELECTRIC SE
Semiconductor Materials And Components
- Sensors
- Gallium Nitride (GaN)
- Digital Signal Processor (DSP)
- Natural Language Processing (NLP)
- Silicon Carbide
- Texas Instruments Incorporated
- Samsung
- APPLIED MATERIALS, INC.
- Stmicroelectronics
- Lenovo
Key Takeaways
- Asia Pacific 3D machine vision market will nearly double from USD 2,257.9M (2026) to USD 4,623.5M (2031) at a 12.7% CAGR, outpacing global growth.
- Asia Pacific's semiconductor and electronics manufacturing dominance drives demand for advanced inspection and quality control solutions.
- Regional investment in Industry 4.0 and automation technologies accelerates adoption of 3D machine vision systems across Asia Pacific.
- Asia Pacific's competitive cost pressures and labor market dynamics incentivize manufacturers to deploy AI-enabled vision automation.
3D Machine Vision Market Report Scope
| Report Metric | Details |
|---|---|
| Base Year | 2026 |
| Fastest Growing Segment | TIME-OF-FLIGHT (TOF) SYSTEMS (Technology Type) |
| Forecast Period | 2026–2031 |
| Growth Rate | CAGR of 11.5% from 2026 to 2031 |
| Largest Segment | HARDWARE (Component) |
| Market Size Base Year (Billions) | ~USD 5.5 (2026) |
| Revenue Forecast (Billions) | ~USD 9.47 (2031) |
| Segments Covered | Component, Type, Technology Type, Industry |
Asia Pacific 3D Machine Vision Market Report Segmentation
4 segment dimensions are covered across the global market.
By Component
- Hardware
- Software
By Type
- 3D Vision Cameras & Sensors
- Area-Scan Cameras
- Frame Grabbers
- Image Acquisition & Processing Software
- Led Lighting
- Line-Scan Cameras
- Optics & Lenses
- Other Hardware Components
- Processors
- Vision Analysis & Application Software
By Technology Type
- Laser Triangulation Systems
- Stereo Vision Systems
- Structured Lighting Systems
- Time-Of-Flight (Tof) Systems
By Industry
- Automotive
- Consumer Products
- Electronics & Semiconductors
- Food & Beverages
- Logistics/3Pl
- Machinery
- Metals
- Other Industries
- Pharmaceuticals & Medical Devices
- Printing
- Rubbers & Plastics
- Solar Panel Manufacturing
Target Audience
- Semiconductor Manufacturers : Semiconductor fabs across Asia Pacific require detailed market intelligence on 3D vision adoption trends, competitive solutions, and ROI benchmarks to optimize quality control investments and maintain manufacturing competitiveness.
- Electronics OEMs & Contract Manufacturers : Electronics assembly companies in China, Taiwan, and Southeast Asia need Asia Pacific-specific data on machine vision technology adoption, supplier landscapes, and cost-benefit analyses for production line automation decisions.
- Machine Vision Solution Providers : Vision system vendors and integrators targeting Asia Pacific require regional market sizing, competitive positioning data, and vertical-specific demand forecasts to develop localized go-to-market strategies and product roadmaps.
- Industrial Automation Integrators : System integrators operating across Asia Pacific need comprehensive market insights on 3D vision technology trends, customer requirements by country, and growth opportunities to inform service offerings and business development.
- Investment & Strategy Teams : Private equity, venture capital, and corporate strategy teams evaluating Asia Pacific manufacturing technology investments require detailed market analysis, growth drivers, and competitive dynamics to support investment decisions and valuations.
Key Companies in the Asia Pacific 3D Machine Vision Market
| Company | HQ | Ownership | Strongest segments |
|---|---|---|---|
| NOVANTA, INC | United States | Public Company | Precision Medicine and Manufacturing (lasers, beam steering, robotic and precision motion, end-of-arm tooling, bearing spindles),Medical Solutions (insufflators, pumps, disposables, imaging, RFID, motion control, light engines, OR integration), |
| AMS AG | Spain | Public Company | Air Distribution (Amadeus GDS and related services),Air IT Solutions (Altéa, New Skies, airline platforms),Hospitality & Other Solutions, |
| KEYENCE CORPORATION | Japan | Public Company | Photoelectric, fiber, laser, proximity, and positioning sensors,Laser displacement, profilers, optical micrometers, and 3D measurement,Machine vision systems and code readers, |
| COGNEX CORPORATION | United States | Public Company | Vision systems and sensors (In-Sight, VisionPro, QuickBuild),Image-based barcode readers and verifiers (DataMan),Cloud and AI platforms (OneVision and related software), |
| TELEDYNE TECHNOLOGIES INC. | United States | Public Company | Digital Imaging,Instrumentation,Aerospace and Defense Electronics, |
| TKH | Netherlands | Public Company | Smart Vision Systems,Smart Manufacturing Systems,Smart Connectivity Systems, |
| ATLAS COPCO AB | Sweden | Public Company | Compressor Technique,Vacuum Technique,Industrial Technique, |
| BASLER AG | Germany | Public Company | Area scan cameras and accessories,Line scan, SWIR/UV, and 3D cameras,Lenses, illumination, and optomechanical accessories, |
| OMRON CORPORATION | Japan | Public Company | Industrial Automation (sensors, safety, motion, robotics, power supplies, automation systems),Device and Module Solutions (relays, switches, connectors, sensors for digital devices),Social Systems (station systems, traffic control, payment systems, power storage), |
| SICK AG | Germany | Private Company | Detection and Distance Sensors,Safety Sensors and Systems,LiDAR, Radar, and Outdoor Automation, |
| TEXAS INSTRUMENTS INCORPORATED | United States | Public Company | Analog – Power,Analog – Signal Chain,Embedded Processing (MCUs, processors, connectivity, radar), |
| AMETEK, INC. | United States | Public Company | Electronic Instruments Group (EIG),Electromechanical Group (EMG), |
| CANON INC. | Japan | Public Company | Printing Business Unit,Medical Business Unit,Imaging Business Unit, |
| ZEBRA TECHNOLOGIES CORP. | United States | Public Company | Rugged mobile computing and accessories,Barcode scanners, imagers, and fixed industrial scanners,Thermal, RFID, and card printers plus supplies, |
| EMERSON ELECTRIC CO. | United States | Public Company | Final Control,Measurement & Analytical,Control Systems & Software, |
| SONY GROUP CORPORATION | Japan | Public Company | Game & Network Services,Music,Pictures, |
NOVANTA, INC
Novanta, Inc. is a U.S. public company founded in 1968 with 3,000 employees that provides precision motion control and imaging technologies for industrial and medical applications.
AMS AG
AMS AG is a Spanish public company established in 1987 with 20,605 employees, operating in the technology and industrial sectors with a significant international presence.
KEYENCE CORPORATION
Keyence Corporation is a Japanese public company founded in 1972 with 12,784 employees that manufactures automation sensors, vision systems, and measurement instruments for industrial applications.
COGNEX CORPORATION
Cognex Corporation is a U.S. public company founded in 1981 with 2,745 employees specializing in machine vision and industrial barcode readers for manufacturing and logistics.
TELEDYNE TECHNOLOGIES INC.
Teledyne Technologies Inc. is a U.S. public company founded in 1960 with 15,800 employees that provides digital imaging, instrumentation, and aerospace and defense technologies.
TKH
TKH is a Dutch public company founded in 1930 with 5,907 employees operating in technology and infrastructure solutions across multiple industrial sectors.
ATLAS COPCO AB
Atlas Copco AB is a Swedish public company founded in 1873 with 56,520 employees that manufactures compressors, vacuum solutions, and industrial tools for global markets.
BASLER AG
Basler AG is a German public company founded in 1988 with 836 employees specializing in digital camera technology and imaging solutions for industrial applications.
OMRON CORPORATION
Omron Corporation is a Japanese public company founded in 1933 with 26,050 employees that manufactures automation components, sensors, and control systems for industrial use.
SICK AG
Sick AG is a German private company founded in 1946 with 11,804 employees that produces sensors and sensor solutions for factory automation and logistics applications.
TEXAS INSTRUMENTS INCORPORATED
Texas Instruments Incorporated is a U.S. public company founded in 1930 with 33,000 employees that designs and manufactures semiconductors and analog integrated circuits.
AMETEK, INC.
Ametek, Inc. is a U.S. public company founded in 1930 with 22,500 employees providing electronic instruments and electromechanical devices for industrial and aerospace markets.
CANON INC.
Canon Inc. is a Japanese public company founded in 1933 with 165,547 employees that manufactures imaging and optical products including cameras, printers, and medical equipment.
ZEBRA TECHNOLOGIES CORP.
Zebra Technologies Corp. is a U.S. public company founded in 1969 with 10,700 employees specializing in data capture and automatic identification solutions for enterprise mobility.
EMERSON ELECTRIC CO.
Emerson Electric Co. is a U.S. public company founded in 1890 with 71,000 employees providing process management and climate technologies for industrial and commercial applications.
SONY GROUP CORPORATION
Sony Group Corporation is a Japanese public company founded in 1946 with 94,900 employees that manufactures electronics, entertainment, and imaging products across multiple industries.
Countries within Asia Pacific - compare and drill down
| Country | 2025 size (native) |
|---|
Country market size visualization
Reasons to Buy this Report
- Regional Market Sizing & Forecasts : Obtain precise market valuations specific to Asia Pacific (USD 2,257.9M in 2026, USD 4,623.5M in 2031) with country-level breakdowns for China, Japan, South Korea, Taiwan, and emerging markets to inform regional expansion strategies.
- Competitive Landscape Intelligence : Identify leading 3D machine vision vendors operating in Asia Pacific, their market share, product portfolios, and strategic positioning within the region's semiconductor and electronics manufacturing ecosystems.
- Growth Driver Analysis : Understand Asia Pacific-specific catalysts including semiconductor fab expansion, Industry 4.0 adoption rates, labor cost pressures, and government manufacturing initiatives driving the region's 12.7% CAGR outperformance.
- Application & Vertical Insights : Analyze demand patterns across Asia Pacific's key verticals—semiconductor manufacturing, PCB assembly, consumer electronics, and automotive—with segment-specific growth projections and technology adoption trends.
- Investment & Partnership Opportunities : Identify high-growth sub-regions, emerging technology hubs, and strategic partnership opportunities within Asia Pacific's rapidly expanding 3D machine vision ecosystem for market entry and expansion planning.
Frequently asked questions
What is the projected market size of 3D machine vision in Asia Pacific by 2031?
Asia Pacific's 3D machine vision market is projected to reach USD 4,623.5 million by 2031, growing from USD 2,257.9 million in 2026.
What is the CAGR for 3D machine vision in Asia Pacific?
Asia Pacific's 3D machine vision market is expected to grow at a compound annual growth rate of 12.7% from 2026 to 2031.
Which countries in Asia Pacific are driving 3D machine vision adoption?
China, Japan, South Korea, and Taiwan are the primary drivers of Asia Pacific's 3D machine vision market due to their semiconductor and electronics manufacturing leadership.
What applications are fueling 3D machine vision demand in Asia Pacific?
Quality control, defect inspection, robotic guidance, and precision assembly are the primary applications driving 3D machine vision adoption across Asia Pacific manufacturing.
How does Asia Pacific's growth compare to the global 3D machine vision market?
Asia Pacific's 12.7% CAGR exceeds the global average of 11.5%, reflecting the region's accelerated adoption of advanced vision technologies.
RESEARCH METHODOLOGY
The study involved four major activities in estimating the current size of the 3D machine vision market. Exhaustive secondary research has been done to collect information on the market, peer market, and parent market. The next step is to validate these findings, assumptions, and sizing with industry experts across the value chain through primary research. Both top-down and bottom-up approaches have been employed to estimate the complete market size. After that, market breakdown and data triangulation methods were used to estimate the market sizes of segments and subsegments. Two sources of information, secondary and primary, have been used to identify and collect information for an extensive technical and commercial study of the 3D machine vision market.
Secondary Research
Various secondary sources have been referred to in the secondary research process to identify and collect information important for this study. The secondary sources include annual reports, press releases, and investor presentations of companies; white papers; journals and certified publications; and articles from recognized authors, websites, directories, and databases. Secondary research has been conducted to obtain key information about the industry’s supply chain, the market’s value chain, the total pool of key players, market segmentation according to the industry trends (to the bottom-most level), regional markets, and key developments from market- and technology-oriented perspectives. The secondary data has been collected and analyzed to determine the overall market size, further validated by primary research.
Primary Research
Extensive primary research was conducted after gaining knowledge about the current scenario of the 3D machine vision market through secondary research. Several primary interviews were conducted with experts from the demand and supply sides across four major regions: North America, Europe, Asia Pacific, and the RoW. This primary data was collected through questionnaires, emails, and telephonic interviews.
Breakdown of Primary Participants
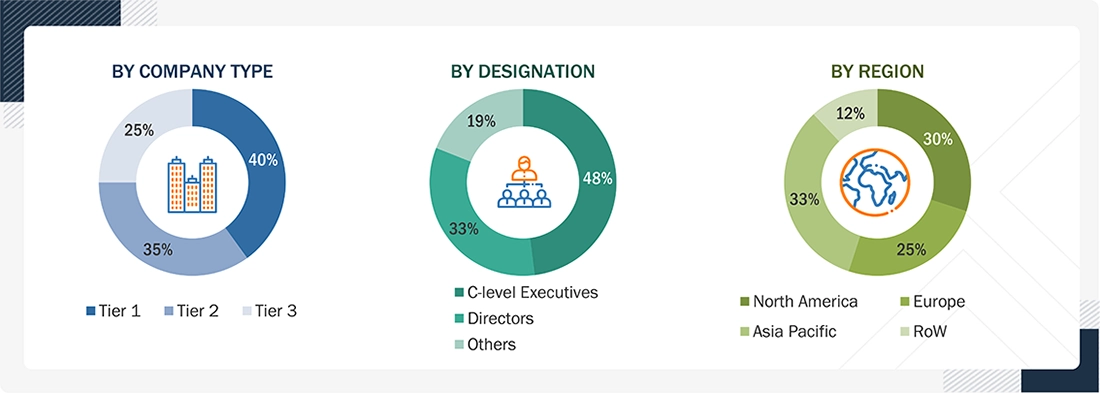
Note: Other designations include product, sales, and marketing managers.
Three tiers of companies have been defined based on their total revenue as of 2024: tier 3: revenue less than USD 500 million; tier 2: revenue between USD 500 million and USD 1 billion; and tier 1: revenue more than USD 1 billion.
To know about the assumptions considered for the study, download the pdf brochure
Market Size Estimation
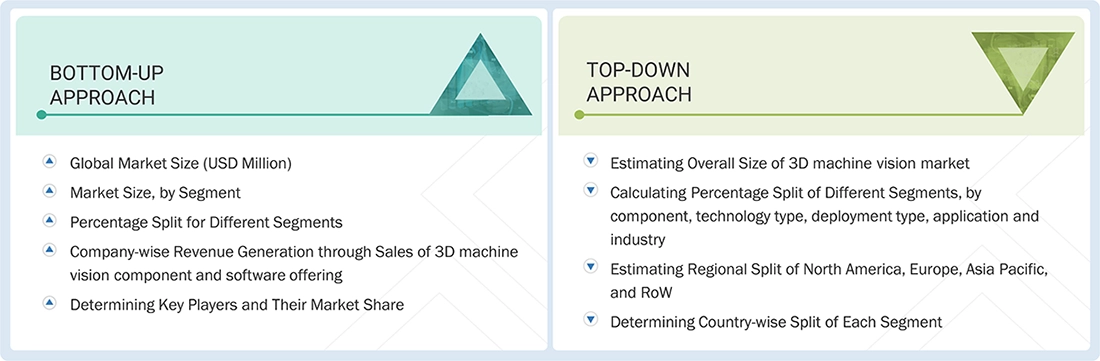
Both top-down and bottom-up approaches have been used to estimate and validate the total size of the 3D machine vision market. These methods have also been widely used to estimate the sizes of various market subsegments. The following research methodology has been used to estimate the market size:
- Major players in the industry and markets have been identified through extensive secondary research.
- The industry’s value chain and market size (in terms of value) have been determined through primary and secondary research processes.
- All percentage shares, splits, and breakdowns have been determined using secondary sources and verified through primary sources.
The market sizing includes the following:
Data Triangulation
After arriving at the overall size of the 3D machine vision market from the market size estimation process explained above, the total market has been split into several segments and subsegments. Data triangulation and market breakdown procedures have been employed, wherever applicable, to complete the overall market engineering process and arrive at the exact statistics for all segments and subsegments of the market. The data has been triangulated by studying various factors and trends from both the demand and supply sides. Along with this, the market size has been validated using both top-down and bottom-up approaches.
Market Definition
3D machine vision refers to vision systems that capture and analyze 3D spatial data to measure depth, height, volume, and surface geometry of objects in real time. Unlike conventional 2D systems that process flat images, 3D machine vision integrates depth-sensing technologies such as structured light, laser triangulation, stereo vision, and time-of-flight to generate point clouds, depth maps, or full 3D models. These systems combine hardware components, including 3D cameras and sensors, optics, illumination, processors, and communication interfaces with advanced software algorithms for image reconstruction, calibration, measurement, and analysis.
Key Stakeholders
- Semiconductor Industry Association (SIA)
- European Machine Vision Association (EMVA)
- Automated Imaging Association (AIA)
- UK Industrial Vision Association (UKIVA)
- Automotive Industry Action Group (AIAG)
- Association for the Advancement of Artificial Intelligence (AAAI)
- To define, describe, and forecast the 3D machine vision market based on component, deployment type, technology type, system type, and industry, in terms of value
- To describe the applications of machine vision systems
- To forecast the market, by component, in terms of volume
- To describe and forecast the size of the 3D machine vision market, by four regions: North America, Europe, Asia Pacific, and the Rest of the World (RoW), along with their respective countries, in terms of value
- To provide detailed information regarding drivers, restraints, opportunities, and challenges influencing market growth
- To strategically analyze micromarkets with respect to individual growth trends, prospects, and contributions to the overall market size
- To study the complete value chain of the 3D machine vision market
- To analyze opportunities for stakeholders by identifying high-growth segments of the 3D machine vision market
- To strategically profile the key players and comprehensively analyze their market positions in terms of their ranking and core competencies
- To analyze competitive developments, such as product launches, acquisitions, collaborations, and partnerships, in the 3D machine vision market
- To provide ecosystem analysis, case study analysis, patent analysis, technology analysis, impact of AI/Gen AI, impact of 2025 US tariff, key conferences and events, Porter’s five forces analysis, and regulations pertaining to the market under study
- To provide a macroeconomic outlook for all the regions
Available customizations:
Based on the given market data, MarketsandMarkets offers customizations tailored to the company’s specific needs. The following customization options are available for the report:
Company Information:
Detailed analysis and profiling of additional market players (up to 5)
Get the Full 3D Machine Vision Market Report
Full forecast, segment splits, and company analysis for all 3D Machine Vision Market.
Need a Tailored Report?
Customize this report to your needs
Get 10% FREE Customization
Customize This Report
