
Australia Augmented and Virtual Reality Market (2026-2031)

The Australia Augmented and Virtual Reality Market was valued at $1202.1 Million in 2026 and projected to reach to $2752.2 Million by 2031, representing a compound annual growth rate of 14.8%. Australia's augmented and virtual reality market is positioned for substantial growth through 2031, driven by accelerating digital transformation across key industries and increasing enterprise investment in immersive technologies.


| Market Size in | USD 26.32 MN |
| Market Forecast in | |
| CAGR | |
| Forecast Period | |
| Units Considered | Value (USD MN) |
Australia Augmented and Virtual Reality Market Trends and Insights
- The region's market size was estimated at $1,202.1 million in 2026 and is forecast to expand to $2,752.2 million by 2031, reflecting a compound annual growth rate of 14.8%.
- This expansion in Rest Of Asia Pacific is driven by increasing digital transformation initiatives, rising consumer adoption of immersive technologies, and growing enterprise investments in AR/VR solutions across manufacturing, retail, and entertainment sectors. Rest Of Asia Pacific's growth trajectory outpaces many mature markets, supported by a young, tech-savvy demographic and improving digital infrastructure.
- The region's AR/VR market benefits from competitive hardware pricing, expanding developer ecosystems, and government support for emerging technology adoption.
- Rest Of Asia Pacific is positioning itself as a key hub for both AR/VR content creation and hardware manufacturing, attracting multinational technology vendors and fostering local innovation. By 2031, Rest Of Asia Pacific is expected to capture an increasingly larger share of global AR/VR spending.
- The region's market dynamics reflect strong demand for enterprise training solutions, gaming applications, and spatial computing platforms.
- Rest Of Asia Pacific's continued investment in 5G infrastructure and edge computing will further accelerate AR/VR deployment across diverse industry verticals..
Key Market Statistics
- CAGR (2026-2031) 14.8% CAGR
- Market Size, 2026 ~USD 1202.1 Million
- Forecast, 2031 ~USD 2752.2 Million
- Country Australia
Australia Augmented and Virtual Reality Market Overview
Market Size Growth :
Australia's AR/VR market is projected to grow from $1,202.1 million in 2026 to $2,752.2 million by 2031, demonstrating strong investment momentum in immersive technologies across the region.
Competitive CAGR Performance :
With a 14.8% CAGR through 2031, Australia's market growth slightly trails the global average of 18.4%, indicating steady but measured adoption compared to leading international markets.
Digital Transformation Driver :
Australian enterprises are increasingly leveraging AR/VR solutions for training, simulation, and customer engagement, supported by government digital economy initiatives and tech-savvy consumer base.
Enterprise & Consumer Adoption :
Growth is fueled by expanding use cases in manufacturing, healthcare, retail, and education sectors, alongside rising consumer interest in gaming and entertainment applications.
Australia Augmented and Virtual Reality Market Dynamics
- The market's 14.8% CAGR reflects strong demand from manufacturing, healthcare, and retail sectors seeking innovative solutions for training, operations, and customer experiences. The Australian market benefits from a digitally mature economy, supportive regulatory environment, and growing venture capital interest in AR/VR startups.
- As 5G infrastructure expands and hardware costs decline, both enterprise adoption and consumer penetration are expected to accelerate, positioning Australia as a significant growth market within the Asia-Pacific region..
Market Ecosystem
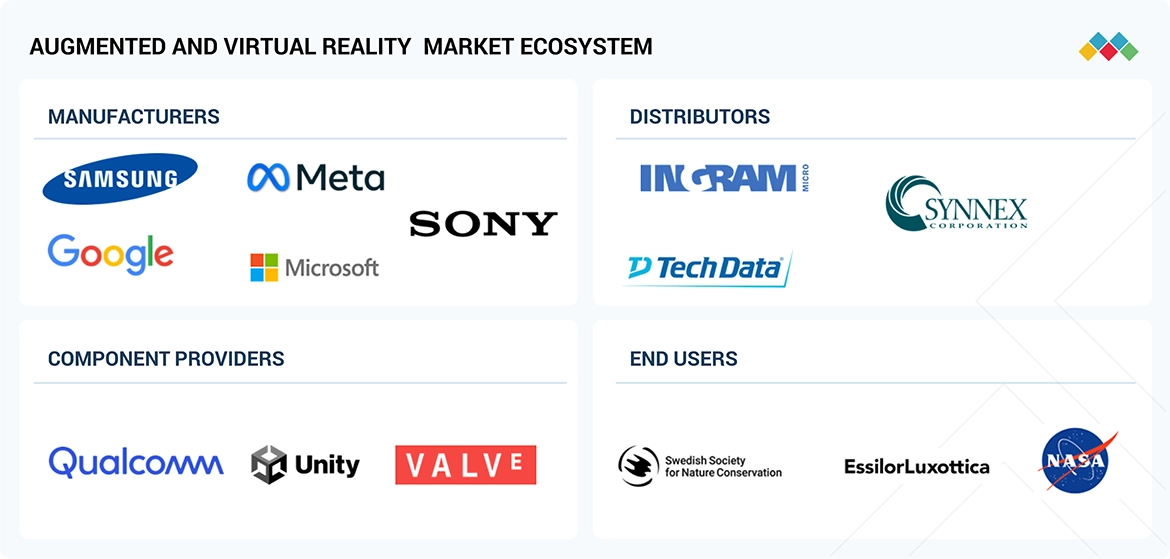
AUGMENTED AND VIRTUAL REALITY MARKET SIZE, SHARE & GROWTH: COMMERCIAL USE CASES ACROSS INDUSTRIES
| COMPANY | USE CASE DESCRIPTION | BENEFITS |
|---|---|---|
 |
Implemented AR and VR technologies for automotive design collaboration, enabling global teams to interact with 3D vehicle models in shared virtual environments, reducing dependence on physical prototypes and in-person meetings | Lowered prototyping and travel costs | Improved design efficiency | Accelerated iteration cycles | Enhanced global collaboration |
 |
Deployed immersive VR solutions to support remote collaboration of automotive design teams, enabling real-time interaction with digital prototypes and facilitating design reviews across geographically dispersed teams | Reduced travel dependency | Improved workflow efficiency | Enabled real-time design modifications | Ensured business continuity during restricted mobility conditions |
 |
Collaborated with BMW to integrate AR and VR technologies into smart vehicle environments, enabling immersive in-car experiences, such as virtual displays, interactive entertainment, and hands-free communication | Enhanced passenger experience | Enabled next-generation in-car interfaces | Improved engagement | Supported development of smart mobility ecosystems |
 |
Delivered high-fidelity VR/XR headsets for astronaut and pilot training, enabling realistic simulation of mission scenarios, cockpit procedures, and emergency situations in fully immersive virtual environments | Improved training realism and precision | Reduced reliance on physical simulators | Enhanced preparedness for complex missions | Lowered training costs and risks |
Logos and trademarks shown above are the property of their respective owners. Their use here is for informational and illustrative purposes only.
Related Ecosystem
Aviation
- Narrow Body Aircraft
- Wide Body Aircraft
- Military Helicopters
- Special Mission Aircraft
- Fighter Aircraft
- HONEYWELL INTERNATIONAL INC.
- COLLINS AEROSPACE
- Thales group
- Safran group
- HEICO Corporation
Simulation And Training
- Sensors
- Augmented Reality
- Augmented Reality Devices
- Virtual Reality
- Virtual Reality Devices
- MICROSOFT CORPORATION
- Lenovo
- MAGIC LEAP INC
- EON REALITY
Automotive Electronics And Electrical Equipment
- Battery Electric Vehicle (BEV)
- Light Commercial Vehicles (LCVs)
- Fuel Cell Electric Vehicle (FCEV)
- Sensors
- Hybrid Electric Vehicle (HEV)
- BOSCH LIMITED
- Continental ag
- DENSO Corporation
- Texas Instruments Incorporated
- Panasonic Holdings Corporation
Key Takeaways
- Rest Of Asia Pacific's AR/VR market is projected to more than double from $1,202.1M (2026) to $2,752.2M (2031), driven by enterprise adoption and consumer demand.
- The region's 14.8% CAGR reflects strong momentum in digital transformation and immersive technology investments across manufacturing, retail, and entertainment.
- Rest Of Asia Pacific is emerging as a critical hub for AR/VR hardware manufacturing and content development, attracting global technology vendors.
- 5G infrastructure expansion and improving digital ecosystems in Rest Of Asia Pacific are accelerating AR/VR deployment across diverse industry verticals.
Augmented and Virtual Reality Market Report Scope
| Report Metric | Details |
|---|---|
| Base Year | 2026 |
| Fastest Growing Segment | HEAD-MOUNTED DISPLAYS (Device Type) |
| Forecast Period | 2026–2031 |
| Growth Rate | CAGR of 18.4% from 2026 to 2031 |
| Largest Segment | SOFTWARE (Offering) |
| Market Size Base Year (Billions) | ~USD 97.49 (2026) |
| Revenue Forecast (Billions) | ~USD 226.84 (2031) |
| Segments Covered | Technology, Offering, Component, Application, Deployment Type, Device Type |
Australia Augmented and Virtual Reality Market Report Segmentation
6 segment dimensions are covered across the global market.
By Technology
- Anchor-Based
- Marker-Based
- Markerless
- Non-Immersive
- Semi & Fully Immersive
By Offering
- Hardware
- Software
By Component
- Cameras
- Displays & Projectors
- Other Hardware Components
- Position/Room Trackers
- Semiconductor Components
- Sensors
By Application
- Aerospace & Defense
- Automotive
- Commercial
- Consumer
- Energy
- Enterprise
- Healthcare
- Other Ar Applications
- Other Vr Applications
By Deployment Type
- Cloud
- On-Premises
By Device Type
- Gesture-Tracking Devices
- Head-Mounted Displays
- Head-Up Displays
- Projectors & Display Walls
Target Audience
- Technology Investors & VCs : Evaluate investment opportunities in Australia's growing AR/VR ecosystem with market sizing, growth projections, and sector-specific insights to identify promising startups and expansion targets.
- Enterprise Technology Leaders : Assess market readiness and adoption trends in Australia to inform digital transformation strategies, vendor selection, and immersive technology implementation roadmaps for competitive advantage.
- AR/VR Solution Providers : Understand Australia's market dynamics, customer segments, and growth drivers to refine product positioning, pricing strategies, and sales approaches for maximum market penetration.
- Management Consultants & Analysts : Access comprehensive Australia market data to support client advisory services, competitive benchmarking, and strategic recommendations in the rapidly evolving AR/VR sector.
- Government & Policy Makers : Utilize market intelligence to inform digital economy policies, innovation funding decisions, and infrastructure investments that support Australia's AR/VR industry growth and competitiveness.
Key Companies in the Australia Augmented and Virtual Reality Market
| Company | HQ | Ownership | Strongest segments |
|---|---|---|---|
| QINETIQ GROUP PLC | United Kingdom | Public Company | HMD and HUD-based immersive training and mission rehearsal,Projector & display wall non-immersive and semi-immersive simulation,Markerless and anchor-based AR for test, evaluation, and maintenance, |
| EPAM SYSTEMS, INC. | United States | Public Company | Non-immersive AR/VR applications,Semi & fully immersive solutions (HMD-centric),Markerless AR, |
| AT&S | Austria | Public Company | HMD manufacturing automation (non-immersive, semi & fully immersive),Gesture tracking and sensor module automation,Projector & display wall / HUD automation, |
| TIANMA MICROELECTRONICS | China | Public Company | HMD Displays (VR/AR headsets and smart glasses),Automotive HUD and Cluster Displays,IT and Monitor Panels for Non-immersive AR/VR, |
| NITTO DENKO CORPORATION | Japan | Public Company | HMD-related optical films, adhesives, and thermal materials,HUD and automotive AR materials,Display wall, projector, and non-immersive AR materials, |
| CORETRONIC CORPORATION | Taiwan | Public Company | Projectors & Display Wall Systems,Backlights, Panel Modules & Intelligent Displays,AR/MR Wearable Display Solutions & Optical Engines, |
| SOPRA STERIA | United States | Public Company | Non-immersive and projector/display wall solutions,Semi & fully immersive (HMD-based) solutions,Markerless and anchor-based AR, |
| VOITH | Germany | Private Company | Non-immersive AR/VR and Projector & Display Wall,Semi & Fully Immersive VR (training and simulation),Markerless and Anchor-Based AR (maintenance and field support), |
| META PLATFORMS, INC. | United States | Public Company | HMD – VR (Meta Quest family, semi & fully immersive),AR & AI Glasses (Ray-Ban Meta, Oakley Meta, Meta Ray-Ban Display),Content, Apps & Services (VR software, social, fitness, entertainment), |
| META | United States | Public Company | HMD (VR headsets, including Meta Quest),AI Glasses and Wearables (Ray-Ban Meta, Oakley Meta, Meta Ray-Ban Display, Meta Neural Band),Software, Content, and Platforms (non-immersive, semi & fully immersive, AR modalities), |
| XIAOMI | China | Public Company | Non-immersive AR (smartphones, TVs, tablets),Semi & fully immersive HMD (consumer VR),Wearables & gesture-tracking devices, |
| SONY CORPORATION | Japan | Public Company | HMD (VR/AR headsets),HUD,Gesture Tracking Devices & Sensors, |
| APPLE INC. | United States | Public Company | Mobile AR (iPhone/iPad + ARKit apps),Vision Pro and future HMDs,Wearables and accessories (Watch, AirPods, others in AR stack), |
| HTC CORPORATION | Thailand | Public Company | HMD (VR/AR headsets),HUD,Gesture Tracking Device, |
| United States | Public Company | Non-immersive and mobile AR (Search, Maps, Lens, YouTube, Android),HMD, HUD, and immersive platforms (Android XR, YouTube VR, partner devices),Markerless and anchor-based AR SDKs and cloud services, | |
| MICROSOFT | United States | Public Company | HMD (HoloLens and compatible headsets),Non-immersive and semi-immersive AR (Windows, Teams, Xbox),Markerless and anchor-based AR services on Azure, |
| SAMSUNG | South Korea | Public Company | Non-immersive & Semi-immersive (smartphones, tablets, monitors, signage),Components for HMD/HUD (displays, memory, sensors),Wearables & Gesture/Tracking-capable Devices, |
| PTC | United States | Public Company | Markerless AR (including model targets and spatial tracking),Anchor-Based AR (IoT/PLM-linked experiences),Marker-Based AR, |
| SEIKO EPSON CORPORATION | Japan | Public Company | Projector & Display Wall (non-immersive and semi-immersive),Smart Glasses / HMD (assisted and semi-immersive AR),Components & Enabling Tech for AR/VR (optical engines, LSIs, sensors), |
| LENOVO | China | Public Company | Non-immersive & Semi-immersive (PCs, tablets, signage controllers),HMD / VR-ready compute bundles,Projector & Display Wall controllers, |
QINETIQ GROUP PLC
QinetiQ Group PLC is a United Kingdom-based public company founded in 2001 with 7,378 employees.
EPAM SYSTEMS, INC.
EPAM Systems, Inc. is a United States-based public company founded in 1993 that employs 62,850 people.
AT&S
AT&S is an Austrian public company founded in 1978 with 7,000 employees.
TIANMA MICROELECTRONICS
Tianma Microelectronics is a Chinese public company founded in 1983 with 23,538 employees.
NITTO DENKO CORPORATION
Nitto Denko Corporation is a Japanese public company founded in 1918 that employs 26,477 people.
CORETRONIC CORPORATION
Coretronic Corporation is a Taiwanese public company founded in 1992.
SOPRA STERIA
Sopra Steria is a United States-based public company founded in 1968 with 51,275 employees.
VOITH
Voith is a German private company founded in 1867 with 23,224 employees.
META PLATFORMS, INC.
Meta Platforms, Inc. is a United States-based public company founded in 2004 that employs 77,986 people.
META
Meta is a United States-based public company founded in 2004 that employs 77,986 people.
XIAOMI
Xiaomi is a Chinese public company founded in 2010 with 55,994 employees.
SONY CORPORATION
Sony Corporation is a Japanese public company founded in 1946 that employs 94,900 people.
APPLE INC.
Apple Inc. is a United States-based public company founded in 1976 with 166,000 employees.
HTC CORPORATION
HTC Corporation is a Thailand-based public company founded in 1969 with 1,543 employees.
Google is a United States-based public company founded in 1998 with 194,668 employees.
MICROSOFT
Microsoft is a United States-based public company founded in 1975 with 228,000 employees.
SAMSUNG
Samsung is a South Korean public company founded in 1969 with 128,735 employees.
PTC
PTC is a United States-based public company founded in 1985 with 7,000 employees.
SEIKO EPSON CORPORATION
Seiko Epson Corporation is a Japanese public company founded in 1942 with 74,619 employees.
LENOVO
Lenovo is a Chinese public company founded in 1984.
Reasons to Buy this Report
- Market-Specific Sizing & Forecasts : Access precise market valuations for Australia ($1,202.1M in 2026, $2,752.2M in 2031) with detailed CAGR analysis to support investment decisions and business planning in the region.
- Competitive Positioning Intelligence : Understand how Australia's 14.8% CAGR compares to global 18.4% growth, identifying market maturity levels and competitive opportunities specific to the Australian landscape.
- Sector-Specific Opportunity Analysis : Identify high-growth verticals within Australia's AR/VR ecosystem including manufacturing, healthcare, retail, and education with tailored market insights for targeted expansion.
- Regional Investment Strategy : Develop Australia-focused go-to-market strategies with data-driven insights on enterprise adoption rates, consumer trends, and infrastructure readiness across the country.
- Risk & Growth Mitigation : Leverage Australia-specific market analysis to assess competitive threats, regulatory factors, and emerging opportunities to optimize resource allocation and minimize market entry risks.
Frequently asked questions
What is the market size of AR/VR in Rest Of Asia Pacific in 2026?
Rest Of Asia Pacific's Augmented and Virtual Reality market was valued at $1,202.1 million in 2026.
What is the projected market size for Rest Of Asia Pacific by 2031?
Rest Of Asia Pacific's AR/VR market is forecast to reach $2,752.2 million by 2031.
What is the CAGR for Rest Of Asia Pacific's AR/VR market?
Rest Of Asia Pacific's AR/VR market is expected to grow at a compound annual growth rate of 14.8% from 2026 to 2031.
Which industries are driving AR/VR adoption in Rest Of Asia Pacific?
Rest Of Asia Pacific's AR/VR growth is primarily driven by manufacturing, retail, entertainment, and enterprise training sectors.
What factors are supporting AR/VR market expansion in Rest Of Asia Pacific?
Rest Of Asia Pacific's market expansion is supported by 5G infrastructure development, competitive hardware pricing, young demographics, government support, and growing developer ecosystems.
RESEARCH METHODOLOGY
The study involved major activities in estimating the current size of the augmented and virtual reality market. Exhaustive secondary research was done to collect information on the market. The next step was to validate these findings and assumptions and validate them with industry experts across the supply chain through primary research. Different approaches, including top-down and bottom-up methods, were employed to estimate the total market size. Following this, the market breakup and data triangulation procedures were employed to determine the market size of the segments and subsegments within the augmented and virtual reality market.
Secondary Research
Secondary research for this study involved gathering information from various credible sources, such as company reports, white papers, journals, and industry publications. This process helps in understanding the supply and value chains, identifying key players, analyzing market segmentation and regional trends, and tracking major market and technology developments. The data collected was used to estimate the overall market size, which was later validated through primary research.
Primary Research
Extensive primary research was conducted after gaining knowledge about the current scenario of the augmented and virtual reality market through secondary research. Several primary interviews were conducted with experts from the demand and supply sides across three major regions—North America, Asia Pacific, Europe, South America, and the Middle East & Africa. This primary data was collected through questionnaires, emails, and telephonic interviews.
Breakdown of Primary Interviews
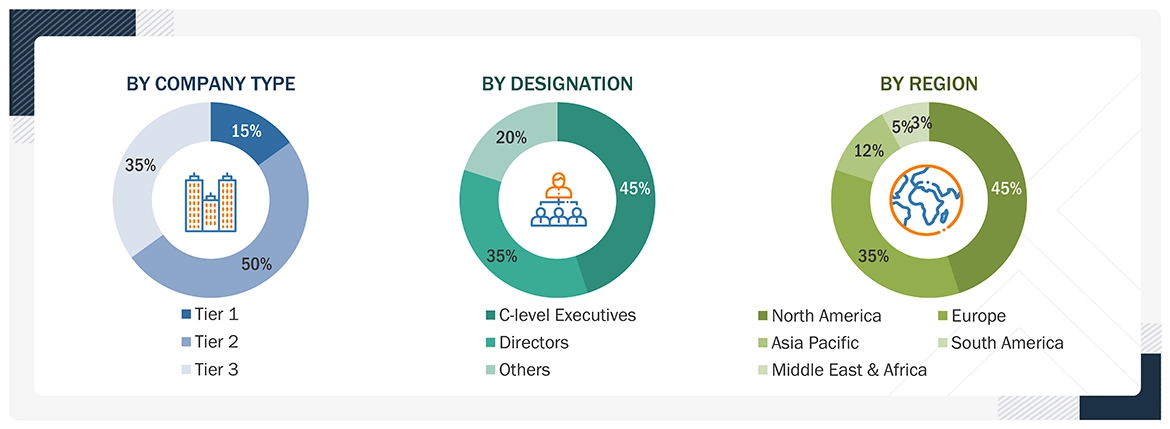
Notes: Other designations include product managers, sales managers, and marketing managers.
Tier 1 companies include market players with revenues above USD 500 million; tier 2 companies earn revenues between USD 100 million and USD 500 million; and tier 3 companies earn up to USD 100 million.
Note: Tier 1 companies receive revenues higher than USD 10 billion; Tier 2 companies' revenues range between USD 1 and 10 billion; and Tier 3 companies' revenues range between USD 500 million and USD 1 billion. Other designations include sales, marketing, and product managers.
To know about the assumptions considered for the study, download the pdf brochure
Market Size Estimation
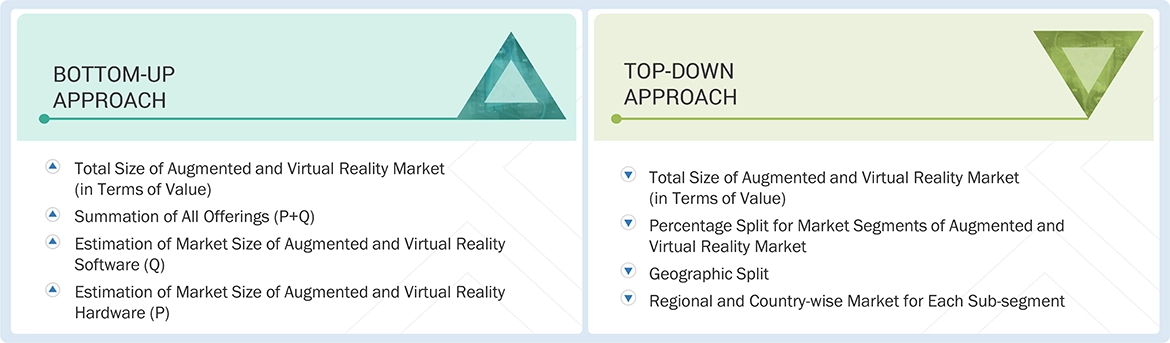
A bottom-up approach has been used to determine the overall size of the augmented and virtual reality market.
- Identifying the total number of augmented and virtual reality head-mounted displays shipped globally
- Understanding the average selling price (ASP) of augmented and virtual reality head-mounted displays
- Deriving the revenue of the augmented and virtual reality head-mounted displays market by multiplying shipments and ASP
- Estimating the market size of other augmented and virtual reality device types by understanding their penetration in the market
- Deriving the market size of the augmented and virtual reality hardware market by the summation of device types
- Estimating the revenue of the augmented and virtual reality software market by understanding the penetration in the hardware market and the global augmented and virtual reality market
- Deriving the global augmented and virtual reality market size by the summation of software and hardware revenue
- Identifying the upcoming products related to augmented and virtual reality by various companies in different regions, and forecasting the market size based on these developments and other key parameters
The top-down approach has been used to estimate and validate the total size of the augmented and virtual reality market.
- Focusing on top-line investments and expenditures made in the ecosystems of various applications
- Calculating the market size, considering revenues from major players through the cost of augmented and virtual reality systems
- Estimating the percentage split of each offering and device type by application and deriving the global application market size
- Segmenting each application of the augmented and virtual reality system by region and deriving the global regional market size
- Estimating country-level market size by analyzing the percentage split for each region by country
- Analyzing information related to revenues generated by players through their crucial product offerings
- Conducting multiple on-field discussions with key opinion leaders involved in developing various augmented and virtual reality solutions
INFOGRAPHIC DEPICTING BOTTOM-UP AND TOP-DOWN APPROACHES
Data Triangulation
After arriving at the overall market size using the market size estimation processes as explained above, the market has been split into several segments and subsegments. Data triangulation and market breakdown procedures have been employed to complete the entire market engineering process and arrive at the exact statistics of each market segment and subsegment. The data has been triangulated by studying various factors and trends from the demand and supply sides in the augmented and virtual reality market.
Market Definition
The augmented and virtual reality market encompasses technologies that create immersive digital experiences by either overlaying virtual elements onto the real world (AR) or generating fully simulated environments (VR). It spans hardware and software across industries such as consumer, commercial, enterprise, healthcare, and automotive. The market is driven by the rising demand for immersive user experiences, advancements in display and processing technologies, and growing enterprise adoption for training and simulation.
Key Stakeholders
- Raw material and manufacturing equipment suppliers
- Semiconductor foundries
- Original equipment manufacturers (OEMs)
- Augmented and virtual reality device manufacturers
- Original design manufacturers (ODMs) and OEM technology solution providers
- Software and technology providers
- Standardization and testing firms
- Government bodies, such as regulatory authorities and policymakers
- Research institutes and organizations
- Market research and consulting firms
- Technology investors
Report Objectives
- To define, analyze, and forecast the augmented and virtual reality market, by technology, offering, device type, and application, in terms of value
- To define, analyze, and forecast the augmented and virtual reality market, by device type, in terms of volume
- To forecast the market size for various segments with respect to five main regions, namely North America, Europe, Asia Pacific, South America, and the Middle East & Africa, in terms of value
- To provide detailed information regarding the major drivers, restraints, opportunities, and challenges influencing the growth of the augmented and virtual reality market
- To study the complete value chain and related industry segments for the augmented and virtual reality market
- To strategically analyze the micromarkets with respect to individual growth trends, prospects, and contributions to the total market
- To analyze the value chain; market ecosystem, trends/disruptions impacting customer business, technology analysis, pricing analysis, Porter’s five forces analysis, key stakeholders and buying criteria, the impact of Gen AI/AI, case study analysis, the impact of 2025 US tariff, trade analysis, patent analysis, key conferences and events, regulations, macroeconomic outlook analysis, and investment and funding scenario
- To analyze opportunities in the market for various stakeholders by identifying the high-growth segments of the market
- To strategically profile key players and comprehensively analyze their market position in terms of ranking, core competencies, company valuation and financial metrics, and product/brand comparison, along with detailing the competitive landscape for the market leaders
- To analyze competitive developments, such as product launches/developments, partnerships, collaborations, acquisitions, joint investments, agreements, contracts, expansions, and research & development (R&D) activities, carried out by players in the augmented and virtual reality market
Available customizations:
With the given market data, MarketsandMarkets offers customizations according to the company‘s specific needs. The following customization options are available for the report.
Company Information:
- Detailed analysis and profiling of additional market players (up to five)
Get the Full Augmented and Virtual Reality Market Report
Full forecast, segment splits, and company analysis for all Augmented and Virtual Reality Market.
- US Augmented and Virtual Reality Market
- Canada Augmented and Virtual Reality Market
- Mexico Augmented and Virtual Reality Market
- UK Augmented and Virtual Reality Market
- Germany Augmented and Virtual Reality Market
- France Augmented and Virtual Reality Market
- Spain Augmented and Virtual Reality Market
- Italy Augmented and Virtual Reality Market
- Nordic Countries Augmented and Virtual Reality Market
- Rest Of Europe Augmented and Virtual Reality Market
- China Augmented and Virtual Reality Market
- Japan Augmented and Virtual Reality Market
- India Augmented and Virtual Reality Market
- South Korea Augmented and Virtual Reality Market
- Rest Of Asia Pacific Augmented and Virtual Reality Market
- GCC Countries Augmented and Virtual Reality Market
- South Africa Augmented and Virtual Reality Market
- Brazil Augmented and Virtual Reality Market
- Argentina Augmented and Virtual Reality Market
- Rest Of South America Augmented and Virtual Reality Market
Need a Tailored Report?
Customize this report to your needs
Get 10% FREE Customization
Customize This Report
