
China Display Market (2026-2031)

The China Display Market was valued at $385.3 Million in 2026 and projected to reach to $386.5 Million by 2031, representing a compound annual growth rate of 0.1%. China's display market faces a challenging outlook characterized by minimal expansion through 2031.


| Market Size in | USD 26.32 MN |
| Market Forecast in | |
| CAGR | |
| Forecast Period | |
| Units Considered | Value (USD MN) |
China Display Market Trends and Insights
- This stagnant trajectory reflects South Africa's mature display sector, where market saturation and limited new technology adoption constrain expansion.
- South Africa's display market remains heavily dependent on replacement demand and incremental upgrades rather than transformative growth drivers. The near-flat growth profile of South Africa's display market contrasts sharply with global expansion, where the sector is expected to grow at 3.9% CAGR over the same period.
- South Africa faces structural headwinds including economic constraints, limited manufacturing capacity, and competition from imported displays.
- Despite these challenges, South Africa maintains a stable installed base of display technologies across consumer electronics, commercial signage, and industrial applications, ensuring baseline market continuity through 2031..
Key Market Statistics
- CAGR (2026-2031) 0.1% CAGR
- Market Size, 2026 ~USD 385.3 Million
- Forecast, 2031 ~USD 386.5 Million
- Country China
China Display Market Overview
Minimal Growth Trajectory :
China's display market shows stagnant growth with a CAGR of just 0.1%, valued at $385.3 million in 2026 and projected to reach $386.5 million by 2031, indicating market maturation and saturation.
Market Saturation Challenges :
China's display sector faces significant headwinds from market saturation, with limited adoption of emerging display technologies constraining expansion opportunities and innovation-driven growth.
Lagging Global Performance :
China's 0.1% CAGR significantly underperforms the global display market CAGR of 3.9%, highlighting regional underperformance and competitive disadvantages in technology adoption and market development.
Mature Sector Dynamics :
The Chinese display market operates as a mature, consolidated sector with limited new entrants and incremental growth, reflecting established competitive structures and reduced investment in disruptive technologies.
China Display Market Dynamics
- The 0.1% CAGR reflects a mature market with limited growth catalysts, as saturation in traditional display segments and slow technology adoption rates constrain revenue expansion.
- Market consolidation and competitive pressures further limit opportunities for significant growth. Future growth in China's display market will depend on breakthrough innovations in emerging display technologies such as microLED, flexible displays, and advanced OLED applications.
- Strategic investments in R&D and targeted expansion into niche segments may provide modest growth opportunities, though the overall market trajectory suggests continued stagnation without significant technological disruption or demand stimulation..
Market Ecosystem
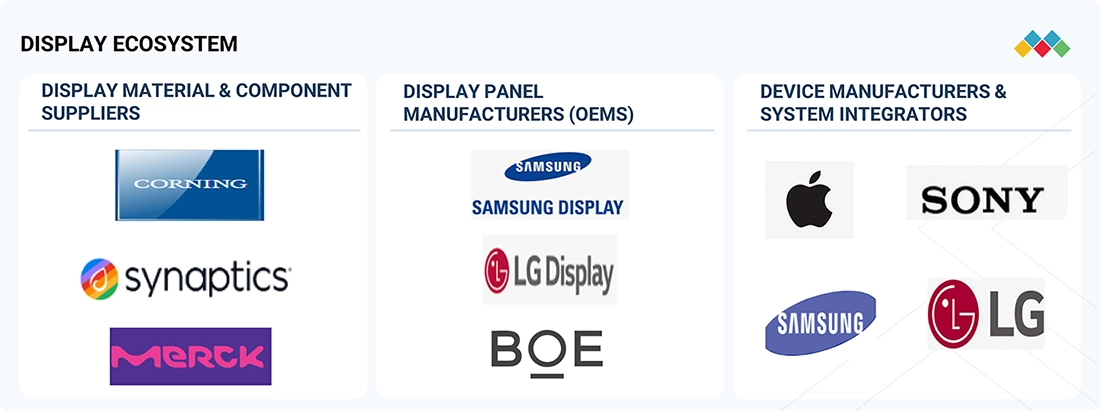
DISPLAY MARKET SIZE, SHARE & GROWTH ANALYSIS: COMMERCIAL USE CASES ACROSS INDUSTRIES
| COMPANY | USE CASE DESCRIPTION | BENEFITS |
|---|---|---|
 |
Samsung Display continues to expand its OLED portfolio for smartphones, IT devices, automotive displays, and emerging XR applications through innovations in foldable, flexible, and high-resolution display technologies. | Enhanced display quality and color accuracy | Reduced power consumption | Enabled foldable and flexible form factors | Strengthened premium device differentiation |
 |
BOE is investing heavily in OLED, Mini-LED, and flexible display technologies while expanding production capacity to address growing demand from consumer electronics and automotive applications. | Increased production scalability | Broader customer reach | Enhanced display performance | Improved competitiveness in premium display segments |
 |
LG Display is advancing OLED and large-format display technologies for TVs, automotive applications, and commercial displays, focusing on improved brightness, durability, and energy efficiency. | Superior viewing experience | Improved energy efficiency | Expanded adoption of OLED technology | Enhanced automotive and premium TV offerings |
Logos and trademarks shown above are the property of their respective owners. Their use here is for informational and illustrative purposes only.
Related Ecosystem
Aviation
- Narrow Body Aircraft
- Wide Body Aircraft
- Military Helicopters
- Special Mission Aircraft
- Fighter Aircraft
- HONEYWELL INTERNATIONAL INC.
- COLLINS AEROSPACE
- Thales group
- Safran group
- HEICO Corporation
Automotive Advance Technologies
- Battery Electric Vehicle (BEV)
- Light Commercial Vehicles (LCVs)
- Fuel Cell Electric Vehicle (FCEV)
- Hybrid Electric Vehicle (HEV)
- Internal Combustion Engine (ICE)
- BOSCH LIMITED
- Continental ag
- Visteon Corporation
- DENSO Corporation
- ZF FRIEDRICHSHAFEN AG
Display Technology
- Liquid Crystal Display (LCD)
- Sensors
- Virtual Reality Devices
- Augmented Reality
- Digital Light Processing (DLP)
- VIVITEK CORPORATION
- Samsung
- Lenovo
- Panasonic Holdings Corporation
- Lg corp
Key Takeaways
- South Africa's display market will grow at only 0.1% CAGR from 2026 to 2031, adding just $1.2 million in market value.
- South Africa's market maturity and saturation limit expansion compared to the global display market's 3.9% CAGR.
- South Africa's display sector is driven primarily by replacement cycles and maintenance rather than new technology adoption.
- South Africa's economic constraints and import competition create structural barriers to accelerated market growth through 2031.
Display Market Report Scope
| Report Metric | Details |
|---|---|
| Base Year | 2026 |
| Fastest Growing Segment | MICRO-LED (Vertical) |
| Forecast Period | 2026–2031 |
| Growth Rate | CAGR of 3.9% from 2026 to 2031 |
| Largest Segment | SMALL & MEDIUM-SIZED PANELS (Panel Size) |
| Market Size Base Year (Billions) | ~USD 109.56 (2026) |
| Revenue Forecast (Billions) | ~USD 132.66 (2031) |
| Segments Covered | Display Technology, Panel Size, Product Type, Wearable Type, Vertical |
China Display Market Report Segmentation
5 segment dimensions are covered across the global market.
By Display Technology
- Direct-View Led
- Lcd
- Micro-Led
- Oled
- Other Display Technologies
- Quantum Dot
- Quantum Dot Display
- Quantum Dot Displays
By Panel Size
- Large Panels
- Microdisplays
- Small & Medium-Sized Panels
- Small And Medium-Sized Panels
By Product Type
- Automotive Displays
- Digital Signage & Large Format Display
- Digital Signage & Large Format Displays
- Monitors & Laptops
- Other Product Types
- Smartphones
- Tablets
- Television Sets
- Wearables
By Wearable Type
- Ar Hmd
- Smartwatch
- Vr Hmd
By Vertical
- Aerospace & Defense
- Automotive
- Consumer Electronics
- Education
- Healthcare
- Industrial & Enterprise
- Other Verticals
- Retail, Hospitality & Bfsi
- Retail, Hospitality, & Bfsi
- Sports & Entertainment
- Transportation
Target Audience
- Display Manufacturers : Manufacturers need China-specific market data to assess growth potential, identify saturation points, and develop localized product strategies for the stagnant but significant $385M+ market.
- Investment & Private Equity Firms : Investors require detailed China market forecasts to evaluate acquisition targets, assess portfolio company performance, and identify undervalued opportunities in the mature display sector.
- Technology & Innovation Leaders : R&D executives need insights into China's technology adoption barriers and market gaps to prioritize innovation investments and develop breakthrough solutions addressing local market needs.
- Strategic Business Consultants : Consultants advising clients on China expansion require accurate market data, growth forecasts, and competitive analysis to develop credible business cases and strategic recommendations.
- Supply Chain & Distribution Partners : Distributors and supply chain managers need China market intelligence to optimize inventory, forecast demand, and align distribution strategies with minimal-growth market conditions.
Key Companies in the China Display Market
| Company | HQ | Ownership | Strongest segments |
|---|---|---|---|
| ASUSTEK COMPUTER INC | Taiwan | Public Company | Laptops and PCs (notebooks, AIOs, towers, mini-PCs, NUCs),Components (motherboards, graphics cards, cases, cooling, PSUs, storage),Networking/IoT/Servers and AloT/Industrial solutions, |
| HOYA CORPORATION | Japan | Public Company | Eyeglasses and ophthalmic lenses,Contact lenses and Eyecity retail,Medical endoscopes and laparoscopic instruments, |
| CORNING, INC. | United States | Public Company | Optical Communications (fiber, cable, hardware, connectivity),Display Technologies (LCD/OLED glass substrates),Specialty Materials (mobile, semiconductor optics, defense, sunglasses, shielding), |
| KLA-TENCOR CORPORATION | United States | Public Company | Semiconductor Process Control,Specialty Semiconductor Process,PCB and Component Inspection, |
| LATTICE SEMICONDUCTOR | United States | Public Company | Small FPGA platforms (Nexus, Nexus 2, MachXO, iCE, Certus families),Mid-range FPGA (Lattice Avant, Avant-G, Avant-E, Avant-X, CertusPro, Certus-N2),Specialized FPGAs for vision, connectivity, and control (CrossLink, CrossLinkPlus, SCP), |
| LENOVO | China | Public Company | Small form factor PCs & embedded signage controllers,Thin clients and dedicated media players,Tablets and smart devices for kiosks/POS displays, |
| GODREJ GROUP | India | Private Company | Home appliances (refrigerators, washing machines, ACs, microwaves, coolers),Commercial appliances (medical refrigerators, deep freezers, vending, institutional cooling),Locks, architectural hardware, security products, and kitchen fittings, |
| KUDELSKI GROUP | Switzerland | Public Company | Core Digital Security (conditional access, middleware, digital TV, watermarking, smartcards),Cybersecurity (advisory, technology resale, managed security services),Internet of Things (IoT security, device lifecycle services), |
| TEXAS INSTRUMENTS INC | United States | Public Company | Analog – Power Management,Analog – Signal Chain,Embedded Processing (MCUs, processors, connectivity, radar), |
| NITTO DENKO CORPORATION | Japan | Public Company | Adhesive tapes & surface protective films,Electronics & semiconductor process materials,Fluoroplastic sheets, porous films, and functional membranes, |
| VALENS | Israel | Public Company | Cross Industry / Pro-AV (HDBaseT chipsets and related VS-series),Automotive (MIPI A-PHY and VA-series), |
| SAMSUNG DISPLAY | South Korea | Private Company | Smartphone OLED/AMOLED,TV and Large-format Displays (LCD and OLED),IT Displays (Tablets, Notebooks, Monitors), |
| LG DISPLAY CO., LTD. | South Korea | Public Company | TV panels (OLED + LCD),IT displays (notebooks, desktop monitors, tablets),Mobile and wearable displays, |
| SHARP CORPORATION | Japan | Public Company | Smart Life & Energy (appliances, air, solar, storage, masks),Smart Office (MFPs, displays, POS, PCs, solutions),Universal Network (TVs, AV, mobile, tablets, routers, automotive wireless), |
| BOE TECHNOLOGY GROUP CO., LTD. | China | Public Company | Display Business (TFT-LCD, AMOLED, micro displays, intelligent interface devices),IoT Innovation (smart terminals and IoT solutions),Sensor Business, |
| INNOLUX CORPORATION | Taiwan | Public Company | LCD TV panels,Monitor and commercial display panels,Notebook and tablet panels, |
| AUO CORPORATION | Taiwan | Public Company | TV and IT TFT-LCD panels and modules,Industrial, automotive, and medical displays and HMI systems,Solar modules, renewable energy generation, and EPC services, |
| SONY GROUP CORPORATION | Japan | Public Company | Game & Network Services,Music,Pictures, |
| QISDA CORPORATION | Taiwan | Public Company | Design and Manufacturing Services (DMS),Brand Marketing (IT products and IA solutions),Medical Services, |
| LEYARD | China | Public Company | Micro and small pitch LED / intelligent display,Cultural tourism, night-time entertainment, and landmark projects,AI and spatial computing / XR and virtual production, |
| E INK HOLDINGS INC. | Taiwan | Public Company | eReaders and eNotes high-resolution modules,Electronic shelf labels (ESL),Industrial, logistics, and smart tags, |
| TIANMA MICROELECTRONICS CO., LTD. | China | Public Company | Automotive displays (cluster, HUD, center stack, cockpit, rear-seat),Smart mobile displays (smartphones and wearables),IT displays (tablet, monitor, ultrabook), |
| UNIVERSAL DISPLAY | United States | Public Company | PHOLED materials and related licensing,Technology licensing and IP monetization (non-material),FOLED and OVJP-related development and services, |
| TRULY INTERNATIONAL HOLDINGS LIMITED | Hong Kong | Public Company | LCD and touch panel modules,Compact camera modules,Personal health care devices, |
| PANASONIC HOLDINGS CORPORATION | Japan | Public Company | HVAC & Cold Chain (air-conditioners, heat pump water heaters, ventilation, showcases, commercial refrigerators),Energy (cylindrical in-vehicle batteries, other batteries, storage systems),Electric Works & Housing (lighting, wiring devices, solar PV, fuel cells, kitchen/bath, interior/exterior materials), |
ASUSTEK COMPUTER INC
ASUSTeK Computer Inc. is a public company founded in 1989 and headquartered in Taiwan, operating in the computer hardware industry.
HOYA CORPORATION
Hoya Corporation is a Japanese public company founded in 1941 with 37,752 employees, operating across multiple business segments.
CORNING, INC.
Corning, Inc. is a United States-based public company founded in 1851 with 67,200 employees, specializing in materials science and glass technology.
KLA-TENCOR CORPORATION
KLA-Tencor Corporation is a United States public company founded in 1975 with 15,100 employees, serving the semiconductor and related industries.
LATTICE SEMICONDUCTOR
Lattice Semiconductor is a United States public company founded in 1983 with 1,174 employees, specializing in semiconductor solutions.
LENOVO
Lenovo is a Chinese public company founded in 1984, operating as a major global technology and computing hardware manufacturer.
GODREJ GROUP
Godrej Group is an Indian private company founded in 1897 with 13,316 employees, operating across consumer goods, real estate, and industrial sectors.
KUDELSKI GROUP
Kudelski Group is a Swiss public company founded in 1951 with 110 employees, specializing in digital security and content protection solutions.
TEXAS INSTRUMENTS INC
Texas Instruments Inc. is a United States public company founded in 1930 with 33,000 employees, a leading manufacturer of semiconductors and analog technology.
NITTO DENKO CORPORATION
Nitto Denko Corporation is a Japanese public company founded in 1918 with 26,477 employees, producing specialty materials and chemical products.
VALENS
Valens is an Israeli public company founded in 2006 with 233 employees, specializing in semiconductor connectivity solutions.
SAMSUNG DISPLAY
Samsung Display is a South Korean private company founded in 2012 with 24,718 employees, specializing in display panel manufacturing.
LG DISPLAY CO., LTD.
LG Display Co., Ltd. is a South Korean public company founded in 1985 with 25,057 employees, a major manufacturer of display panels and screens.
SHARP CORPORATION
Sharp Corporation is a Japanese public company founded in 1912 with 34,549 employees, operating in electronics and display technology.
BOE TECHNOLOGY GROUP CO., LTD.
BOE Technology Group Co., Ltd. is a Chinese public company founded in 1993 with 109,895 employees, a leading manufacturer of display panels and semiconductor devices.
INNOLUX CORPORATION
Innolux Corporation is a Taiwanese public company founded in 2003 with 44,813 employees, specializing in display panel manufacturing.
AUO CORPORATION
AU Optronics Corporation is a Taiwanese public company founded in 1996 with 43,000 employees, a major producer of display panels and related technologies.
SONY GROUP CORPORATION
Sony Group Corporation is a Japanese public company founded in 1946 with 94,900 employees, operating across electronics, entertainment, and financial services.
QISDA CORPORATION
Qisda Corporation is a Taiwanese public company founded in 1984 with 14,375 employees, engaged in electronics manufacturing and display technology.
LEYARD
Leyard is a Chinese public company founded in 1995 with 4,405 employees, specializing in LED display and digital signage solutions.
E INK HOLDINGS INC.
E Ink Holdings Inc. is a Taiwanese public company founded in 1992 with 777 employees, a pioneer in electronic paper display technology.
TIANMA MICROELECTRONICS CO., LTD.
Tianma Microelectronics Co., Ltd. is a Chinese public company founded in 1983 with 23,538 employees, specializing in display panel manufacturing.
UNIVERSAL DISPLAY
Universal Display is a United States public company founded in 1985 with 469 employees, specializing in organic light-emitting diode (OLED) technology.
TRULY INTERNATIONAL HOLDINGS LIMITED
Truly International Holdings Limited is a Hong Kong public company founded in 1978 with 13,440 employees, engaged in display panel and electronics manufacturing.
PANASONIC HOLDINGS CORPORATION
Panasonic Holdings Corporation is a Japanese public company founded in 1918 with 183,685 employees, operating across consumer electronics, industrial solutions, and energy sectors.
Reasons to Buy this Report
- Accurate Market Sizing : Obtain precise valuation data for China's display market with verified figures for 2026 ($385.3M) and 2031 ($386.5M), enabling accurate financial planning and investment decisions.
- Competitive Intelligence : Understand China's underperformance versus global markets (0.1% vs 3.9% CAGR) to identify competitive gaps, market positioning opportunities, and strategic differentiation strategies.
- Growth Opportunity Identification : Identify niche segments and emerging technologies within China's mature display market where innovation and targeted investments can unlock incremental growth and market share gains.
- Risk Assessment & Mitigation : Evaluate market saturation risks and stagnation factors specific to China's display sector to develop robust contingency strategies and minimize investment exposure.
- Strategic Market Entry Planning : Leverage detailed China market insights to inform market entry strategies, partnership development, and resource allocation decisions for display technology companies and investors.
Frequently asked questions
What is the current size of South Africa's display market?
South Africa's display market is valued at $385.3 million in 2026 and is projected to grow modestly to $386.5 million by 2031.
What is the growth rate of South Africa's display market?
South Africa's display market is growing at a compound annual growth rate of 0.1% from 2026 to 2031, indicating near-stagnant market conditions.
How does South Africa's display market compare to global trends?
South Africa's display market growth of 0.1% CAGR significantly lags the global display market's 3.9% CAGR, reflecting regional maturity and saturation.
What factors are limiting growth in South Africa's display market?
South Africa's display market faces headwinds from economic constraints, market saturation, limited manufacturing capacity, and competition from imported displays.
What is driving demand in South Africa's display market?
South Africa's display market is primarily driven by replacement cycles, maintenance demand, and incremental technology upgrades rather than new applications or transformative innovations.
RESEARCH METHODOLOGY
The research process for this technical, market-oriented, and commercial study of the display market included the systematic gathering, recording, and analysis of data about companies operating in the market. It involved the extensive use of secondary sources, directories, and databases (Factiva and Oanda) to identify and collect relevant information. In-depth interviews were conducted with various primary respondents, including experts from core and related industries and preferred manufacturers, to obtain and verify critical qualitative and quantitative information as well as to assess the growth prospects of the market. Key players in the display market were identified through secondary research, and their market rankings were determined through primary and secondary research. This included studying annual reports of top players and interviewing key industry experts, such as CEOs, directors, and marketing executives.
Secondary Research
In the secondary research process, various secondary sources were referred to for identifying and collecting information relevant to this study. Secondary sources include annual reports, press releases, and investor presentations of companies; white papers, certified publications, and articles from recognized authors; directories; and databases. Secondary research has been mainly conducted to obtain key information about the supply chain and value chain of the industry; a total pool of key players; segmentation of the market according to the industry trends, geographic markets, and key developments from market- and technology-oriented perspectives.
Primary Research
In the primary research process, primary sources from the supply and demand sides were interviewed to obtain qualitative and quantitative information for this report. Primary sources from the supply side include experts, such as CEOs, vice presidents, marketing directors, technology and innovation directors, subject-matter experts, consultants, and related key executives from major companies and organizations operating in the display market.
After the complete market engineering process (market statistics calculations, market breakdown, market size estimations, market forecasting, and data triangulation), extensive primary research was conducted to gather information and verify and validate the critical market numbers.
Several primary interviews were conducted with experts from the demand and supply sides across four major regions—North America, Europe, Asia Pacific, and RoW (South America and the Middle East & Africa). This primary data was collected through questionnaires, emails, and telephonic interviews.
BREAKDOWN OF PRIMARY INTERVIEW PARTICIPANTS
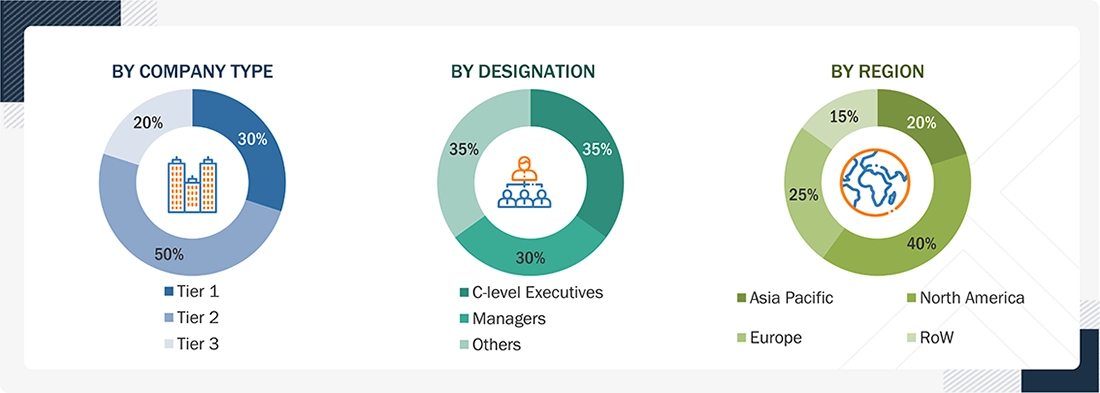
Note: Other designations include product managers, sales managers, and marketing managers.
Three tiers of companies have been defined based on their total revenue as of 2025: tier 3: revenue less than USD 500 million; tier 2: revenue between USD 500 million and USD 1 billion; and tier 1: revenue more than USD 1 billion.
RoW includes South America and the Middle East & Africa.
To know about the assumptions considered for the study, download the pdf brochure
Market Size Estimation
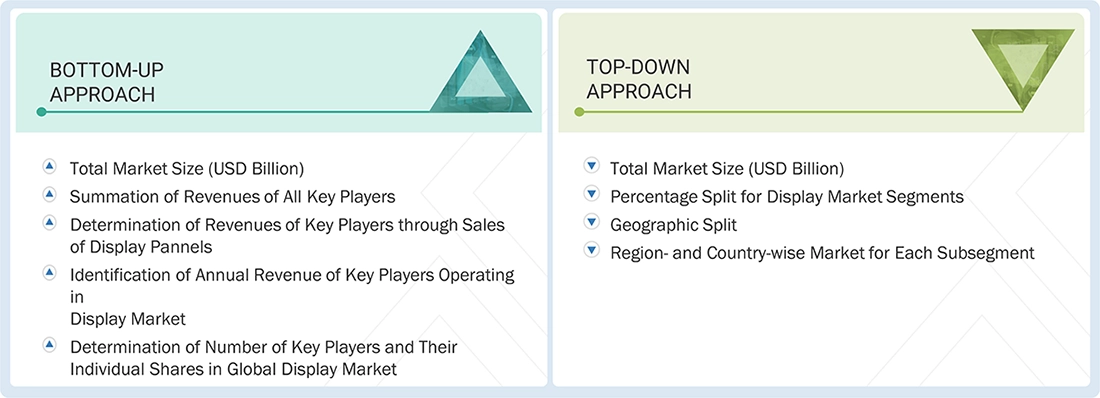
In the complete market engineering process, top-down and bottom-up approaches and several data triangulation methods were used to estimate and forecast the overall market segments and subsegments listed in this report. Key players in the market were identified through secondary research, and their market shares in the respective regions were determined through primary and secondary research. This entire procedure included the study of annual and financial reports of the top market players and extensive interviews for key insights (quantitative and qualitative) with industry experts (CEOs, VPs, directors, and marketing executives).
All percentage shares, splits, and breakdowns were determined using secondary sources and verified through primary sources. All the parameters affecting the markets covered in this research study were accounted for, viewed in detail, verified through primary research, and analyzed to obtain the final quantitative and qualitative data. This data was consolidated and supplemented with detailed inputs and analysis from MarketsandMarkets and presented in this report.
BOTTOM-UP APPROACH
- Companies offering display panels were identified, and their offerings were mapped based on technology and panel size footprint.
- The global display market size was derived through the data sanity method. The revenues of display panel providers were analyzed through annual reports and press releases and summed up to derive the overall market size.
- For each company, a percentage was assigned to the overall revenue to derive the revenues from display panels.
- Each company’s percentage was assigned after analyzing various factors, including its product offerings, geographic presence, R&D expenditures and initiatives, and recent developments/strategies adopted for growth in the display market.
- For the CAGR, the market trend analysis of display panels was carried out by understanding the industry penetration rate and the demand and supply of display panels to different verticals.
- Estimates at every level were verified and cross-checked by discussing them with key opinion leaders, including sales heads, directors, operations managers, and market domain experts of MarketsandMarkets.
- Various paid and unpaid information sources, such as annual reports, press releases, white papers, and databases, were studied.
TOP-DOWN APPROACH
- Focusing initially on the top-line investments and expenditures being made in the ecosystem of displays, further splitting into display technology, panel size, vertical, and product type, and listing key developments in key market areas
- Identifying all major players in the display market and their product portfolio for various verticals through secondary research, as well as verifying with a brief discussion with industry experts
- Analyzing revenues, product mix, geographic presence, and key verticals for which all identified players serve display products/technologies to estimate and arrive at the percentage splits for all key segments
- Discussing these splits with the industry experts to validate the information and identify key growth pockets across all key segments
- Breaking down the total market based on verified splits and key growth pockets across all segments
Display Market : Top-Down and Bottom-Up Approach
Data Triangulation
After arriving at the overall market size, the market was split into several segments and subsegments using the market size estimation processes as explained above. Data triangulation and market breakdown procedures were employed to complete the entire market engineering process and determine each market segment's and subsegment's exact statistics. The data was triangulated by studying various factors and trends from the demand and supply sides in the display market.
Market Definition
The display market comprises technologies, components, and systems used to visualize information, images, videos, and interactive content across a wide range of electronic devices and applications. The market includes display panels and solutions based on LCD, OLED, Mini-LED, Micro-LED, Quantum Dot, and other emerging technologies used in smartphones, televisions, laptops, monitors, tablets, wearables, automotive displays, digital signage, industrial equipment, healthcare devices, and AR/VR systems. Market growth is driven by increasing demand for high-resolution, energy-efficient, and advanced display solutions that enhance user experience, support digital transformation, and enable next-generation applications across consumer, commercial, automotive, and industrial sectors.
Key Stakeholders
- Raw material suppliers
- Original equipment manufacturers (OEMs)
- Technology providers
- Research institutes
- Market research and consulting firms
- Government agencies and financial institutions
- Analysts and strategic business planners
Report Objectives
- To describe and forecast the display market by display technology, panel size, vertical, product type, and region, in terms of value
- To describe and forecast the market for various segments across four main regions, namely, North America, Europe, Asia Pacific, South America, and the Middle East & Africa, in terms of value
- To describe and forecast the global market size, in terms of volume
- To strategically analyze micromarkets1 about individual growth trends, prospects, and their contribution to the market
- To provide detailed information regarding the drivers, restraints, opportunities, and challenges influencing market growth
- To analyze opportunities for stakeholders by identifying high-growth segments in the market
- To provide a detailed overview of the display value chain
- To strategically profile the key players in the automotive sensors market and comprehensively analyze their market shares and core competencies2
- To analyze competitive developments such as partnerships, acquisitions, expansions, collaborations, and product launches, along with R&D activities in the display market
- To provide interconnected markets and cross-sector opportunities, strategic moves by tier 1/2/3 players, ecosystem analysis, case study analysis, patent analysis, technology analysis, impact of AI/Gen AI, key conferences and events, Porter’s five forces analysis, and regulations pertaining to the market under study
Available customizations:
With the given market data, MarketsandMarkets offers customizations according to the company’s specific needs. The following customization options are available for the report:
Company Information
- Detailed analysis and profiling of additional market players (up to five)
Get the Full Display Market Report
Full forecast, segment splits, and company analysis for all Display Market.
- Japan Display Market
- South Korea Display Market
- Taiwan Display Market
- Rest Of Asia Pacific Display Market
- GCC Display Market
- South Africa Display Market
- US Display Market
- Canada Display Market
- Mexico Display Market
- Germany Display Market
- UK Display Market
- France Display Market
- Rest Of Europe Display Market
Need a Tailored Report?
Customize this report to your needs
Get 10% FREE Customization
Customize This Report
