
Rest Of Asia Pacific Non-meat Ingredients Market (2024-2029)

The Rest Of Asia Pacific Non-meat Ingredients Market was valued at $1112.9 Million in 2024 and projected to reach to $1280 Million by 2029, representing a compound annual growth rate of CAGR 2.8%. Rest Of Asia Pacific's non-meat ingredients market is experiencing moderate but stable growth, driven by evolving dietary preferences and increased availability of plant-based products.


| Market Size in | USD 26.32 MN |
| Market Forecast in | |
| CAGR | |
| Forecast Period | |
| Units Considered | Value (USD MN) |
Rest Of Asia Pacific Non-meat Ingredients Market Trends and Insights
- Rest Of Asia Pacific represents a significant but moderately growing segment within the broader Asia Pacific region, driven by increasing consumer demand for plant-based and alternative protein solutions.
- The market in Rest Of Asia Pacific reflects evolving dietary preferences and regulatory support for sustainable food production across emerging and developing economies. Rest Of Asia Pacific's growth trajectory is shaped by rising health consciousness, urbanization, and the adoption of vegetarian and vegan lifestyles among younger demographics.
- Between 2024 and 2029, Rest Of Asia Pacific is expected to see steady expansion as food manufacturers invest in non-meat ingredient innovation and supply chain development.
- The region's market dynamics are influenced by local agricultural capabilities, cost competitiveness, and growing retail distribution of plant-based products, positioning Rest Of Asia Pacific as a key contributor to the global non-meat ingredients sector..
Key Market Statistics
- CAGR (2024-2029) CAGR 2.8%
- Market Size, 2024 ~USD 1112.9 Million
- Forecast, 2029 ~USD 1280 Million
- Country Rest Of Asia Pacific
Rest Of Asia Pacific Non-meat Ingredients Market Overview
Market Valuation :
Rest Of Asia Pacific non-meat ingredients market valued at USD 1,112.9 million in 2024, representing a significant segment within the broader Asia Pacific region with steady growth trajectory.
Growth Projection :
Market expected to reach USD 1,280.0 million by 2029, demonstrating consistent expansion driven by shifting consumer preferences toward plant-based and alternative protein solutions.
Regional CAGR :
Rest Of Asia Pacific expanding at 2.8% CAGR through 2029, slightly below the global average of 4.4%, indicating emerging market maturation and localized growth dynamics.
Consumer Demand Drivers :
Increasing adoption of plant-based alternatives, rising health consciousness, and growing vegetarian/vegan populations across emerging economies in Rest Of Asia Pacific region.
Rest Of Asia Pacific Non-meat Ingredients Market Dynamics
- The region's 2.8% CAGR reflects a maturing market with growing consumer awareness of health and sustainability benefits associated with non-meat alternatives. Key growth opportunities exist in emerging economies within the region where rising disposable incomes and urbanization are expanding the consumer base for premium plant-based ingredients.
- Strategic investments in local production facilities and distribution networks will be critical for market players to capitalize on the projected USD 167.1 million market expansion through 2029..
Market Ecosystem
Related Ecosystem
Fandb Ingredients
- Dairy Products
- Bakery Products
- Microorganism
- Polydextrose
- Carbohydrates
- AZELIS HOLDINGS SA
- Archer-Daniels-Midland Company
- Kerry Group plc
- Amway
- DSM FIRMMENICH
Plant Based Alternatives Ingredients
- Dairy Products
- Bakery Products
- Diaphragm Pumps
- Enzymatic Hydrolysis
- Microorganism
- AZELIS HOLDINGS SA
- Archer-Daniels-Midland Company
- Amway
- CARGILL, INCORPORATED
- GRIFFITH FOODS
Key Takeaways
- Rest Of Asia Pacific's non-meat ingredients market is valued at USD 1,112.9 million in 2024 and will reach USD 1,280.0 million by 2029.
- Rest Of Asia Pacific is experiencing a 2.8% CAGR, reflecting moderate but steady growth compared to global expansion rates.
- Rest Of Asia Pacific's market growth is driven by increasing plant-based adoption, urbanization, and health-conscious consumer behavior.
- Rest Of Asia Pacific benefits from competitive local agricultural production and expanding retail distribution networks for alternative proteins.
Non-meat Ingredients Market Report Scope
| Report Metric | Details |
|---|---|
| Base Year | 2024 |
| Fastest Growing Segment | FILLERS (Ingredient Type) |
| Forecast Period | 2024-2029 |
| Growth Rate | CAGR of 4.4% from 2024 to 2029 |
| Largest Segment | SOLID (Form) |
| Market Size Base Year (Billions) | ~USD 41.2 (2024) |
| Revenue Forecast (Billions) | ~USD 51.1 (2029) |
| Segments Covered | Ingredient Source, Ingredient Type, Application, Type, Form, Fresh Meat Product Type, Processed And Cured Meat Product Type, Ready-To-Eat Meat Product Type, Frozen Meat Product Type, Convenience Food Product Type, Ready-To-Eat Meat Product Type 2019-2023 |
Rest Of Asia Pacific Non-meat Ingredients Market Report Segmentation
11 segment dimensions are covered across the global market.
By Ingredient Source
- Animals
- Chemical Substances
- Plants
By Ingredient Type
- Binders
- Coloring Agents
- Extenders
- Fillers
- Flavoring Agents
- Preservatives
- Salt
- Texturing Agents
By Application
- Convenience Food Products
- Fresh Meat Products
- Frozen Meat Products
- Marinated And Seasoned Meat Products
- Processed And Cured Meat Products
- Ready-To-Eat (Rte) Meat Products
- Ready-To-Eat (Rte) Products
By Type
- Beef
- Burgers
- Cured Bacon
- Deli Meats
- Frozen Meat Patties
- Frozen Meat-Based Appetizers
- Frozen Meat-Based Meals
- Frozen Meatballs
- Hot Dogs
- Jerky
- Meat Snacks
- Mutton
- Other Fresh Meat Products
- Other Meat Products
- Other Processed And Cured Meat Products
- Pork
- Poultry
- Processed Chicken
- Ready-To-Cook Meat Products
- Rte Meals
- Sausages
By Form
- Liquid
- Solid
By Fresh Meat Product Type
- Beef
- Mutton
- Other Fresh Meat Product Types
- Other Fresh Meat Products
- Pork
- Poultry
By Processed And Cured Meat Product Type
- Burgers
- Cured Bacon
- Deli Meat
- Deli Meats
- Hot Dogs
- Other Processed And Cured Meat Products
- Processed Chicken
- Sausages
By Ready-To-Eat Meat Product Type
- Jerky
- Meat Snacks
- Rte Meals
By Frozen Meat Product Type
- Frozen Meat Patties
- Frozen Meat-Based Appetizers
- Frozen Meatballs
By Convenience Food Product Type
- Frozen Meat-Based Meals
- Ready-To-Cook Meat Products
By Ready-To-Eat Meat Product Type 2019-2023
- Jerky
- Meat Snacks
- Rte Meals
Target Audience
- Food & Beverage Manufacturers : Need region-specific market data to develop plant-based product portfolios tailored to Rest Of Asia Pacific consumer preferences and regulatory requirements.
- Investment & Private Equity Firms : Require detailed market sizing and growth forecasts for Rest Of Asia Pacific to evaluate acquisition targets and investment opportunities in the non-meat ingredients sector.
- Distribution & Retail Companies : Need insights into Rest Of Asia Pacific market dynamics to optimize supply chain strategies, inventory management, and shelf-space allocation for plant-based products.
- Market Entry Strategists : Require region-specific analysis to assess market viability, competitive landscape, and localization requirements for entering Rest Of Asia Pacific non-meat ingredients market.
- Business Development Executives : Need comprehensive market intelligence on Rest Of Asia Pacific to identify partnership opportunities, distribution channels, and growth segments within the non-meat ingredients category.
Reasons to Buy this Report
- Regional Market Sizing : Obtain precise valuation data specific to Rest Of Asia Pacific non-meat ingredients market, enabling accurate budget allocation and investment decisions for regional expansion strategies.
- Growth Trajectory Analysis : Understand the 2.8% CAGR dynamics and USD 167.1 million growth opportunity through 2029, identifying optimal entry points and market timing for product launches in emerging economies.
- Competitive Positioning : Benchmark your organization against regional market trends and competitor activities specific to Rest Of Asia Pacific, gaining insights into localized consumer preferences and market gaps.
- Strategic Planning : Develop data-driven go-to-market strategies tailored to Rest Of Asia Pacific's unique characteristics, including distribution channels, pricing models, and product adaptation requirements.
- Risk Mitigation : Identify regional growth constraints and market maturation factors that differentiate Rest Of Asia Pacific from faster-growing regions, enabling proactive risk management and resource optimization.
Frequently asked questions
What is the market size of non-meat ingredients in Rest Of Asia Pacific in 2024?
Rest Of Asia Pacific's non-meat ingredients market is valued at USD 1,112.9 million in 2024.
What is the projected market size for Rest Of Asia Pacific by 2029?
Rest Of Asia Pacific's non-meat ingredients market is projected to reach USD 1,280.0 million by 2029.
What is the CAGR for Rest Of Asia Pacific's non-meat ingredients market?
Rest Of Asia Pacific's non-meat ingredients market is growing at a CAGR of 2.8% from 2024 to 2029.
What factors are driving growth in Rest Of Asia Pacific's non-meat ingredients market?
Rest Of Asia Pacific's market growth is driven by rising health consciousness, urbanization, increasing adoption of plant-based diets, and expanding retail distribution of alternative protein products.
How does Rest Of Asia Pacific's growth rate compare to the global market?
Rest Of Asia Pacific's CAGR of 2.8% is lower than the global CAGR of 4.4%, indicating more moderate growth in this region compared to the overall market.
RESEARCH METHODOLOGY
The study involved two major segments in estimating the current size of the non-meat ingredients market. Exhaustive secondary research was done to collect information on the market, peer, and parent markets. The next step was to validate these findings, assumptions, and sizing with industry experts across the value chain through primary research. Both top-down and bottom-up approaches were employed to estimate the complete market size. After that, market breakdown and data triangulation were used to estimate the market size of segments and subsegments.
Secondary Research
This research study involved the extensive use of secondary sources—directories and databases such as Bloomberg Businessweek and Factiva—to identify and collect information useful for a technical, market-oriented, and commercial study of the non-meat ingredients market.
In the secondary research process, various sources such as annual reports, press releases & investor presentations of companies, white papers, food journals, certified publications, articles from recognized authors, directories, and databases, were referred to identify and collect information.
Secondary research was mainly used to obtain key information about the industry’s supply chain, the total pool of key players, and market classification and segmentation as per the industry trends to the bottom-most level, regional markets, and key developments from both market- and technology-oriented perspectives.
Primary Research
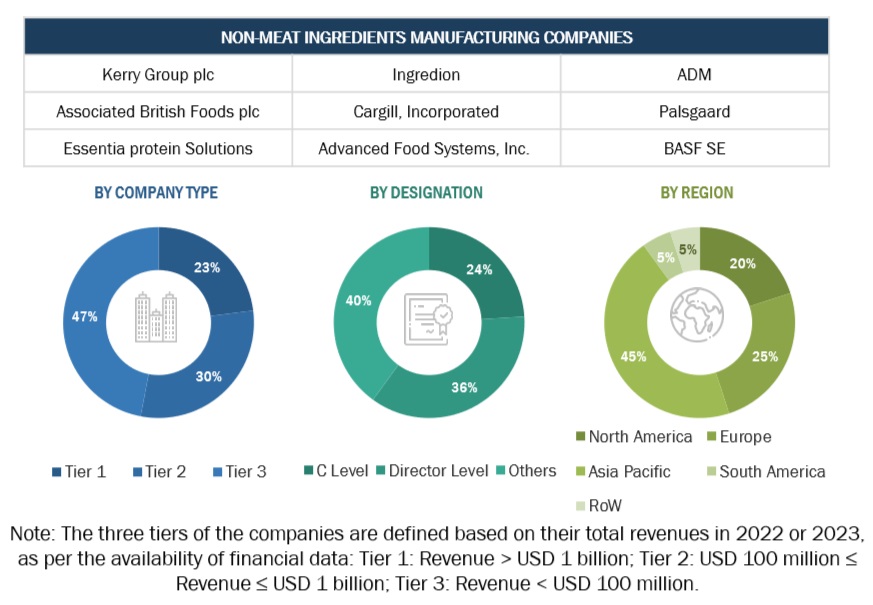
Extensive primary research was conducted after obtaining information regarding the non-meat ingredients market scenario through secondary research. Several primary interviews were conducted with market experts from both the demand and supply sides across major countries of North America, Europe, Asia Pacific, South America, and the Rest of the World. Primary data was collected through questionnaires, emails, and telephonic interviews. The primary sources from the supply side included various industry experts, such as Chief X Officers (CXOs), Vice Presidents (VPs), Directors, from business development, marketing, research, and development teams, and related key executives from distributors, and key opinion leaders. Primary interviews were conducted to gather insights such as market statistics, data on revenue collected from the products, market breakdowns, market size estimations, market forecasting, and data triangulation. Primary research also helped in understanding the various trends related to non-meat ingredients type, ingredient source, end-use application type, form, and region. Stakeholders from the demand side, such as meat products manufacturers who use the non-meat ingredients were interviewed to understand the buyer’s perspective on the suppliers, products, and their current usage of non-meat ingredients and the outlook of their business which will affect the overall market.
To know about the assumptions considered for the study, download the pdf brochure
|
COMPANY NAME |
designation |
|
DSM (Netherlands) |
Regional Sales Manager |
|
Kerry Group plc. (Ireland) |
Marketing Manager |
|
ADM (US) |
General Manager |
|
Associated British Foods plc (UK) |
Head of Export Department |
|
International Flavors & Fragrances Inc. (US) |
Sales Manager |
|
Cargill, Incorporated (US) |
Sales Executive |
Market Size Estimation
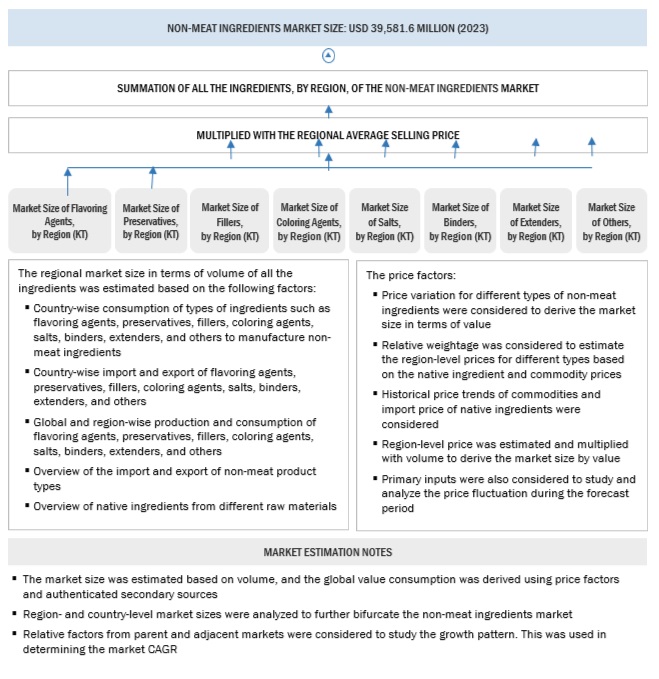
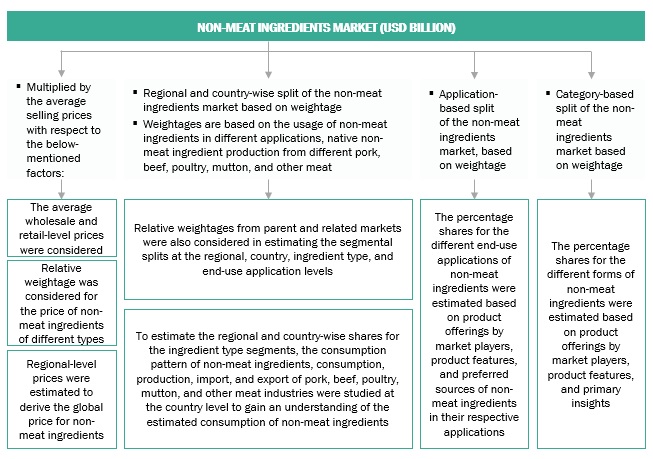
Both the top-down and bottom-up approaches were used to estimate and validate the total market size. These approaches were also used to estimate the size of various dependent submarkets. The research methodology used to estimate the market size includes the following:
- The key players in the industry and markets were identified through extensive secondary research.
- All shares, splits, and breakdowns were determined using secondary sources and verified through primary sources.
- All possible parameters that affect the markets covered in this research study were accounted for, viewed in extensive detail, verified through primary research, and analyzed to obtain the final quantitative and qualitative data.
- The research included the study of reports, reviews, and newsletters of top market players, along with extensive interviews for opinions from leaders, such as CEOs, directors, and marketing executives.
Global Non-meat Ingredients Market: Bottom-Up Approach.
To know about the assumptions considered for the study, Request for Free Sample Report
Global Non-meat Ingredients Market: Top-Down Approach.
Data Triangulation
After arriving at the overall market size from the estimation process explained above, the total market was split into several segments and subsegments. To estimate the overall non-meat ingredients market and arrive at the exact statistics for all segments and subsegments, data triangulation and market breakdown procedures were employed, wherever applicable. The data was triangulated by studying various factors and trends from the demand and supply sides. Along with this, the market size was validated using both the top-down and bottom-up approaches.
Market Definition
Multifunctional meat processing ingredients or non-meat ingredients alter the characteristics and properties of the meat to provide unique end-product effects or contribute in their way to the expected properties of processed meat products. Product properties that result from incorporating these non-meat ingredients are likely to be altered if these ingredients are reduced or eliminated, thereby making them a crucial part of most processed meats.
According to the American Meat Science Association, meat processing involves adding non-meat ingredients to improve texture and moisture retention. These ingredients can either enhance the functionality of existing muscle proteins or act as a separate system to hold moisture and modify texture.
Key Stakeholders
- Raw material suppliers
- Non-meat ingredients manufacturers and suppliers
- Meat processors and manufacturers
- Foodservice and restaurant operators
- Retailers & Distributors
- Commercial research & development (R&D) institutions and financial institutions
- Importers and exporters of non-meat ingredients
- Food & beverage traders, distributors, and suppliers
- Government organizations, research organizations, consulting firms, trade associations, and industry bodies
-
Associations, regulatory bodies, and other industry-related bodies:
- World Health Organization (WHO)
- Food and Agriculture Organization (FAO)
- United States Department of Agriculture (USDA)
- Food and Drug Administration (FDA)
- European Food Safety Authority (EFSA)
- Organization for Economic Co-operation and Development (OECD)
- European Association of Specialty Feed Ingredients and their Mixtures (FEFANA)
- Intermediary suppliers such as traders, distributors, and suppliers of ingredients and end products
- End users.
Report Objectives
- To define, segment, and forecast the global non-meat ingredients market based on ingredient source, ingredient type, end-use application type, form, and region over a historical period ranging from 2019 to 2023 and a forecast period ranging from 2024 to 2029.
- To provide detailed information about the key factors influencing the growth of the market (drivers, restraints, opportunities, and challenges).
- Identifying attractive opportunities in the market by determining the largest and fastest-growing segments across the regions.
-
Analyzing the demand-side factors based on the following:
- Impact of macro and microeconomic factors on the market.
- Shifts in demand patterns across different subsegments and regions.
- To strategically profile the key players and comprehensively analyze their core competencies.
- To analyze competitive developments, such as partnerships, mergers & acquisitions, new product developments, and expansions & investments in the non-meat ingredients market.
Available Customizations:
With the given market data, MarketsandMarkets offers customizations according to company-specific scientific needs.
The following customization options are available for the report:
Product Analysis
- Product Matrix, which gives a detailed comparison of the product portfolio of each company.
Geographic Analysis
With the given market data, MarketsandMarkets offers customizations according to company-specific scientific needs.
- Further breakdown of the Rest of European market for non-meat ingredients into Ireland, Poland, Sweden, and other EU and non-EU countries.
- Further breakdown of the Rest of Asia Pacific market for non-meat ingredients into the Philippines, Singapore, and Vietnam.
- Further breakdown of the Rest of South American market for non-meat ingredients into Peru, Paraguay, Uruguay, and Chile.
Company Information
- Detailed analyses and profiling of additional market players (up to five)
Get the Full Non-meat Ingredients Market Report
Full forecast, segment splits, and company analysis for all Non-meat Ingredients Market.
- Canada Non-meat Ingredients Market
- Mexico Non-meat Ingredients Market
- US Non-meat Ingredients Market
- Germany Non-meat Ingredients Market
- France Non-meat Ingredients Market
- UK Non-meat Ingredients Market
- Italy Non-meat Ingredients Market
- Spain Non-meat Ingredients Market
- China Non-meat Ingredients Market
- India Non-meat Ingredients Market
- Japan Non-meat Ingredients Market
- Brazil Non-meat Ingredients Market
- Argentina Non-meat Ingredients Market
- Rest Of Europe Non-meat Ingredients Market
- Rest Of South America Non-meat Ingredients Market
- Africa Non-meat Ingredients Market
- Middle East Non-meat Ingredients Market
Need a Tailored Report?
Customize this report to your needs
Get 10% FREE Customization
Customize This Report
