
Asia Pacific Interactive Kiosk Market (2025-2030)

The Asia Pacific Interactive Kiosk Market was valued at $5899 Million in 2025 and projected to reach to $11219.7 Million by 2030, representing a compound annual growth rate of 13.7%. The Asia Pacific interactive kiosk market is positioned for exceptional growth through 2030, driven by rapid urbanization, increasing consumer preference for self-service solutions, and government digitalization initiatives across the region.


| Market Size in | USD 26.32 MN |
| Market Forecast in | |
| CAGR | |
| Forecast Period | |
| Units Considered | Value (USD MN) |
Asia Pacific Interactive Kiosk Market Trends and Insights
- Asia Pacific's 13.7% compound annual growth rate significantly outpaces the global average of 10.3%, reflecting accelerating digital transformation across retail, healthcare, and government sectors throughout the region.
- This accelerated growth in Asia Pacific is driven by rising urbanization, increasing smartphone penetration, and substantial investments in smart city infrastructure across major economies. Asia Pacific's interactive kiosk adoption is reshaping customer engagement strategies in retail, banking, and hospitality sectors.
- The region's expanding middle class and growing e-commerce ecosystem are creating substantial demand for self-service solutions in Asia Pacific.
- Between 2025 and 2030, Asia Pacific is expected to capture an increasing share of global interactive kiosk deployments, with particular momentum in Southeast Asia, India, and China driving market expansion..
Key Market Statistics
- CAGR (2025-2030) 13.7% CAGR
- Market Size, 2025 ~USD 5899 Million
- Forecast, 2030 ~USD 11219.7 Million
- Geography Asia Pacific
Asia Pacific Interactive Kiosk Market Overview
Fastest Growing Region Globally :
Asia Pacific's 13.7% CAGR significantly outpaces the global average of 10.3%, driven by rapid digital transformation initiatives across retail, healthcare, and government sectors throughout the region.
Market Valuation Growth :
The Asia Pacific interactive kiosk market is valued at USD 5,899.0 million in 2025 and is projected to nearly double to USD 11,219.7 million by 2030, representing substantial investment opportunities.
Sector Expansion Drivers :
Rising adoption across retail automation, healthcare patient engagement, government service delivery, and transportation sectors is fueling demand for interactive kiosk solutions across major Asia Pacific economies.
Digital Transformation Momentum :
Accelerating digital transformation across emerging and developed Asia Pacific markets is creating unprecedented demand for self-service solutions and contactless service delivery mechanisms.
Asia Pacific Interactive Kiosk Market Dynamics
- Key markets including China, India, Japan, and Southeast Asia are investing heavily in retail modernization and smart city infrastructure, creating substantial demand for interactive kiosk deployments. Technological advancements in touchscreen interfaces, AI-powered customer engagement, and cloud connectivity are enhancing kiosk functionality and appeal.
- The region's young, tech-savvy population and rising middle-class consumer base further accelerate adoption.
- Strategic partnerships between technology providers and local retailers, healthcare facilities, and government agencies will continue to drive market expansion through 2030..
Market Ecosystem
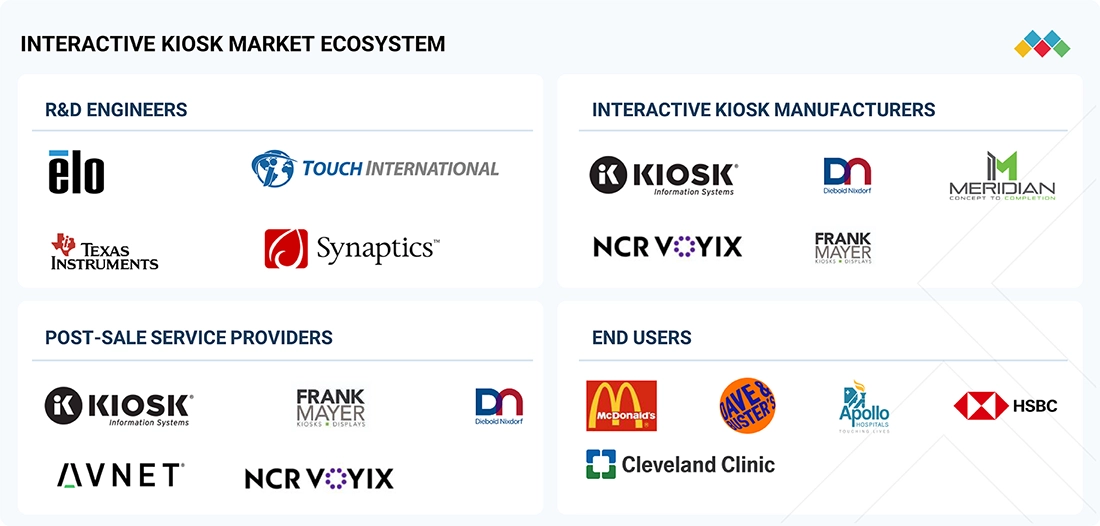
Interactive Kiosk Market: COMMERCIAL USE CASES ACROSS INDUSTRIES
| COMPANY | USE CASE DESCRIPTION | BENEFITS |
|---|---|---|
 |
Partnered with Diebold Nixdorf to deploy self-service kiosks equipped with modern multi-touch interfaces for Power Card purchases, recharges, and food ordering; kiosks were designed for high-speed transactions and seamless integration into the entertainment environment | Reduced wait times, improved staff efficiency | Enabled guests to spend more time playing and recharging cards | Enhanced the overall digital experience with a modular, scalable, and future-proof self-service solution |
 |
Collaborated with Pyramid Computer GmbH to install Polytouch self-service kiosks across retail stores, integrating them with POS and CRM systems to enable checkout, product lookup, loyalty registration, and digital payments | Improved checkout efficiency by over 40% | Reduced queue times | Increased data accuracy for loyalty analytics | Enhanced customer engagement as part of broader retail digital transformation strategy |
 |
Deployed KALEA interactive kiosks from ADVANTECH-AURES at its HOSHO budget hotels to enable guests to perform self check-in/out, access keycards, and make on-site payments via integrated scanners and payment modules | Provided 24/7 access for guests, reduced front-desk congestion | Improved check-in efficiency | Supported scalable hotel automation across European cities through modern, guest-centric experience |
 |
Partnered with Pyramid Computer GmbH to integrate POLYTOUCH PASSPORT 32 kiosks within hospital networks, supporting patient self check-in, data entry, wayfinding, and digital payments under Siemens’ HiMed healthcare platform | Streamlined patient admission | Reduced check-in times | Improved data accuracy | Minimized administrative burden, enabling staff to focus more on patient care while advancing healthcare digitalization |
 |
Implemented Lamasatech’s Dynamo survey & feedback kiosks across its public parks to collect real-time visitor feedback through smiley-face, multiple-choice, and open-ended questions via wired and 4G-connected units | Enhanced visitor engagement | Improved feedback response rates | Provided actionable insights in real time | Enabled faster operational decisions to address issues and boost public satisfaction |
Logos and trademarks shown above are the property of their respective owners. Their use here is for informational and illustrative purposes only.
Related Ecosystem
Banking
- Image Sensors
- Machine Learning
- Natural Language Processing (NLP)
- Platform as A Service (PaaS)
- Predictive Analytics
- ROLAND BERGER
- Oracle Corporation
- FINASTRA
- SAP SE
- International Business Machines Corporation
Mobility And Telecom
- Smart Utilities
- Smart Healthcare
- Sensors
- Parking Management System
- Passenger Information System (PIS)
- AT&T Inc.
- Cisco Systems, Inc.
- HUAWEI TECHNOLOGIES CO LTD
- Telefonaktiebolaget LM Ericsson (publ)
- International Business Machines Corporation
Retail Technology
- Supply Chain Management
- Active Tags
- Pallet Aggregation
- 2D Barcodes
- Augmented Reality
- MICROSOFT CORPORATION
- SAP SE
- Zebra Technologies Corporation
- Saison Information Systems Co., Ltd.
- International Business Machines Corporation
Key Takeaways
- Asia Pacific interactive kiosk market will nearly double from USD 5.9B (2025) to USD 11.2B (2030), driven by 13.7% CAGR.
- Asia Pacific's growth rate of 13.7% significantly exceeds the global CAGR of 10.3%, positioning the region as a primary growth engine.
- Retail, banking, and government sectors in Asia Pacific are leading adoption of interactive kiosks for enhanced customer self-service capabilities.
- Urbanization, digital payment adoption, and smart city initiatives across Asia Pacific are accelerating interactive kiosk deployment through 2030.
Interactive Kiosk Market Report Scope
| Report Metric | Details |
|---|---|
| Base Year | 2025 |
| Fastest Growing Segment | HEALTHCARE (Vertical) |
| Forecast Period | 2025–2030 |
| Growth Rate | CAGR of 10.3% from 2025 to 2030 |
| Largest Segment | FLOOR-STANDING (Mounting Type) |
| Market Size Base Year (Billions) | ~USD 21.84 (2025) |
| Revenue Forecast (Billions) | ~USD 35.65 (2030) |
| Segments Covered | Type, Vertical, Mounting Type, Display Panel Size, Offering, Hardware Type, Display Type, Input Device Type, Processing Unit Type, Peripheral Component Type, Software Type, Service Type |
Asia Pacific Interactive Kiosk Market Report Segmentation
12 segment dimensions are covered across the global market.
By Type
- Bitcoin Kiosks
- Government & Public Service Kiosks
- Healthcare Service Kiosks
- Hospitality & Travel Kiosks
- Information & Directory Kiosks
- Ordering & Retail Kiosks
- Other Kiosk Types
- Payment & Financial Service Kiosks
- Ticketing & Reservation Kiosks
By Vertical
- Entertainment & Leisure
- Financial Services
- Healthcare
- Hospitality
- Other Verticals
- Public Sector
- Restaurant & Qsr
- Retail
- Transportation
By Mounting Type
- Floor-Standing
- Other Mounting Types
- Wall-Mounted
By Display Panel Size
- Large
- Medium
- Small
By Offering
- Hardware
- Services
- Software
By Hardware Type
- Displays
- Input Devices
- Other Hardware Types
- Peripheral Components
- Processing Units
By Display Type
- Lcds
- Leds
- Oleds
By Input Device Type
- Keyboards
- Touchscreens
By Processing Unit Type
- Embedded Systems
- Industrial Pcs
By Peripheral Component Type
- Payment Modules
- Printers
- Scanners
By Software Type
- Content Management Systems (Cms)
- Kiosk Management Software
- Other Software Types
By Service Type
- Installation & Integration
- Maintenance & Support
- Other Services
Target Audience
- Technology Vendors & Manufacturers : Interactive kiosk hardware and software providers need Asia Pacific market data to identify high-growth segments, plan regional expansion, and develop localized solutions for diverse market requirements.
- Retail & Hospitality Operators : Retailers and hospitality businesses across Asia Pacific require market insights to evaluate interactive kiosk ROI, benchmark adoption rates, and make informed technology investment decisions for customer engagement.
- Healthcare & Government Agencies : Healthcare providers and government institutions need Asia Pacific market intelligence to understand digital transformation trends, service delivery innovations, and best practices for interactive kiosk implementation.
- Private Equity & Investment Firms : Investors and PE firms targeting Asia Pacific technology and retail sectors need comprehensive market data to evaluate investment opportunities, assess growth potential, and identify acquisition targets.
- System Integrators & Consultants : Solution providers and management consultants require Asia Pacific market insights to advise clients on kiosk deployment strategies, vendor selection, and digital transformation roadmaps specific to regional markets.
Key Companies in the Asia Pacific Interactive Kiosk Market
| Company | HQ | Ownership | Strongest segments |
|---|---|---|---|
| FLEX | United States | Public Company | Integrated Technology Solutions (ITS),Regulated Manufacturing Solutions (RMS),Cloud and Power Infrastructure (CPI), |
| SYNNEX CORPORATION | United States | Public Company | Endpoint solutions (PCs, peripherals, mobile, print),Advanced solutions (data center, networking, security, hyperscale),Cloud services and XaaS (public cloud, SaaS, DaaS), |
| GODREJ GROUP | India | Private Company | Home & Commercial Appliances,Locks, Security & Architectural Hardware,Industrial & Process Equipment (incl. aerospace, turbines, steel plant equipment), |
| LG CHEM LTD. | South Korea | Public Company | Ethylene-based synthetic resins (EVA, HDPE, LDPE, LLDPE, POE, metallocene PE, UNIQABLE),Styrene-based resins (ABS, ASA, EPS, PS, SAN),Polycarbonate and propylene-based resins (PC, PP), |
| SAISON INFORMATION SYSTEMS CO., LTD | Japan | Public Company | HULFT MFT & file integration (HULFT, HULFT 10, HULFT-WebConnect, HULFT-HUB),Cloud data integration & platforms (HULFT Square, DataSpider Servista, DataMagic, HULFT DataCatalog),System Outsourcing & integration services (core/ERP, CRM, HR, data utilization platforms), |
| LENOVO | China | Public Company | Small form factor PCs and embedded signage controllers,Thin clients and dedicated media players,Tablets and smart devices as kiosks/PoS displays, |
| NCR VOYIX CORPORATION | United States | Public Company | Retail segment (POS, self-checkout, kiosks, retail software, payments),Restaurants segment (POS, Aloha Next, online ordering, payments, services), |
| DIEBOLD NIXDORF, INCORPORATED | United States | Public Company | Banking Hardware (ATMs, recyclers, kiosks, teller automation),Banking Software and Services (Vynamic, integration, managed services),Retail Hardware (EPOS, self-checkout, peripherals), |
| ZEBRA TECHNOLOGIES CORP. | United States | Public Company | Printers, Supplies, and RFID Printers/Tags,Rugged Mobile Computers and Accessories,Scanning, Machine Vision, and Fixed Industrial Scanners, |
| ADVANTECH CO., LTD. | Taiwan | Public Company | Embedded boards & modules (SBC, COM, industrial motherboards),Industrial & embedded PCs (fanless, box, modular, rackmount IPC),IoT automation hardware (gateways, RTUs, I/O, HMI, panel PCs), |
| GLORY LTD. | Japan | Public Company | Financial market cash recyclers and teller systems,Retail and transportation automation,Amusement, gaming, and ballot handling, |
| PYRAMID COMPUTER GMBH | Germany | Public Company | Interactive kiosks and self-service terminals,Network and security servers,Touchscreen POS/POService devices, |
| NCR ATLEOS | United States | Public Company | Self-Service Banking (ATM hardware, software, services, ATMaaS),Network (Allpoint, retail/financial institution ATM networks, LibertyX),Telecommunications & Technology (managed network and infrastructure services), |
| VERIFONE, INC. | United States | Private Company | Payment devices and terminals,Payment gateway and hosted checkout,Managed and device management services, |
FLEX
Flex is a public company headquartered in the United States, founded in 1969. With 149,686 employees, it operates as a major multinational corporation.
SYNNEX CORPORATION
SYNNEX Corporation is a public company founded in 1980 and headquartered in the United States. The company employs 24,000 people and operates in the technology distribution and IT services sector.
GODREJ GROUP
Godrej Group is a private company founded in 1897 and based in India. With 13,316 employees, it is a diversified conglomerate with operations across multiple industries.
LG CHEM LTD.
LG Chem Ltd. is a South Korean public company founded in 1947 with 14,019 employees. The company is a leading chemical and materials manufacturer serving global markets.
SAISON INFORMATION SYSTEMS CO., LTD
Saison Information Systems Co., Ltd. is a Japanese public company founded in 1970 with 734 employees. The company provides information systems and technology solutions.
LENOVO
Lenovo is a public company founded in 1984 and headquartered in China. It is a global technology company known for manufacturing computers and related devices.
NCR VOYIX CORPORATION
NCR Voyix Corporation is a public company founded in 1884 and based in the United States with 13,500 employees. The company provides technology solutions and services.
DIEBOLD NIXDORF, INCORPORATED
Diebold Nixdorf, Incorporated is a public company founded in 1859 and headquartered in the United States with 20,000 employees. It is a provider of software, services, and systems for financial institutions and retailers.
ZEBRA TECHNOLOGIES CORP.
Zebra Technologies Corp. is a public company founded in 1969 in the United States with 10,700 employees. The company specializes in automatic identification and data capture solutions.
ADVANTECH CO., LTD.
Advantech Co., Ltd. is a Taiwanese public company founded in 1981 with 2,526 employees. The company provides industrial computing and IoT solutions globally.
GLORY LTD.
Glory Ltd. is a Japanese public company founded in 1918 with 11,266 employees. The company manufactures and provides solutions for currency and cash handling systems.
PYRAMID COMPUTER GMBH
Pyramid Computer GmbH is a public company founded in 1985 in Germany with 437 employees. The company develops and manufactures computer systems and solutions.
NCR ATLEOS
NCR Atleos is a public company founded in 1884 and based in the United States with 20,000 employees. The company provides technology solutions and services.
VERIFONE, INC.
VeriFone, Inc. is a private company founded in 1981 in the United States with 5,600 employees. The company provides payment and point-of-sale solutions.
Countries within Asia Pacific - compare and drill down
| Country | 2025 size (native) |
|---|
Country market size visualization
Reasons to Buy this Report
- Regional Market Intelligence : Gain comprehensive insights specific to Asia Pacific's interactive kiosk market dynamics, including country-level analysis, competitive landscape, and growth drivers unique to the region's diverse economies.
- Investment Decision Support : Access detailed market sizing (USD 5.9B in 2025 to USD 11.2B by 2030) and growth projections to inform capital allocation, expansion strategies, and partnership decisions across Asia Pacific markets.
- Competitive Positioning : Understand Asia Pacific's fastest-growing segments, emerging opportunities in retail, healthcare, and government sectors, and identify white-space opportunities ahead of competitors in high-growth markets.
- Sector-Specific Insights : Analyze interactive kiosk adoption trends across retail automation, healthcare patient engagement, government service delivery, and transportation sectors specific to Asia Pacific geographies.
- Strategic Planning : Leverage Asia Pacific market forecasts and trend analysis to develop targeted go-to-market strategies, product roadmaps, and localization approaches for maximum regional penetration and ROI.
Frequently asked questions
What is the projected market size for interactive kiosks in Asia Pacific by 2030?
Asia Pacific's interactive kiosk market is projected to reach USD 11,219.7 million by 2030, nearly doubling from USD 5,899.0 million in 2025.
How does Asia Pacific's growth rate compare to the global interactive kiosk market?
Asia Pacific's CAGR of 13.7% significantly outpaces the global CAGR of 10.3%, making the region a key growth driver for the interactive kiosk industry.
Which sectors are driving interactive kiosk adoption in Asia Pacific?
Retail, banking, healthcare, and government sectors in Asia Pacific are leading interactive kiosk adoption to enhance customer self-service and operational efficiency.
What factors are accelerating interactive kiosk growth in Asia Pacific?
Rising urbanization, increasing digital payment adoption, smartphone penetration, and smart city infrastructure investments are key growth catalysts across Asia Pacific.
Which countries in Asia Pacific are expected to drive the most growth?
China, India, and Southeast Asian nations are anticipated to be primary growth markets for interactive kiosks in Asia Pacific through 2030.
RESEARCH METHODOLOGY
The study involved four major activities in estimating the current size of the interactive kiosk market. Exhaustive secondary research was conducted to gather information on the market, adjacent markets, and the overall interactive kiosk landscape. These findings, assumptions, and projections were validated through primary research involving interviews with industry experts and key stakeholders across the value chain. Both top-down and bottom-up approaches were utilized to estimate the overall market size. Subsequently, market breakdown and data triangulation techniques were applied to determine the sizes of various segments and subsegments. Two key sources, secondary and primary, were leveraged to conduct a comprehensive technical and commercial assessment of the interactive kiosk market.
Secondary Research
The market for companies offering interactive kiosk solutions is arrived at by secondary data available through paid and unpaid sources, analyzing the product portfolios of major companies in the ecosystem, and rating the companies by their performance and quality. The secondary sources included annual reports, press releases, and investor presentations of companies; white papers; journals and certified publications; and articles from recognized authors, websites, directories, and databases. Secondary research was conducted to obtain key information about the industry’s supply chain, the market’s value chain, the total pool of key players, market segmentation according to the industry trends (to the bottom-most level), regional markets, and key developments from market- and technology-oriented perspectives. The secondary data was collected and analyzed to determine the overall market size, which is further validated through primary research.
Primary Research
Extensive primary research was conducted after gaining knowledge about the current scenario of the interactive kiosk market through secondary research. Several primary interviews were conducted with experts from the demand and supply sides across four major regions—North America, Europe, Asia Pacific, and RoW. This primary data was collected through questionnaires, emails, and telephonic interviews.

Notes: The three tiers of companies have been defined based on their total revenue as of 2024. The categorization given below has been applied:
Tier 1: >USD 1 billion, Tier 2: USD 250 million–USD 1 billion, and Tier 3: USD 250 million.
Other designations include sales managers, marketing managers, and product managers.
To know about the assumptions considered for the study, download the pdf brochure
Market Size Estimation
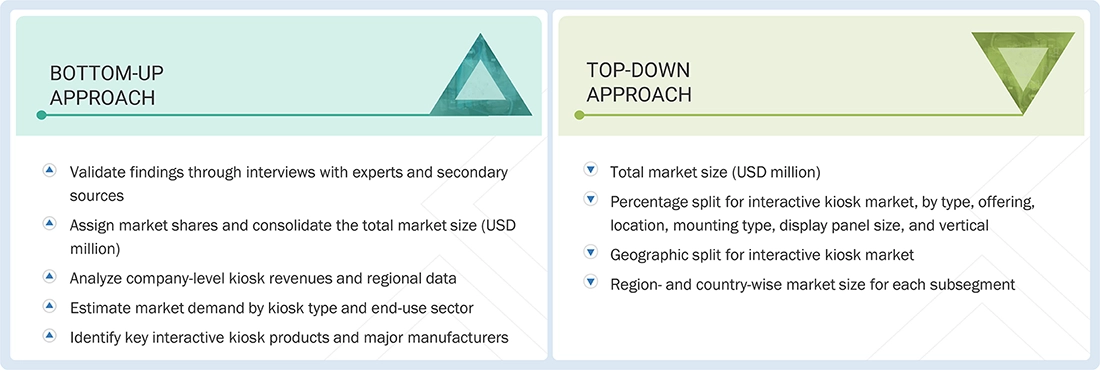
Both top-down and bottom-up approaches were used to estimate and validate the total size of the interactive kiosk market. These methods have also been used to estimate the size of various subsegments in the market. The following research methodology was used to estimate the market size:
- Identifying products currently provided or expected to be offered by providers
- Tracking major interactive kiosk manufacturers
- Estimating the size of the interactive kiosk market based on demand, considering installation base expansion, replacement cycles, and end user adoption across verticals such as retail, hospitality, transportation, and healthcare
- Tracking ongoing and upcoming product launches by companies and forecasting the market based on these developments and other critical parameters
- Conducting multiple discussions with key opinion leaders to understand the demand for interactive kiosks and analyzing the breakdown of the scope of work carried out by each major company
- Arriving at market estimates by analyzing revenues generated by manufacturers based on their locations (countries), and then combining country-based data to get a market estimate based on region
- Assigning a percentage to the overall revenue or, in a few cases, to segmental revenues of each company to derive their revenues from the sales of interactive kiosks. This percentage for each company has been assigned based on its product portfolio and target application
- Verifying and cross-checking estimates at every level through discussions with key opinion leaders, including CXOs, directors, operation managers, and domain experts at MarketsandMarkets
Interactive Kiosk Market: Top-Down and Bottom-Up Approach
Data Triangulation
After arriving at the overall size of the interactive kiosk market using the market size estimation process explained above, the total market was split into several segments and subsegments. Data triangulation and market breakdown procedures were employed, wherever applicable, to complete the overall market engineering process and arrive at the exact statistics for all segments and subsegments of the market. The data was triangulated by studying various factors and trends from the demand and supply sides. The market size was also validated using the top-down and bottom-up approaches.
Market Definition
The interactive kiosk refers to the ecosystem of self-service digital terminals that enable users to perform specific tasks or access information interactively without direct human assistance. These kiosks integrate hardware components, such as touchscreens, display panels, printers, scanners, sensors, and computing units, with software interfaces and connectivity features to deliver automated services across various public and commercial environments.
Interactive kiosks are deployed for diverse functions, including information dissemination, ticketing, payment transactions, product ordering, check-in/check-out, wayfinding, and other customer engagement applications. They are utilized across industries such as retail, banking & financial services, healthcare, transportation, hospitality, government, education, and entertainment.
An interactive kiosk represents the growing convergence of automation, IoT, AI-driven interfaces, and digital payment technologies in self-service solutions aimed at improving accessibility, reducing operational costs, and increasing customer engagement across physical touchpoints.
Key Stakeholders
- Raw material and component suppliers
- Display and touchscreen manufacturers
- Hardware component suppliers (processors, sensors, printers, scanners, etc.)
- Software and platform developers
- Original equipment manufacturers (OEMs)
- Original design manufacturers (ODMs) and kiosk integrators
- System integrators and solution providers
- Payment solution providers
- Networking and connectivity providers
- Distributors and retailers
- Research and development organizations
- Technology standards organizations, forums, alliances, and associations
- Technology investors and venture capital firms
- End users (retail, hospitality, transportation, BFSI, healthcare, government, entertainment, etc.)
- Maintenance and service providers
- Value-added resellers (VARs)
Report Objectives
- To describe and forecast the size of the interactive kiosk market, by offering, type, location, display panel size, mounting type, and vertical, in terms of value
- To describe and forecast the market size of various segments across four key regions—North America, Europe, Asia Pacific, and RoW, in terms of value
- To forecast the size of the interactive kiosk market, in terms of volume
- To provide detailed information regarding the drivers, restraints, opportunities, and challenges influencing the growth of the interactive kiosk market
- To analyze the interactive kiosk value chain and ecosystem, along with the average selling price of interactive kiosks
- To strategically analyze the regulatory landscape, standards, patents, Porter’s five forces, import and export scenarios, AI/Gen AI impact, trade values, the 2025 US tariff, and case studies pertaining to the market under study
- To strategically analyze micromarkets with regard to individual growth trends, prospects, and contributions to the overall market
- To analyze opportunities in the market for stakeholders by identifying high-growth segments
- To provide details of the competitive landscape for market leaders
- To provide details related to the macroeconomic outlook for regions covered under the study
- To analyze growth strategies, such as product launches, partnerships, contracts, collaborations, acquisitions, and expansions, adopted by players in the interactive kiosk market
- To profile key players in the interactive kiosk market and comprehensively analyze their market ranking based on their revenue, market share, and core competencies
Customization Options
With the given market data, MarketsandMarkets offers customizations according to the company’s specific needs. The following customization options are available for the report:
Company Information:
- Detailed analysis and profiling of additional market players (up to five)
Get the Full Interactive Kiosk Market Report
Full forecast, segment splits, and company analysis for all Interactive Kiosk Market.
Need a Tailored Report?
Customize this report to your needs
Get 10% FREE Customization
Customize This Report
