
Russia Ion Exchange Resins Market (2024-2029)

The Russia Ion Exchange Resins Market was valued at $20745 Million in 2024 and projected to reach to $23989 Million by 2029, representing a compound annual growth rate of CAGR 2.5%. Russia's ion exchange resins market is positioned for steady growth through 2029, driven by industrial modernization and stricter environmental regulations across water treatment and chemical processing sectors.


| Market Size in | USD 26.32 MN |
| Market Forecast in | |
| CAGR | |
| Forecast Period | |
| Units Considered | Value (USD MN) |
Russia Ion Exchange Resins Market Trends and Insights
- Russia's market growth is driven by increasing demand from water treatment, chemical processing, and pharmaceutical industries, where ion exchange resins play a critical role in purification and separation applications.
- The moderate growth trajectory reflects Russia's industrial recovery and sustained investment in infrastructure modernization across key end-use sectors. In 2024, Russia's ion exchange resins market demonstrated resilience despite geopolitical challenges, with domestic manufacturers and importers maintaining steady supply chains for critical applications.
- Russia's market expansion through 2029 will be supported by rising environmental regulations requiring advanced water treatment solutions and growing adoption in food and beverage processing.
- The forecast period anticipates Russia will see incremental capacity additions and technological improvements in resin formulations, positioning the country as a stable regional market within Europe's broader ion exchange resins landscape..
Key Market Statistics
- CAGR (2024-2029) CAGR 2.5%
- Market Size, 2024 ~USD 20745 Million
- Forecast, 2029 ~USD 23989 Million
- Country Russia
Russia Ion Exchange Resins Market Overview
Market Valuation :
Russia's ion exchange resins market reached USD 20,745 million in 2024, with steady growth projected to USD 23,989 million by 2029, reflecting moderate but consistent market expansion.
Growth Rate :
The Russian market is growing at a CAGR of 2.5% through 2029, outpacing some mature European markets but trailing the global average of 4.8%, indicating emerging opportunities.
Key Application Sectors :
Water treatment, chemical processing, and pharmaceutical industries are primary drivers of ion exchange resin demand in Russia, leveraging these materials for critical purification and separation applications.
Industrial Demand Drivers :
Increasing regulatory focus on water quality, expansion of chemical manufacturing capacity, and growing pharmaceutical production in Russia are fueling sustained demand for ion exchange resin solutions.
Russia Ion Exchange Resins Market Dynamics
- The pharmaceutical industry's expansion within Russia presents additional growth opportunities, as these resins are essential for drug purification and manufacturing processes.
- While the 2.5% CAGR is moderate compared to global trends, it reflects Russia's stable industrial base and increasing investment in infrastructure upgrades.
- Market consolidation among local suppliers and growing adoption of advanced resin technologies are expected to characterize the forecast period..
Market Ecosystem
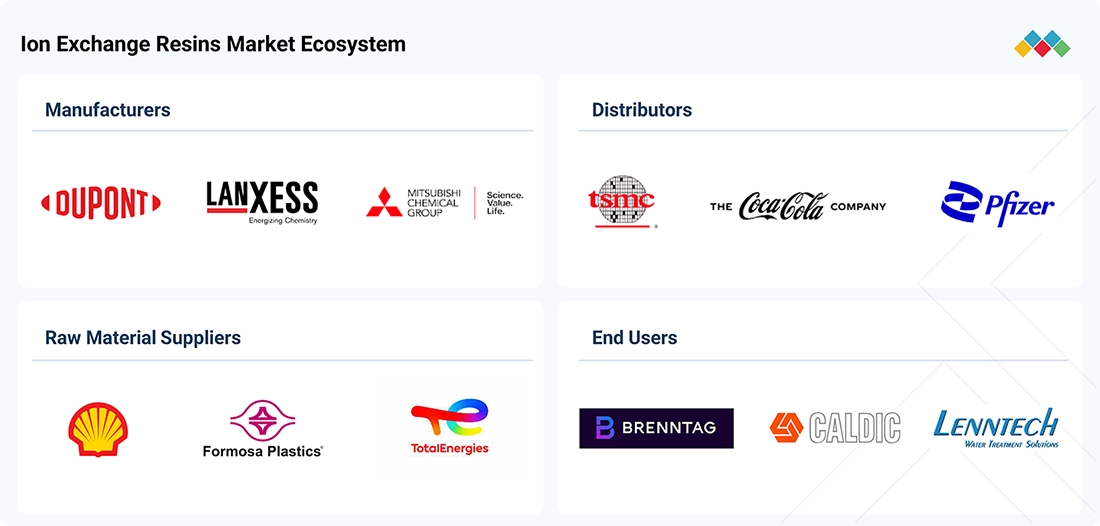
ION EXCHANGE RESINS MARKET: COMMERCIAL USE CASES ACROSS INDUSTRIES
| COMPANY | USE CASE DESCRIPTION | BENEFITS |
|---|---|---|
 |
Ion exchange resins purify industrial, nuclear, drinking, and electrolyzer process water | High-purity water, contaminant removal, and improved process efficiency |
 |
Lewatit resins treat water and liquids across power, pharmaceutical, chemical, mining, and semiconductor applications | Selective ion removal, purification, and resource recovery |
 |
DIAION resins support water purification, wastewater treatment, pharmaceutical, food, and semiconductor applications | Efficient purification, selective separation, and high-purity water |
 |
TRILITE resins enable water treatment and separation across pharmaceutical, semiconductor, and catalyst applications | Ultrapure water, contaminant removal, and efficient purification |
Logos and trademarks shown above are the property of their respective owners. Their use here is for informational and illustrative purposes only.
Related Ecosystem
Resins And Polymers
- Polycarbonate
- Acrylonitrile Butadiene Styrene (ABS)
- Epoxy Resin
- Light Commercial Vehicles (LCVs)
- Polypropylene (PP)
- Basf se
- DOW CHEMICAL COMPANY
- Solvay sa
- Saudi arabia basic industries corporation (sabic)
- DuPont de Nemours, Inc.
Water Purification
- Corrosion Inhibitors
- Cartridge Filters
- Fiberglass
- Reverse Osmosis
- Acetone
- Veolia
- Basf se
- CALGON CARBON CORPORATION
- SOLENIS
- Kemira oyj
Fandb Additives
- Dairy Products
- Bakery Products
- Polyglycerol Esters
- Microorganism
- Carbohydrates
- AZELIS HOLDINGS SA
- Archer-Daniels-Midland Company
- Amway
- UNILEVER PLC
- DuPont de Nemours, Inc.
Key Takeaways
- Russia's ion exchange resins market is valued at USD 20,745 million in 2024 and will reach USD 23,989 million by 2029 at a 2.5% CAGR.
- Russia's market growth is primarily driven by water treatment, chemical processing, and pharmaceutical applications requiring advanced purification technologies.
- Environmental regulations and infrastructure modernization initiatives are key growth catalysts for Russia's ion exchange resins demand through 2029.
- Russia maintains a stable regional position within Europe, supported by domestic manufacturing capacity and resilient supply chains across industrial sectors.
Ion Exchange Resins Market Report Scope
| Report Metric | Details |
|---|---|
| Base Year | 2024 |
| Fastest Growing Segment | ELECTRICAL & ELECTRONICS (End-Use Industry) |
| Forecast Period | 2024-2029 |
| Growth Rate | CAGR of 4.8% from 2024 to 2029 |
| Largest Segment | WATER (Application) |
| Market Size Base Year (Billions) | ~USD 2.11 (2024) |
| Revenue Forecast (Billions) | ~USD 2.67 (2029) |
| Segments Covered | Type, Application, End-Use Industry |
Russia Ion Exchange Resins Market Report Segmentation
3 segment dimensions are covered across the global market.
By Type
- Anionic Resins
- Cationic Resins
- Other Types
By Application
- -Industrial
- -Municipal
- -Others
- Non-Water
- Water
- -Industrial
- -Municipal
- -Others
By End-Use Industry
- Chemicals & Petrochemicals
- Electrical & Electronics
- Food & Beverage
- Metal & Mining
- Other End-Use Industries
- Pharmaceuticals
- Power
RUSSIA: ION EXCHANGE RESINS MARKET, BY END-USE INDUSTRY, 2024–2030
| Segment | 2024 | 2025 | 2026 | 2027 | 2028 | 2029 | 2030 | CAGR (%) |
|---|---|---|---|---|---|---|---|---|
| CHEMICALS & PETROCHEMICALS | 6.2 | 6.4 | 6.6 | 6.8 | 7.1 | 7.3 | 7.6 | 3.4 |
| ELECTRICAL & ELECTRONICS | 1.5 | 1.6 | 1.6 | 1.7 | 1.8 | 1.8 | 1.9 | 3.9 |
| FOOD & BEVERAGE | 3.1 | 3.2 | 3.3 | 3.4 | 3.5 | 3.7 | 3.8 | 3.6 |
| METAL & MINING | 3.3 | 3.4 | 3.5 | 3.6 | 3.7 | 3.8 | 4 | 3 |
| OTHERS | 24.7 | 25.5 | 26.2 | 27 | 27.8 | 28.7 | 29.6 | 3 |
| PHARMACEUTICALS | 4.2 | 4.3 | 4.5 | 4.6 | 4.7 | 4.9 | 5 | 3.1 |
| POWER | 31.2 | 32.3 | 33.4 | 34.5 | 35.7 | 37 | 38.3 | 3.5 |
| TOTAL | 74.2 | 76.6 | 79.1 | 81.7 | 84.4 | 87.2 | 90.1 | 3.3 |
Target Audience
- Chemical & Material Manufacturers : Producers of ion exchange resins need Russia-specific market data to assess demand potential, identify growth sectors, and develop localized product strategies for water treatment and pharmaceutical applications.
- Water Treatment Solution Providers : Companies offering water purification systems require detailed Russian market insights to understand resin demand drivers, regulatory requirements, and opportunities in industrial and municipal water treatment segments.
- Pharmaceutical & Chemical Processors : End-users in Russia's pharmaceutical and chemical industries need market intelligence to evaluate resin supplier options, forecast procurement needs, and optimize purification process investments.
- Investment & Business Development Teams : Corporate strategists evaluating market entry or expansion in Russia require comprehensive market sizing, growth forecasts, and competitive analysis to support investment decisions and partnership development.
- Market Research & Consulting Firms : Research organizations and consultants serving clients in Russia's industrial sectors need detailed market cutout data to support client advisory services, competitive benchmarking, and strategic planning initiatives.
Reasons to Buy this Report
- Market Size & Forecast Data : Access precise valuation figures for Russia's ion exchange resins market (USD 20,745M in 2024) with detailed 5-year forecasts, enabling accurate budgeting and investment planning for regional operations.
- Sector-Specific Insights : Understand demand patterns across Russia's water treatment, chemical processing, and pharmaceutical industries, allowing targeted market entry strategies and product positioning for maximum relevance.
- Competitive Landscape Analysis : Identify growth opportunities and competitive dynamics specific to the Russian market, including supplier consolidation trends and technology adoption patterns that differentiate this market from global averages.
- Regulatory & Industrial Context : Gain insights into Russia-specific environmental regulations, industrial modernization initiatives, and infrastructure investments driving ion exchange resin adoption across key end-use sectors.
- Strategic Decision Support : Make informed decisions on market entry, expansion, or partnership strategies in Russia with comprehensive data on growth trajectories, application demand, and regional market dynamics through 2029.
Frequently asked questions
What is the current market size of ion exchange resins in Russia?
Russia's ion exchange resins market was valued at USD 20,745 million in 2024 and is expected to grow to USD 23,989 million by 2029.
What is the projected growth rate for Russia's ion exchange resins market?
Russia's ion exchange resins market is projected to grow at a CAGR of 2.5% from 2024 to 2029.
Which industries drive demand for ion exchange resins in Russia?
Russia's primary demand drivers include water treatment, chemical processing, pharmaceutical manufacturing, and food and beverage processing industries.
What factors support Russia's ion exchange resins market growth through 2029?
Russia's market growth is supported by stricter environmental regulations, infrastructure modernization, and increased adoption of advanced purification technologies across industrial sectors.
How does Russia's ion exchange resins market compare to Europe's overall market?
Russia represents a stable regional market within Europe, with a 2.5% CAGR compared to Europe's broader market dynamics, reflecting moderate but consistent industrial demand.
RESEARCH METHODOLOGY
The study involved four major activities to estimate the current size of the global ion exchange resins market. Exhaustive secondary research was conducted to collect information on the ion exchange resins market, the peer product market, and the parent product group market. The next step was to validate these findings, assumptions, and sizes with industry experts across the ion exchange resins value chain through primary research. Both the top-down and bottom-up approaches were employed to estimate the overall size of the ion exchange resins market. After that, market breakdown and data triangulation were used to determine the sizes of different market segments and subsegments.
Secondary Research
For the secondary research, sources such as D&B Hoovers, Factiva, Bloomberg Businessweek, and Dun & Bradstreet were used to identify and collect information for this study of the ion exchange resins market. These sources included annual reports, press releases, and investor presentations from companies; white papers; certified publications; databases; articles by recognized authors; regulatory bodies; and trade directories.
Primary Research
The ion exchange resins market involves various stakeholders along the supply chain, such as raw material suppliers, distributors, end-product manufacturers, buyers, and regulatory bodies. Qualitative and quantitative data were collected through interviews with primary sources from both the supply and demand sides. On the demand side, key participants include opinion leaders, company executives, vice presidents, and CEOs in the market. On the supply side, primary sources consist of associations, institutions, influential opinion leaders, and processing companies involved in the market.
Breakdown of Primary Profiles
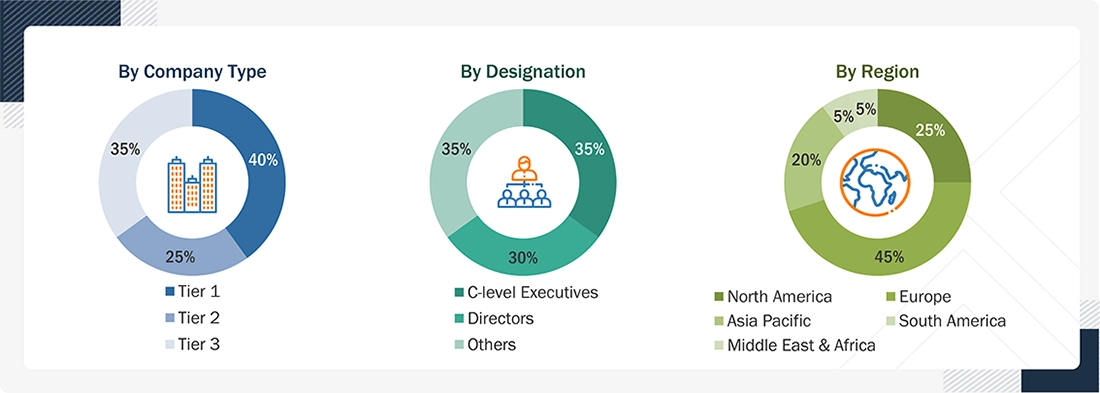
To know about the assumptions considered for the study, download the pdf brochure
Market Size Estimation
The bottom-up and top-down approaches were used to estimate the ion exchange resins market by type, application, end-use industry, and region. The research methodology used to calculate the market size includes the following steps:
- The key players in the industry and markets were identified through extensive secondary research.
- In terms of value, the industry’s supply chain and market size were determined through primary and secondary research processes.
- All percentage shares, splits, and breakdowns were determined using secondary sources and verified through primary sources.
- All parameters that affect the markets covered in this research study were accounted for, examined in detail, verified through primary research, and analyzed to obtain the final quantitative and qualitative data.
- The research included reviewing reports, reviews, and newsletters from top market players, as well as extensive interviews with leaders, such as directors and marketing executives, to gather opinions.
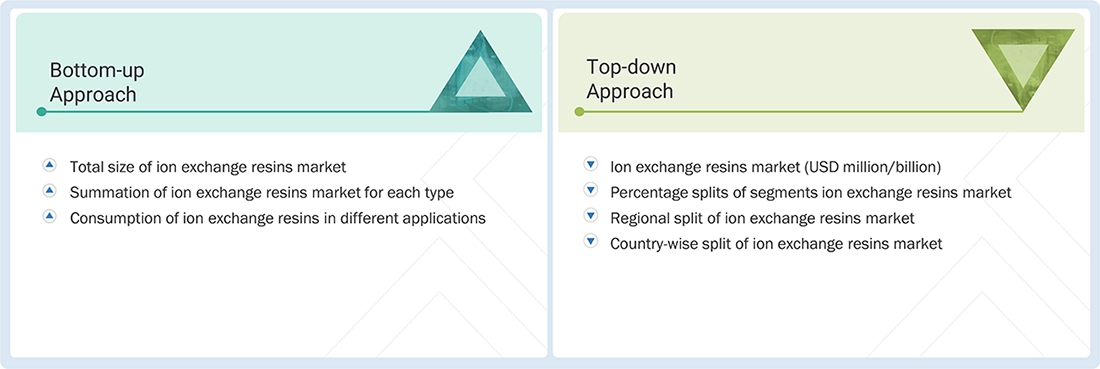
The following figure illustrates the overall market size estimation process employed for this study.
Data Triangulation
After estimating the total size of the ion exchange resins market, the market was divided into multiple segments and subsegments. Data triangulation and breakdown methods were used, where relevant, to refine the overall market analysis and determine precise statistics for all segments. The data was cross-checked by examining factors and trends from both demand and supply perspectives. Additionally, market size validation was performed using top-down and bottom-up approaches.
Market Definition
Ion exchange resins are insoluble polymers prepared by cross-linking polystyrenes that contain various functional groups. They act as a medium for ion exchange reactions and consist of a polymer matrix to which ion exchange sites are attached. These sites carry charged functional groups that attract and exchange ions of the opposite charge. Ion exchange resins are typically available as porous yellow microbeads, membranes, or granular material, although other forms, such as sheets, are also used. Ion exchange resins fall into two categories: cation exchange resins, which attract positive ions, and anion exchange resins, which attract negative ions. Ion exchange resins are used across various industries, such as power, chemical and petrochemical, food and beverage, pharmaceutical, electrical and electronics, metal and mining, and other industrial applications to improve system efficiency, reduce energy consumption, and extend equipment life.
Key Stakeholders
- Ion exchange resin manufacturers
- Raw material suppliers
- Regulatory bodies and government agencies
- Distributors and suppliers
- End-use industries
- Associations and industrial bodies
- Market research and consulting firms
Report Objectives
- To define, describe, and forecast the size of the ion exchange resins market in terms of value and volume
- To provide detailed information regarding the key factors influencing the growth of the market (drivers, restraints, opportunities, and challenges)
- To forecast the market size based on type, application, end-use industry, and region
- To forecast the market size for the five main regions—North America, Europe, Asia Pacific, South America, and Middle East & Africa—along with their key countries
- To strategically analyze micromarkets with respect to individual growth trends, prospects, and contributions to the total market
- To analyze opportunities in the market for stakeholders and provide details of the competitive landscape for market leaders
- To strategically profile leading players and comprehensively analyze their key developments, such as product launches, expansions, and deals in the ion exchange resins market
- To comprehensively analyze the market share and core competencies of key players
- To study the impact of AI/generative AI on the market under study, along with the macroeconomic outlook
Available customizations:
With the given market data, MarketsandMarkets offers customizations tailored to the specific needs of companies.
The following customization options are available for the report:
PRODUCT ANALYSIS
- Product matrix, which provides a detailed comparison of the market for different sources of ion exchange resins
REGIONAL ANALYSIS
- Further country-level breakdown of the ion exchange resins market
COMPANY INFORMATION
- Detailed analysis and profiling of additional market players
Get the Full Ion Exchange Resins Market Report
Full forecast, segment splits, and company analysis for all Ion Exchange Resins Market.
- Rest Of South America Ion Exchange Resins Market
- US Ion Exchange Resins Market
- Canada Ion Exchange Resins Market
- Mexico Ion Exchange Resins Market
- Germany Ion Exchange Resins Market
- France Ion Exchange Resins Market
- Italy Ion Exchange Resins Market
- UK Ion Exchange Resins Market
- Spain Ion Exchange Resins Market
- Netherlands Ion Exchange Resins Market
- China Ion Exchange Resins Market
- India Ion Exchange Resins Market
- Japan Ion Exchange Resins Market
- South Korea Ion Exchange Resins Market
- Thailand Ion Exchange Resins Market
- Indonesia Ion Exchange Resins Market
- Taiwan Ion Exchange Resins Market
- South Africa Ion Exchange Resins Market
- Brazil Ion Exchange Resins Market
- Argentina Ion Exchange Resins Market
- Rest Of Europe Ion Exchange Resins Market
- Rest Of Asia Pacific Ion Exchange Resins Market
- GCC Ion Exchange Resins Market
- Türkiye Ion Exchange Resins Market
- -Rest Of GCC Ion Exchange Resins Market
- -Saudi Arabia Ion Exchange Resins Market
Need a Tailored Report?
Customize this report to your needs
Get 10% FREE Customization
Customize This Report
