
Kuwait Agriculture IoT Market (2025-2030)

The Kuwait Agriculture IoT Market was valued at $17.5 Million in 2025 and projected to reach to $19.1 Million by 2030, representing a compound annual growth rate of 1.8%. Kuwait's Agriculture IoT market is positioned for measured growth as the nation addresses critical agricultural challenges through technological innovation.


| Market Size in | USD 26.32 MN |
| Market Forecast in | |
| CAGR | |
| Forecast Period | |
| Units Considered | Value (USD MN) |
Kuwait Agriculture IoT Market Trends and Insights
- Kuwait's agricultural sector is increasingly adopting IoT technologies to enhance crop monitoring, irrigation efficiency, and farm management practices.
- The modest growth trajectory reflects Kuwait's unique agricultural constraints, including limited arable land and reliance on imports, which moderate the pace of IoT adoption compared to global markets. Despite the slower growth rate, Kuwait demonstrates steady investment in smart farming solutions driven by government initiatives to improve food security and reduce water consumption in agriculture.
- The Agriculture IoT market in Kuwait is characterized by adoption of sensor networks, data analytics platforms, and connected farm equipment.
- Between 2025 and 2030, Kuwait's market will benefit from increasing awareness of precision agriculture benefits and technological advancements in IoT infrastructure, though growth remains constrained by regional agricultural limitations and market maturity factors..
Key Market Statistics
- CAGR (2025-2030) 1.8% CAGR
- Market Size, 2025 ~USD 17.5 Million
- Forecast, 2030 ~USD 19.1 Million
- Country Kuwait
Kuwait Agriculture IoT Market Overview
Market Valuation :
Kuwait's Agriculture IoT market is valued at USD 17.5 million in 2025, with projections reaching USD 19.1 million by 2030, representing a steady expansion in smart farming adoption.
Growth Rate :
The market expands at a CAGR of 1.8% through 2030, reflecting Kuwait's gradual transition toward technology-enabled agricultural practices despite regional constraints.
Key Application Areas :
IoT adoption in Kuwait focuses on crop monitoring systems, precision irrigation management, and integrated farm management solutions to optimize resource utilization in arid climates.
Market Drivers :
Water scarcity, government agricultural modernization initiatives, and the need for sustainable farming practices are propelling IoT technology adoption among Kuwaiti agricultural stakeholders.
Kuwait Agriculture IoT Market Dynamics
- The modest 1.8% CAGR reflects Kuwait's unique agricultural landscape, characterized by limited arable land and water resources, which necessitates efficient IoT-driven solutions for crop and irrigation management.
- Government support for agricultural diversification and sustainability initiatives is gradually encouraging farmers to adopt smart farming technologies. Looking ahead, Kuwait's Agriculture IoT market will benefit from increased investments in agricultural infrastructure, rising awareness of precision farming benefits, and regional partnerships.
- However, growth remains constrained by Kuwait's reliance on imports and the small-scale nature of domestic farming operations.
- Strategic focus on water-efficient IoT systems and government incentives will be critical to accelerating market penetration and achieving higher adoption rates among Kuwaiti agricultural enterprises..
Market Ecosystem
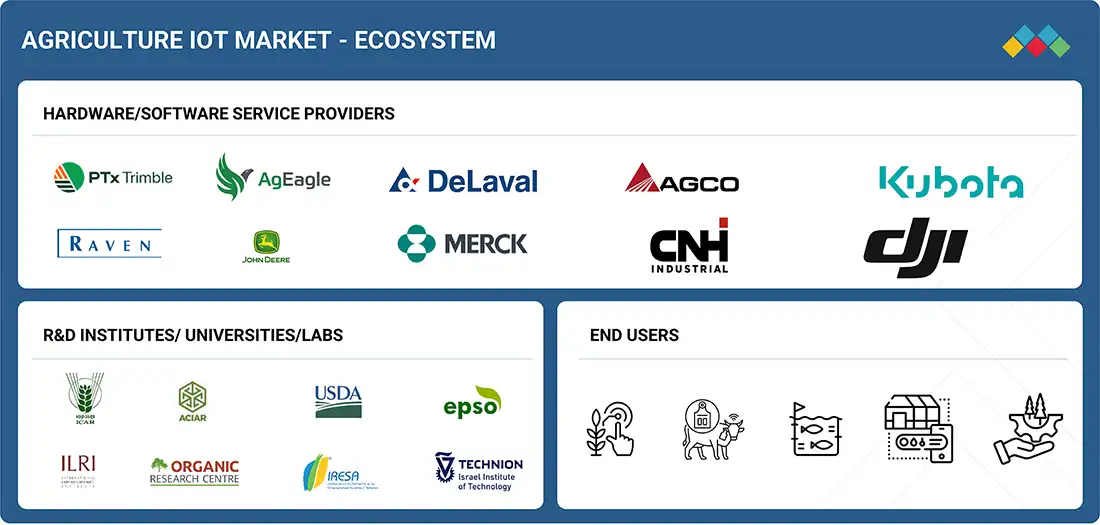
Agriculture IoT Market Growth: COMMERCIAL USE CASES ACROSS INDUSTRIES
| COMPANY | USE CASE DESCRIPTION | BENEFITS |
|---|---|---|
 |
Precision farming with high-resolution satellite imagery via Planet Labs partnership, integrated into the Cropwise digital agriculture platform | Enables early anomaly detection, improved decision-making, reduced input costs, higher yields, and sustainable farming practices |
 |
IoT-powered sensors with multi-network SIM cards for monitoring fruit size in real-time and uploading data to the cloud | Enhances forecasting and inventory management, reduces food waste, aligns fruit yield with market demand, and improves grower profitability |
 |
Drone-based remote sensing and satellite analytics to monitor crop health, water usage, and pest activity in California’s agriculture sector | Enabled early detection of stress, reduced water and chemical usage, optimized inputs, increased yields, lowered operational costs, and improved sustainability |
 |
Precision farming solutions for cotton farmers in Parbhani, Maharashtra, through a digital platform delivering real-time insights on crop management, soil health, and weather | Improved cotton yields, better pest and disease control, optimized resource utilization, enhanced crop quality, and increased farmer profitability |
 |
Precision herbicide spraying in sugarcane plantations of Paraná, Brazil, using DJI Agras T40 drones with mapping support from DJI Mavic 3M for optimized chemical application | Treated 4,000+ hectares with reduced chemical costs, lower environmental impact, improved weed control, healthier crops, enhanced efficiency, and greater operational agility. |
Logos and trademarks shown above are the property of their respective owners. Their use here is for informational and illustrative purposes only.
Related Ecosystem
Electronics System And Components
- Sensors
- Temperature Sensors
- Pressure Sensors
- Actuators
- Image Sensors
- Lenovo
- Samsung
- Texas Instruments Incorporated
- HONEYWELL INTERNATIONAL INC.
- Teledyne Technologies Incorporated
Internet Of Things And M2M
- Sensors
- Cellular Network
- Digital Signal Processor (DSP)
- Global Positioning System (GPS)
- Image Sensors
- MITSUI ELECTRONICS INC
- MICROSOFT CORPORATION
- INTEL CORPORATION
- Amazon.com, Inc.
- Cisco Systems, Inc.
Key Takeaways
- Kuwait's Agriculture IoT market is valued at USD 17.5 million in 2025 with a projected value of USD 19.1 million by 2030.
- Kuwait experiences a modest 1.8% CAGR, reflecting limited arable land and agricultural constraints unique to the region.
- Government food security initiatives in Kuwait are driving steady adoption of precision agriculture and IoT-enabled farm management solutions.
- Kuwait's Agriculture IoT growth is supported by increasing water conservation needs and technological advancements in connected farm equipment.
Agriculture IoT Market Report Scope
| Report Metric | Details |
|---|---|
| Base Year | 2025 |
| Fastest Growing Segment | GPS TRACKERS (Type) |
| Forecast Period | 2025-2030 |
| Growth Rate | CAGR of 7.3% from 2025 to 2030 |
| Largest Segment | PRECISION FARMING HARDWARE (Hardware) |
| Market Size Base Year (Billions) | ~USD 8.87 (2025) |
| Revenue Forecast (Billions) | ~USD 12.61 (2030) |
| Segments Covered | Hardware, Type, Drones/Uavs, Application, Farm Production Planning, Farm Size |
Kuwait Agriculture IoT Market Report Segmentation
6 segment dimensions are covered across the global market.
By Hardware
- Livestock Monitoring Hardware
- Monitoring Hardware
- Other Hardware
- Precision Aquaculture Hardware
- Precision Farming Hardware
- Precision Forestry Hardware
- Smart Greenhouse Hardware
By Type
- Automation & Control Systems
- Camera Systems
- Cameras
- Climate Sensors
- Control Systems
- Drones/Uavs
- Gps Trackers
- Gps/Gnss Trackers
- Guidance & Steering
- Harvester & Forwarder
- Hvac Systems
- Irrigation Controllers
- Irrigation Systems
- Led Grow Lights
- Other Automation & Control Systems
- Other Precision Aquaculture Hardware
- Other Precision Forestry Hardware
- Rfid Sensors
- Rfid Tags & Readers
- Sensing & Monitoring Devices
- Sensors
- Sensors & Cameras
- Soil Sensors
- Uavs/Drones
- Variable Rate Controllers
- Water Sensors
- Yield Monitors
By Drones/Uavs
- Drones/Uavs
By Application
- Livestock Monitoring
- Other Applications
- Precision Aquaculture
- Precision Farming
- Precision Forestry
- Smart Greenhouse
By Farm Production Planning
- Post-Production
- Pre-Production
- Production
- Production Planning
By Farm Size
- Large
- Medium
- Small
Target Audience
- Agricultural Technology Providers : IoT solution vendors and agritech companies need Kuwait-specific market data to develop localized products addressing water scarcity, irrigation efficiency, and sustainable farming practices.
- Government & Policy Makers : Kuwaiti agricultural ministries and planning authorities require market insights to design effective policies, subsidies, and modernization programs supporting IoT adoption.
- Investment & Venture Capital Firms : Investors targeting Middle Eastern agritech opportunities need Kuwait market analysis to evaluate growth potential, identify promising startups, and assess regional expansion viability.
- Agricultural Enterprises & Farmers : Large-scale farming operations and agricultural cooperatives in Kuwait need market intelligence to justify IoT investments and benchmark technology adoption against regional peers.
- Market Research & Consulting Firms : Research organizations and business consultants require detailed Kuwait Agriculture IoT data to support client advisory services, competitive analysis, and strategic planning initiatives.
Reasons to Buy this Report
- Localized Market Intelligence : Gain comprehensive insights specific to Kuwait's Agriculture IoT landscape, including market size, growth projections, and regional dynamics that differ significantly from global trends.
- Strategic Investment Planning : Identify growth opportunities and market entry strategies tailored to Kuwait's unique agricultural challenges, water scarcity issues, and government modernization initiatives.
- Competitive Positioning : Understand Kuwait's IoT adoption patterns, key application areas, and stakeholder preferences to develop targeted solutions for crop monitoring and irrigation efficiency.
- Risk Assessment & Forecasting : Access detailed 5-year forecasts and growth drivers specific to Kuwait, enabling informed decision-making for market expansion and resource allocation in the region.
- Stakeholder Engagement : Leverage Kuwait-specific data to engage with government bodies, agricultural enterprises, and technology providers with evidence-based insights and market validation.
Frequently asked questions
What is the current size of Kuwait's Agriculture IoT market?
Kuwait's Agriculture IoT market is valued at USD 17.5 million in 2025.
What is the projected size of Kuwait's Agriculture IoT market by 2030?
Kuwait's Agriculture IoT market is projected to reach USD 19.1 million by 2030.
What is the CAGR for Kuwait's Agriculture IoT market?
Kuwait's Agriculture IoT market is expected to grow at a CAGR of 1.8% from 2025 to 2030.
Why is Kuwait's Agriculture IoT growth rate lower than the global average?
Kuwait's modest 1.8% CAGR is driven by limited arable land, heavy reliance on agricultural imports, and regional constraints that moderate IoT adoption compared to global markets.
What factors are driving Agriculture IoT adoption in Kuwait?
Kuwait's Agriculture IoT adoption is driven by government food security initiatives, water conservation needs, and increasing awareness of precision agriculture benefits.
RESEARCH METHODOLOGY
The research study involved four major steps in estimating the size of the agriculture IoT market. Exhaustive secondary research has been done to collect important information about the market and peer markets. The next step has been to validate these findings and assumptions and size them with the help of primary research with industry experts across the value chain. Both top-down and bottom-up approaches have been used to estimate the market size. After this, the market breakdown and data triangulation approaches have been adopted to estimate the market sizes of segments and subsegments.
Secondary Research
Various secondary sources have been referred to in the secondary research process to identify and collect important information for this study. The secondary sources include annual reports, press releases, and investor presentations of companies; white papers; journals and certified publications; and articles from recognized authors, websites, directories, and databases. Secondary research has been conducted to obtain key information about the industry's supply chain, the market's value chain, the total pool of key players, market segmentation according to the industry trends (to the bottom-most level), regional markets, and key developments from market- and technology-oriented perspectives. The secondary data has been collected and analyzed to determine the overall market size, further validated by primary research.
Primary Research
Extensive primary research has been conducted after understanding the agriculture IoT market scenario through secondary research. Several primary interviews have been conducted with key opinion leaders from demand- and supply-side vendors across major regions— North America, Europe, Asia Pacific, RoW. This primary data has been collected mainly through telephonic interviews, which consist of 80% of the total primary interviews; questionnaires, and emails:
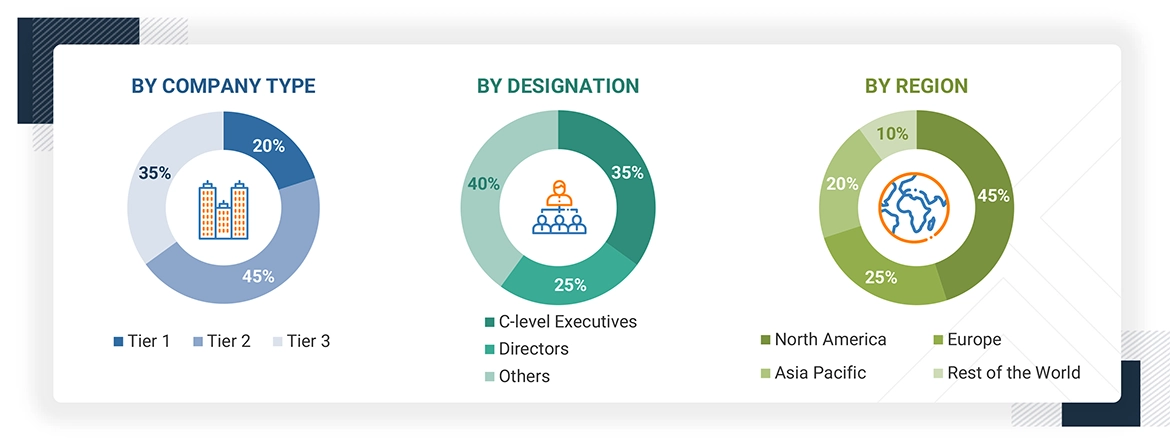
Note: Others include sales, marketing, and product managers.
To know about the assumptions considered for the study, download the pdf brochure
Market Size Estimation
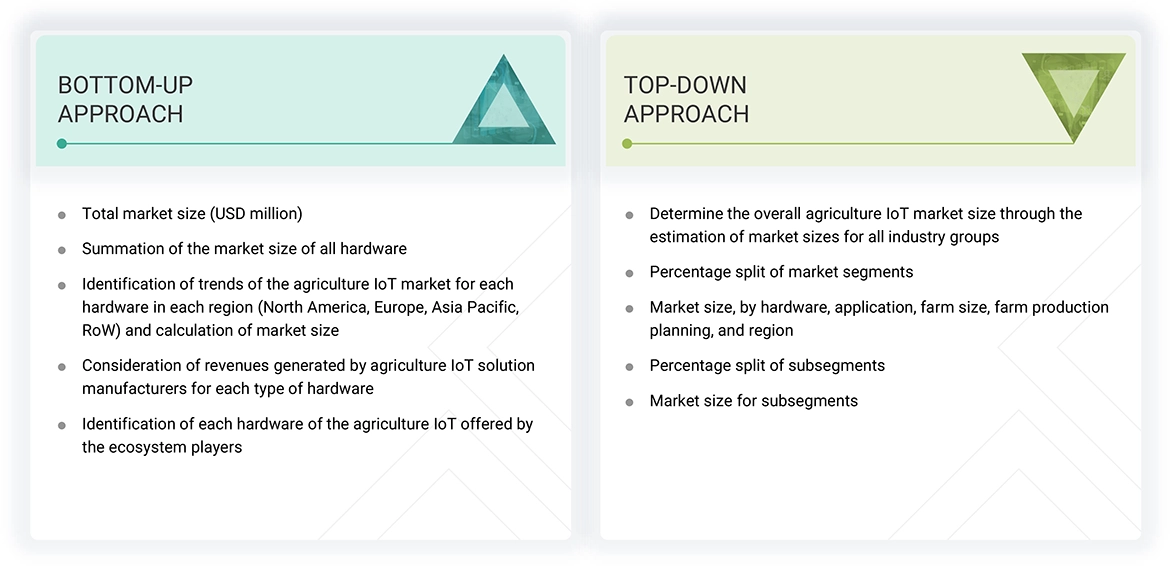
In the market engineering process, both top-down and bottom-up approaches and data triangulation methods have been used to estimate and validate the size of the agriculture IoT and other dependent submarkets. The research methodology used to estimate the market sizes includes the following:
- Identifying the players in the agriculture IoT market, along with their offerings
- Analyzing major manufacturers of agriculture IoT Solutions, studying their portfolios, and understanding several types of products based on their features and functions
- Tracking ongoing and upcoming developments in the market, such as investments made, R&D activities, product launches, acquisitions, partnerships, and forecasting the market based on these developments and other critical parameters
- Identification of each hardware of the agriculture IoT offered by the ecosystem players
- Consideration of revenues generated by agriculture IoT solution manufacturers for each type of hardware
- Identification of trends of the agriculture IoT market for each hardware in each region (North America, Europe, Asia Pacific, Rest of the World) and calculation of market size
- Summation of the market size of all hardware and deriving the total market size (USD million)
- Conducting multiple discussions with key opinion leaders to understand different agriculture IoT hardware, applications, and current trends in the market, thereby analyzing the breakup of the scope of work carried out by major manufacturing companies
- Arriving at the market estimates by analyzing the revenues of these companies generated from different types of products, and then combining the same to get the market estimate by region
- The pricing of various product types is calculated separately to analyze the shipment of the precision farming hardware category.
- Verifying and cross-checking the estimates at every level by discussing with key opinion leaders, such as CXOs, directors, and operations managers, and finally with the domain experts in MarketsandMarkets
- Studying various paid and unpaid sources of information, such as annual reports, press releases, white papers, and databases
Agriculture IoT Market : Top-Down and Bottom-Up Approach
Data Triangulation
After arriving at the overall market size, using the market size estimation processes as explained above, the market has been split into several segments and subsegments. Data triangulation and market breakdown procedures have been employed to complete the entire market engineering process and arrive at each market segment's and subsegment's exact statistics. The data has been triangulated by studying various factors and trends from the demand and supply sides in the agriculture IoT market.
Market Definition
The Agriculture IoT Market encompasses solutions that assess and track the quality, performance, and health of Agriculture IoT refers to the application of Internet of Things (IoT) technologies in agriculture, where interconnected devices such as sensors, monitors, cameras, controllers, and connectivity technologies are used in farming operations to collect and exchange real-time data. This integration enables monitoring, analysis, and optimization of agricultural activities, facilitating precision farming, efficient resource utilization (such as water, fertilizers, and energy), enhanced crop and livestock management, and data-driven decision-making to improve productivity, sustainability, and operational efficiency.
Key Stakeholders
- Agriculture IoT component providers
- Product manufacturers
- Agriculture IoT-related associations, organizations, forums, and alliances
- Government and corporate bodies
- Research institutes and organizations
- Venture capitalists, private equity firms, and start-ups
- Distributors and traders
- End users
- Market research and consulting firms
- Agri-food buyers
- Agriculture technology providers
Report Objectives
- To describe and forecast the size of the agriculture IoT market by hardware, farm size, farm production planning, application, and region in terms of value
- To estimate the market size of various segments across four key regions, North America, Europe, Asia Pacific, and RoW, in terms of value
- To forecast the size of the agriculture IoT market by automation & control systems, in terms of volume
- To provide detailed information regarding the drivers, restraints, opportunities, and challenges influencing the growth of the agriculture IoT market
- To evaluate the agriculture IoT value chain and ecosystem, along with the average selling price of drones/UVAs
- To strategically analyze the regulatory landscape, tariffs, standards, patents, Porter's five forces, import and export scenarios, AI/Gen AI impact, trade values, the 2025 US Tariff, and case studies pertaining to the market under study
- To understand micromarkets with regard to individual growth trends, prospects, and contributions to the overall market
- To study opportunities in the market for stakeholders by identifying high-growth segments
- To provide details of the competitive landscape for market leaders
- To offer details of the macroeconomic outlook for regions
- To analyze strategies such as product launches, contracts, collaborations, and acquisitions adopted by players in the agriculture IoT market
- To profile key players in the agriculture IoT market and comprehensively analyze their market ranking based on their revenue, market share, and core competencies
Available Customizations:
With the given market data, MarketsandMarkets offers customizations according to the specific requirements of companies. The following customization options are available for the report:
- Detailed analysis and profiling of additional market players based on various blocks of the supply chain
Get the Full Agriculture IoT Market Report
Full forecast, segment splits, and company analysis for all Agriculture IoT Market.
- US Agriculture IoT Market
- Canada Agriculture IoT Market
- Mexico Agriculture IoT Market
- Germany Agriculture IoT Market
- UK Agriculture IoT Market
- Italy Agriculture IoT Market
- Netherlands Agriculture IoT Market
- Poland Agriculture IoT Market
- China Agriculture IoT Market
- Japan Agriculture IoT Market
- Australia Agriculture IoT Market
- India Agriculture IoT Market
- South Korea Agriculture IoT Market
- Indonesia Agriculture IoT Market
- Malaysia Agriculture IoT Market
- Thailand Agriculture IoT Market
- Vietnam Agriculture IoT Market
- France Agriculture IoT Market
- Nordics Agriculture IoT Market
- Rest Of Europe Agriculture IoT Market
- Rest Of Asia Pacific Agriculture IoT Market
- Africa Agriculture IoT Market
- Middle East Agriculture IoT Market
- South America Agriculture IoT Market
- Argentina Agriculture IoT Market
- Brazil Agriculture IoT Market
- Rest Of South America Agriculture IoT Market
- Bahrain Agriculture IoT Market
- Oman Agriculture IoT Market
- Qatar Agriculture IoT Market
- Rest Of Middle East Agriculture IoT Market
- Saudi Arabia Agriculture IoT Market
- UAE Agriculture IoT Market
- Rest Of Africa Agriculture IoT Market
- South Africa Agriculture IoT Market
Need a Tailored Report?
Customize this report to your needs
Get 10% FREE Customization
Customize This Report
