
Asia Pacific Lubricants Market (2025-2030)

The Asia Pacific Lubricants Market was valued at $67343 Million in 2025 and projected to reach to $79249 Million by 2030, representing a compound annual growth rate of CAGR 3.31%. Asia Pacific's lubricants market is positioned for sustained growth through 2030, fueled by expanding automotive production, industrial manufacturing, and infrastructure development across the region.


| Market Size in | USD 26.32 MN |
| Market Forecast in | |
| CAGR | |
| Forecast Period | |
| Units Considered | Value (USD MN) |
Asia Pacific Lubricants Market Trends and Insights
- The region's lubricants market is estimated at USD 67,343 million in 2025 and is forecast to grow to USD 79,249 million by 2030, expanding at a compound annual growth rate (CAGR) of 3.31%.
- This growth trajectory reflects Asia Pacific's robust industrial expansion, rising automotive production, and increasing demand for high-performance lubricants across manufacturing and transportation sectors. The Asia Pacific lubricants market is driven by rapid industrialization in emerging economies, growing vehicle ownership, and stringent environmental regulations promoting synthetic and bio-based lubricants.
- Asia Pacific's manufacturing base, particularly in automotive, heavy machinery, and power generation, continues to fuel demand for specialized lubricant formulations.
- Between 2025 and 2030, Asia Pacific is expected to maintain steady growth momentum, supported by infrastructure development and technological advancements in lubricant chemistry. Asia Pacific's competitive landscape features both multinational lubricant manufacturers and regional players adapting to local market needs.
- The region's growth outlook remains positive, with Asia Pacific positioned as a key growth engine for the global lubricants industry through 2030..
Key Market Statistics
- CAGR (2025-2030) CAGR 3.31%
- Market Size, 2025 ~USD 67343 Million
- Forecast, 2030 ~USD 79249 Million
- Geography Asia Pacific
Asia Pacific Lubricants Market Overview
Market Leadership :
Asia Pacific dominates the global lubricants market with China alone accounting for USD 37,409.3 million, representing over 55% of the region's total market value in 2025.
Accelerated Growth Rate :
The region's 3.31% CAGR outpaces the global average of 2.8%, driven by rapid industrialization, automotive expansion, and manufacturing growth across emerging economies.
Significant Market Expansion :
Asia Pacific lubricants market is projected to grow from USD 67,343 million in 2025 to USD 79,249 million by 2030, representing an incremental value addition of USD 11,906 million.
Diverse Economic Base :
The region encompasses major economies including Japan (USD 9,296M), India (USD 7,666.5M), and South Korea (USD 3,384M), providing multiple growth vectors and market opportunities.
Asia Pacific Lubricants Market Dynamics
- China's dominance as the world's largest manufacturing hub continues to drive demand for high-performance lubricants across automotive, industrial, and heavy equipment sectors.
- Emerging economies like India and Indonesia present significant untapped potential with rising vehicle ownership and industrial activity. The region's growth trajectory is supported by increasing adoption of advanced synthetic lubricants, stringent environmental regulations promoting eco-friendly formulations, and technological innovations in engine efficiency.
- Strategic investments by multinational lubricant manufacturers and local players, combined with rising disposable incomes and urbanization, will further accelerate market expansion through 2030..
Market Ecosystem
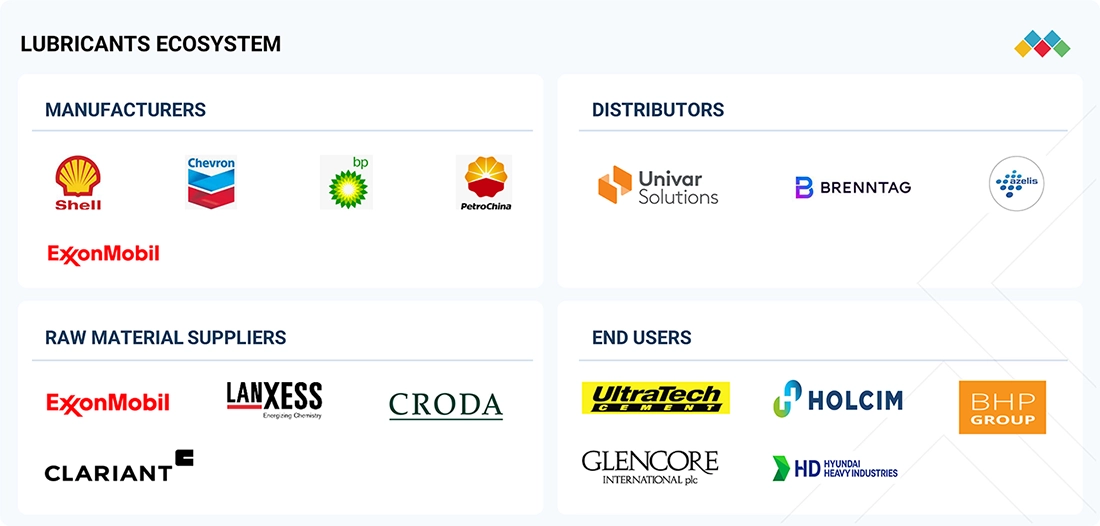
LUBRICANTS MARKET: COMMERCIAL USE CASES ACROSS INDUSTRIES
| COMPANY | USE CASE DESCRIPTION | BENEFITS |
|---|---|---|
 |
Heavy-duty engine and hydraulic system lubrication for construction and mining equipment | Ensures smooth operation under high loads, reduces wear and tear, improves equipment lifespan |
 |
Turbine and generator lubrication in power plants | Enhances thermal stability, reduces friction, and maintains consistent performance in high-temperature operations |
 |
Aircraft engine and component lubrication | Improves fuel efficiency, reduces mechanical wear, and ensures safe, reliable operations under extreme conditions |
 |
Rolling mill and steel processing machinery lubrication | Provides corrosion protection, reduces downtime, and maintains consistent machinery performance in high-stress industrial environments |
Logos and trademarks shown above are the property of their respective owners. Their use here is for informational and illustrative purposes only.
Related Ecosystem
Defence Platforms And Systems
- Sensors
- Unmanned Ground Vehicles (UGV)
- Fighter Aircraft
- Special Mission Aircraft
- Antennas
- BAE Systems plc
- Thales group
- LOCKHEED MARTIN CORPORATION
- Northrop Grumman Corporation
- L3Harris Technologies, Inc.
Farm Equipment And Irrigation
- Sensors
- Hydroponics
- Aeroponics
- Camera Systems
- Global Positioning System (GPS)
- MSK FARM MACHINERY CORPORATION
- MITSUBISHI AGRICULTURAL MACHINERY
- MITSUBISHI CHEMICAL AGRI DREAM
- RIVULIS IRRIGATION
- Deere & Company
Automotive Electronics And Electrical Equipment
- Battery Electric Vehicle (BEV)
- Light Commercial Vehicles (LCVs)
- Fuel Cell Electric Vehicle (FCEV)
- Sensors
- Hybrid Electric Vehicle (HEV)
- BOSCH LIMITED
- DENSO Corporation
- Continental ag
- Panasonic Holdings Corporation
- Texas Instruments Incorporated
Key Takeaways
- Asia Pacific lubricants market valued at USD 67.3 billion in 2025, growing to USD 79.2 billion by 2030 at 3.31% CAGR
- Asia Pacific's automotive and industrial sectors drive demand for advanced lubricant formulations and synthetic products
- Environmental regulations in Asia Pacific are accelerating adoption of eco-friendly and bio-based lubricants
- Asia Pacific remains a strategic growth region with emerging economies offering significant expansion opportunities through 2030
Lubricants Market Report Scope
| Report Metric | Details |
|---|---|
| Base Year | 2025 |
| Fastest Growing Segment | –FOOD PROCESSING (End-Use Industry) |
| Forecast Period | 2025–2030 |
| Growth Rate | CAGR of 2.8% from 2025 to 2030 |
| Largest Segment | MINERAL OIL LUBRICANTS (Base Oil) |
| Market Size Base Year (Billions) | ~USD 177.78 (2025) |
| Revenue Forecast (Billions) | ~USD 204.1 (2030) |
| Segments Covered | Base Oil, Product Type, End-Use Industry, Vehicle Type |
Asia Pacific Lubricants Market Report Segmentation
4 segment dimensions are covered across the global market.
By Base Oil
- Bio-Based Lubricants
- Mineral Oil Lubricants
- Synthetic Lubricants
By Product Type
- Compressor Oil
- Engine Oil
- Gear Oil
- Grease
- Hydraulic Oil
- Metalworking Fluid
- Other Product Types
- Turbine Oil
By End-Use Industry
- Industrial
- Transportation
- – Others
- –Automobile Manufacturing
- –Aviation
- –Cement Production
- –Chemical
- –Commercial Vehicle
- –Construction
- –Food Processing
- –Marine
- –Metal & Mining
- –Oil & Gas
- –Others
- –Passenger Vehicle
- –Power Generation
- –Railways
- –Textile
By Vehicle Type
- 2-Wheeler Vehicle
- 4-Wheeler Vehicle
Target Audience
- Lubricant Manufacturers & Suppliers : Strategic market data enables product development prioritization, geographic expansion planning, and competitive positioning across Asia Pacific's diverse regulatory and demand landscapes.
- Automotive OEMs & Aftermarket Players : Detailed regional forecasts support supply chain optimization, lubricant specification decisions, and market entry strategies in high-growth automotive markets like China and India.
- Industrial Equipment Manufacturers : Country-level market insights inform lubricant partnership strategies, equipment localization decisions, and aftermarket service offerings across Asia Pacific industrial sectors.
- Investment & Private Equity Firms : Comprehensive market sizing and growth projections facilitate M&A target identification, valuation benchmarking, and portfolio company performance tracking in the lubricants sector.
- Distributors & Retailers : Regional and country-specific market data guides inventory planning, channel strategy development, and sales forecasting across Asia Pacific's fragmented lubricants distribution networks.
Key Companies in the Asia Pacific Lubricants Market
| Company | HQ | Ownership | Strongest segments |
|---|---|---|---|
| QATAR PETROLEUM | Qatar | Private Company | LNG & Natural Gas Liquids,Crude Oil & Condensate,Refined Products & Jet Fuel, |
| CALUMET SPECIALTY PRODUCTS PARTNERS | United States | Public Company | Specialty Products and Solutions,Montana/Renewables,Performance Brands, |
| EXXON MOBIL CORPORATION | United States | Public Company | Upstream (crude oil and natural gas),Energy Products (fuels, aromatics, catalysts, licensing),Chemical Products (olefins, polyolefins, intermediates), |
| TOTALENERGIES SE | France | Public Company | Crude oil and refined products,Natural gas and LNG,Power, renewables, and electricity, |
| SHELL PLC | United Kingdom | Public Company | Integrated Gas (LNG and GTL),Upstream (oil, gas, NGLs),Chemicals and Products, |
| CHEVRON CORPORATION | United States | Public Company | Upstream (crude oil and natural gas, LNG, gas-to-liquids, CCS),Downstream refining and marketing (fuels, lubricants, renewable fuels),Petrochemicals, plastics, and additives, |
| BP P.L.C. | United Kingdom | Public Company | Crude oil production & upstream gas,Refining, trading & midstream,Customers & products (retail fuel, convenience, B2B), |
| PETROCHINA COMPANY LIMITED | China | Public Company | Oil, Gas and New Energy,Refining, Chemicals and New Materials,Sales (Refined and Non-oil Products, Trading), |
| CHINA PETROLEUM & CHEMICAL CORPORATION | China | Public Company | Refining and petroleum products (gasoline, diesel, jet, fuel oil),Chemicals and petrochemicals (resins, fibers, rubbers, fertilizers),Exploration and production (crude oil and natural gas), |
| ENEOS HOLDINGS, INC. | Japan | Public Company | Petroleum product refining and sales,Petrochemicals and functional materials,Lubricants, |
| IDEMITSU KOSAN CO., LTD. | Japan | Public Company | Fuel Oil (incl. sustainable and synthetic fuels),Basic Chemicals (olefins, aromatics),Functional Materials (lubricants, chemicals, electronic materials, bitumen, agri-bio), |
QATAR PETROLEUM
QATAR PETROLEUM is a private Qatari petroleum company founded in 1974 with 8,270 employees.
CALUMET SPECIALTY PRODUCTS PARTNERS
CALUMET SPECIALTY PRODUCTS PARTNERS is a publicly traded United States company founded in 1919 with 1,540 employees.
EXXON MOBIL CORPORATION
EXXON MOBIL CORPORATION is a publicly traded United States energy company founded in 1870 with 57,900 employees.
TOTALENERGIES SE
TOTALENERGIES SE is a publicly traded French energy company founded in 1924 with 94,847 employees.
SHELL PLC
SHELL PLC is a publicly traded United Kingdom energy company founded in 1897 with 84,000 employees.
CHEVRON CORPORATION
CHEVRON CORPORATION is a publicly traded United States energy company founded in 1879 with 43,039 employees.
BP P.L.C.
BP P.L.C. is a publicly traded United Kingdom energy company founded in 1908 with 93,700 employees.
PETROCHINA COMPANY LIMITED
PETROCHINA COMPANY LIMITED is a publicly traded Chinese petroleum company founded in 1999 with 367,173 employees.
CHINA PETROLEUM & CHEMICAL CORPORATION
CHINA PETROLEUM & CHEMICAL CORPORATION is a publicly traded Chinese petroleum company founded in 2000 with 351,104 employees.
ENEOS HOLDINGS, INC.
ENEOS HOLDINGS, INC. is a publicly traded Japanese energy company founded in 1888 with 34,099 employees.
IDEMITSU KOSAN CO., LTD.
IDEMITSU KOSAN CO., LTD. is a publicly traded Japanese petroleum company founded in 1911 with 14,392 employees.
Countries within Asia Pacific - compare and drill down
| Country | 2025 size (native) |
|---|---|
| China | USD 37409.3 Million |
| Japan | USD 9296 Million |
| India | USD 7666.5 Million |
| South Korea | USD 3384 Million |
| Indonesia | USD 3457 Million |
| Thailand | USD 2060 Million |
| Australia And New Zealand | USD 5207 Million |
| Rest Of Asia Pacific | USD 10771 Million |
Country market size visualization
Reasons to Buy this Report
- Regional Market Dominance Insights : Gain comprehensive understanding of Asia Pacific's 55%+ share of global lubricants market, with detailed analysis of China's USD 37.4B market and emerging opportunities in India and Southeast Asia.
- Growth Rate Advantage : Leverage Asia Pacific's 3.31% CAGR—18% higher than global average—to identify high-growth segments and prioritize market entry strategies in the fastest-expanding lubricants region.
- Country-Level Market Segmentation : Access granular market data across 7 major Asia Pacific economies including Japan, South Korea, Indonesia, and Thailand to tailor product portfolios and distribution strategies by market maturity.
- Forecast-Driven Strategic Planning : Utilize 2025-2030 market projections showing USD 11.9B incremental growth to guide capital allocation, capacity planning, and competitive positioning in the region's expanding lubricants sector.
- Competitive Landscape Intelligence : Understand market dynamics across diverse economies—from mature markets like Japan to high-growth emerging markets—to benchmark performance and identify partnership and acquisition opportunities.
Frequently asked questions
What is the current size of the Asia Pacific lubricants market in 2025?
The Asia Pacific lubricants market is estimated at USD 67,343 million in 2025, representing a significant portion of global lubricant demand.
What is the projected size of the Asia Pacific lubricants market by 2030?
Asia Pacific's lubricants market is forecast to reach USD 79,249 million by 2030, reflecting steady regional growth.
What is the CAGR for the Asia Pacific lubricants market from 2025 to 2030?
The Asia Pacific lubricants market is expected to grow at a CAGR of 3.31% between 2025 and 2030.
Which industries drive lubricant demand in Asia Pacific?
Asia Pacific's lubricant demand is primarily driven by automotive, heavy machinery, manufacturing, and power generation sectors.
What trends are shaping the Asia Pacific lubricants market?
Key trends in Asia Pacific include the shift toward synthetic and bio-based lubricants, stricter environmental regulations, and increased industrial automation.
RESEARCH METHODOLOGY
The study involved four major activities in estimating the lubricants market size. Exhaustive secondary research was done to collect information on the market, the peer market, and the parent market. The next step was to validate these findings, assumptions, and sizing with industry experts across the value chain through primary research. Both top-down and bottom-up approaches were employed to estimate the complete market size. After that, the market breakdown and data triangulation procedures were used to estimate the market size of the segments and subsegments.
Secondary Research
Secondary sources used in this study included annual reports, press releases, and investor presentations of companies; white papers; certified publications; articles from recognized authors; and gold standard & silver standard websites such as Factiva, ICIS, Bloomberg, and others. The findings of this study were verified through primary research by conducting extensive interviews with key officials such as CEOs, VPs, directors, and other executives. The breakdown of profiles of the primary interviewees is illustrated in the figure below.
Primary Research
The lubricants market comprises several stakeholders, such as raw material suppliers, end-product manufacturers, and regulatory organizations in the supply chain. The demand side of this market is characterized by engine oil, turbine oil, gear oil, grease, hydraulic oil, compressor oil, metalworking fluid, and others. Advancements in technology and diverse application industries characterize the supply side. Various primary sources from the supply and demand sides of the market were interviewed to obtain qualitative and quantitative information.
Breakdown Of Primary Participants
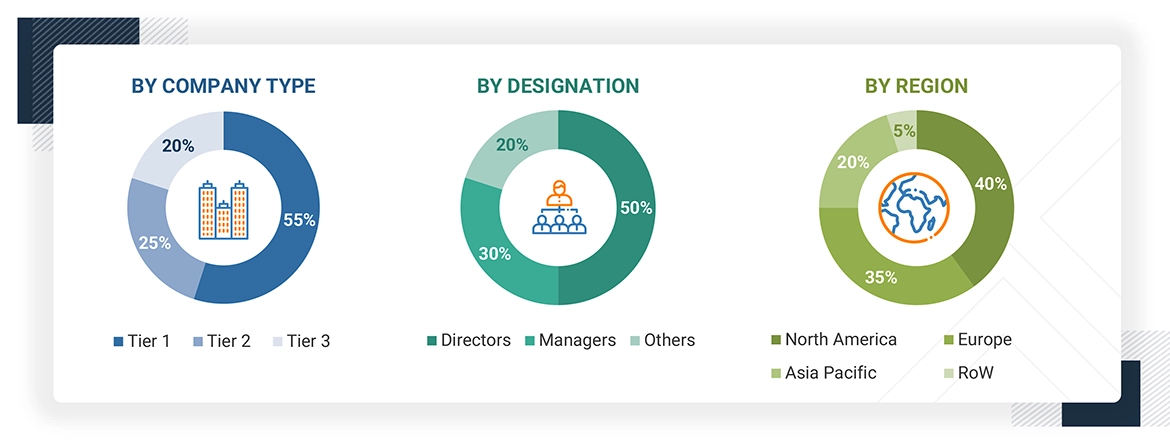
Note: Tier 1, Tier 2, and Tier 3 companies are classified based on their market revenue in 2023, available in the public domain, product portfolios, and geographical presence.
Other designations include consultants and sales, marketing, and procurement managers.
To know about the assumptions considered for the study, download the pdf brochure
| COMPANY NAME | DESIGNATION | |
|---|---|---|
| Exxon Mobil Corporation | Senior Manager | |
| Shell plc | Innovation Manager | |
| Indian Oil Corporation Limited | Vice-president | |
| BP p.l.c. | Production Supervisor | |
| Chevron Corporation | Sales Manager | |
Market Size Estimation
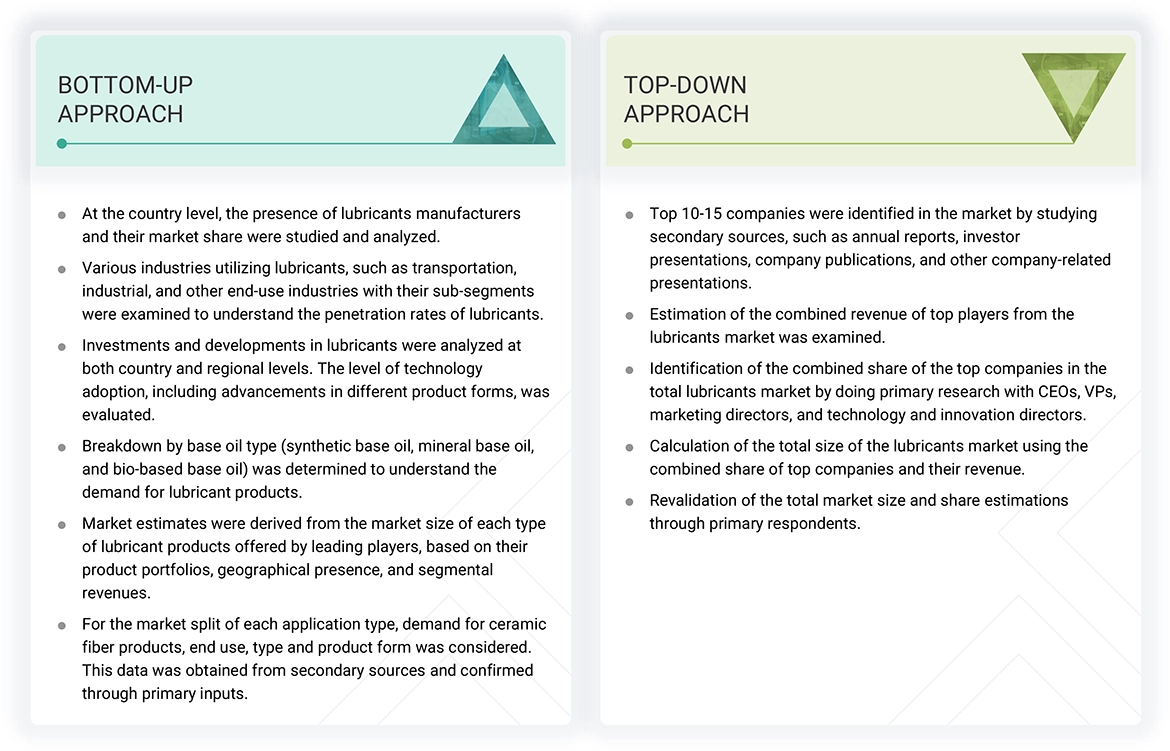
Top-down and bottom-up approaches were used to estimate and validate the total size of the lubricants market. These methods were also used extensively to estimate the size of various subsegments in the market. The research methodology used to estimate the market size includes the following parameters:
- The key players in the industry have been identified through extensive secondary research.
- The supply chain of the industry has been determined through primary and secondary research.
- All percentage shares, splits, and breakdowns have been determined using secondary sources and verified through primary sources.
- All possible parameters that affect the markets covered in this research study have been accounted for, viewed in extensive detail, verified through primary research, and analyzed to obtain the final quantitative and qualitative data.
Data Triangulation
After arriving at the overall market size—using the market size estimation processes as explained above—the market was split into several segments and subsegments. Data triangulation and market breakdown procedures were employed to complete the overall market engineering process and arrive at the exact statistics of each market segment and subsegment, wherever applicable. The data was triangulated by studying various factors and trends from both the demand and supply sides in the lubricants industry.
Market Definition
The lubricants market encompasses a range of substances engineered to diminish friction between surfaces, thereby reducing heat generation and facilitating the transmission of forces during movement. These substances also serve to transport foreign particles and regulate surface temperatures. Employed across diverse applications, from industrial machinery and cooking to bioapplications such as artificial joints, medical procedures, and intimate relations, lubricants are pivotal in mitigating friction, wear, heat generation, noise, and vibrations within mechanical systems.
Stakeholders
- Lubricants manufacturers
- Lubricants suppliers
- Raw material suppliers
- Service providers
- Application sector companies
- Government bodies
Report Objectives
- To define, describe, and forecast the lubricants market in terms of value and volume
- To provide detailed information regarding the drivers, opportunities, restraints, and challenges influencing market growth
- To estimate and forecast the market size by base oil type, product type, end-use industry, and region
- To forecast the size of the market for five main regions: Asia Pacific, Europe, North America, South America, and the Middle East & Africa, along with their key countries
- To strategically analyze micromarkets1 with respect to their growth trends, prospects, and contribution to the overall market
- To analyze opportunities in the market for stakeholders and provide a competitive landscape for market leaders
- To analyze competitive developments, such as deals and expansions, in the market
- To analyze the impact of the recession on the market
- To strategically profile key players and comprehensively analyze their growth strategies
Get the Full Lubricants Market Report
Full forecast, segment splits, and company analysis for all Lubricants Market.
- Rest Of Europe Lubricants Market
- Australia And New Zealand Lubricants Market
- Rest Of Asia Pacific Lubricants Market
- China Lubricants Market
- Japan Lubricants Market
- GCC Countries Lubricants Market
- –Rest Of GCC Countries Lubricants Market
- Rest Of South America Lubricants Market
- India Lubricants Market
- South Korea Lubricants Market
- Indonesia Lubricants Market
- Thailand Lubricants Market
- Germany Lubricants Market
- Russia Lubricants Market
- Italy Lubricants Market
- France Lubricants Market
- Spain Lubricants Market
- UK Lubricants Market
- Turkey Lubricants Market
- Canada Lubricants Market
- Mexico Lubricants Market
- US Lubricants Market
- Saudi Arabia Lubricants Market
- Iran Lubricants Market
- South Africa Lubricants Market
- Brazil Lubricants Market
- Argentina Lubricants Market
Need a Tailored Report?
Customize this report to your needs
Get 10% FREE Customization
Customize This Report
