
Asia Pacific Personalized Nutrition Market (2025-2030)

The Asia Pacific Personalized Nutrition Market was valued at $1971 Million in 2025 and projected to reach to $2683.9 Million by 2030, representing a compound annual growth rate of 16.4%. Asia Pacific's personalized nutrition market is positioned for accelerated growth through 2030, driven by increasing consumer awareness of preventive healthcare and the proliferation of digital health platforms.


| Market Size in | USD 26.32 MN |
| Market Forecast in | |
| CAGR | |
| Forecast Period | |
| Units Considered | Value (USD MN) |
Asia Pacific Personalized Nutrition Market Trends and Insights
- Asia Pacific's 16.4% compound annual growth rate significantly outpaces the global average of 14.4%, reflecting the region's accelerating adoption of tailored dietary solutions driven by rising health consciousness and digital health integration.
- Asia Pacific consumers increasingly leverage genomic testing, AI-powered nutrition apps, and wearable technology to optimize personalized dietary regimens. Asia Pacific's market growth is fueled by expanding middle-class populations, growing prevalence of lifestyle diseases, and increasing investment in precision health infrastructure across major economies.
- Asia Pacific's younger demographic demonstrates higher digital literacy and willingness to adopt personalized nutrition platforms compared to mature markets.
- The region's diverse regulatory environments and emerging direct-to-consumer channels create unique opportunities for innovation in customized supplement formulations and meal-planning services tailored to Asia Pacific's distinct nutritional preferences and health priorities..
Key Market Statistics
- CAGR (2025-2030) 16.4% CAGR
- Market Size, 2025 ~USD 1971 Million
- Forecast, 2030 ~USD 2683.9 Million
- Geography Asia Pacific
Asia Pacific Personalized Nutrition Market Overview
Outpacing Global Growth :
Asia Pacific's personalized nutrition market grows at 16.4% CAGR, significantly exceeding the global average of 14.4%, driven by rising health consciousness and digital health adoption across the region.
Substantial Market Expansion :
The market is valued at USD 1,971.0 million in 2025 and is projected to reach USD 2,683.9 million by 2030, representing a growth of USD 712.9 million over the five-year forecast period.
Japan Leads Regional Market :
Japan commands the largest market share in Asia Pacific with USD 946.7 million in 2025, followed by South Korea at USD 552.3 million, reflecting strong consumer demand for personalized dietary solutions.
Digital Health Integration :
Rising digital health infrastructure, mobile app adoption, and AI-driven nutritional assessment tools are accelerating personalized nutrition uptake across Asia Pacific markets, particularly in developed economies.
Asia Pacific Personalized Nutrition Market Dynamics
- The region's younger demographic, coupled with rising disposable incomes in emerging economies, creates substantial opportunities for tailored dietary solutions and nutrigenomics-based products. Key growth catalysts include expanding e-commerce channels, growing partnerships between tech companies and nutrition brands, and government initiatives promoting wellness.
- Countries like Japan, South Korea, and Australia lead adoption, while emerging markets in India and Southeast Asia present untapped potential.
- The convergence of personalized medicine, wearable technology, and nutritional science will continue to reshape consumer expectations and market dynamics throughout the forecast period..
Market Ecosystem
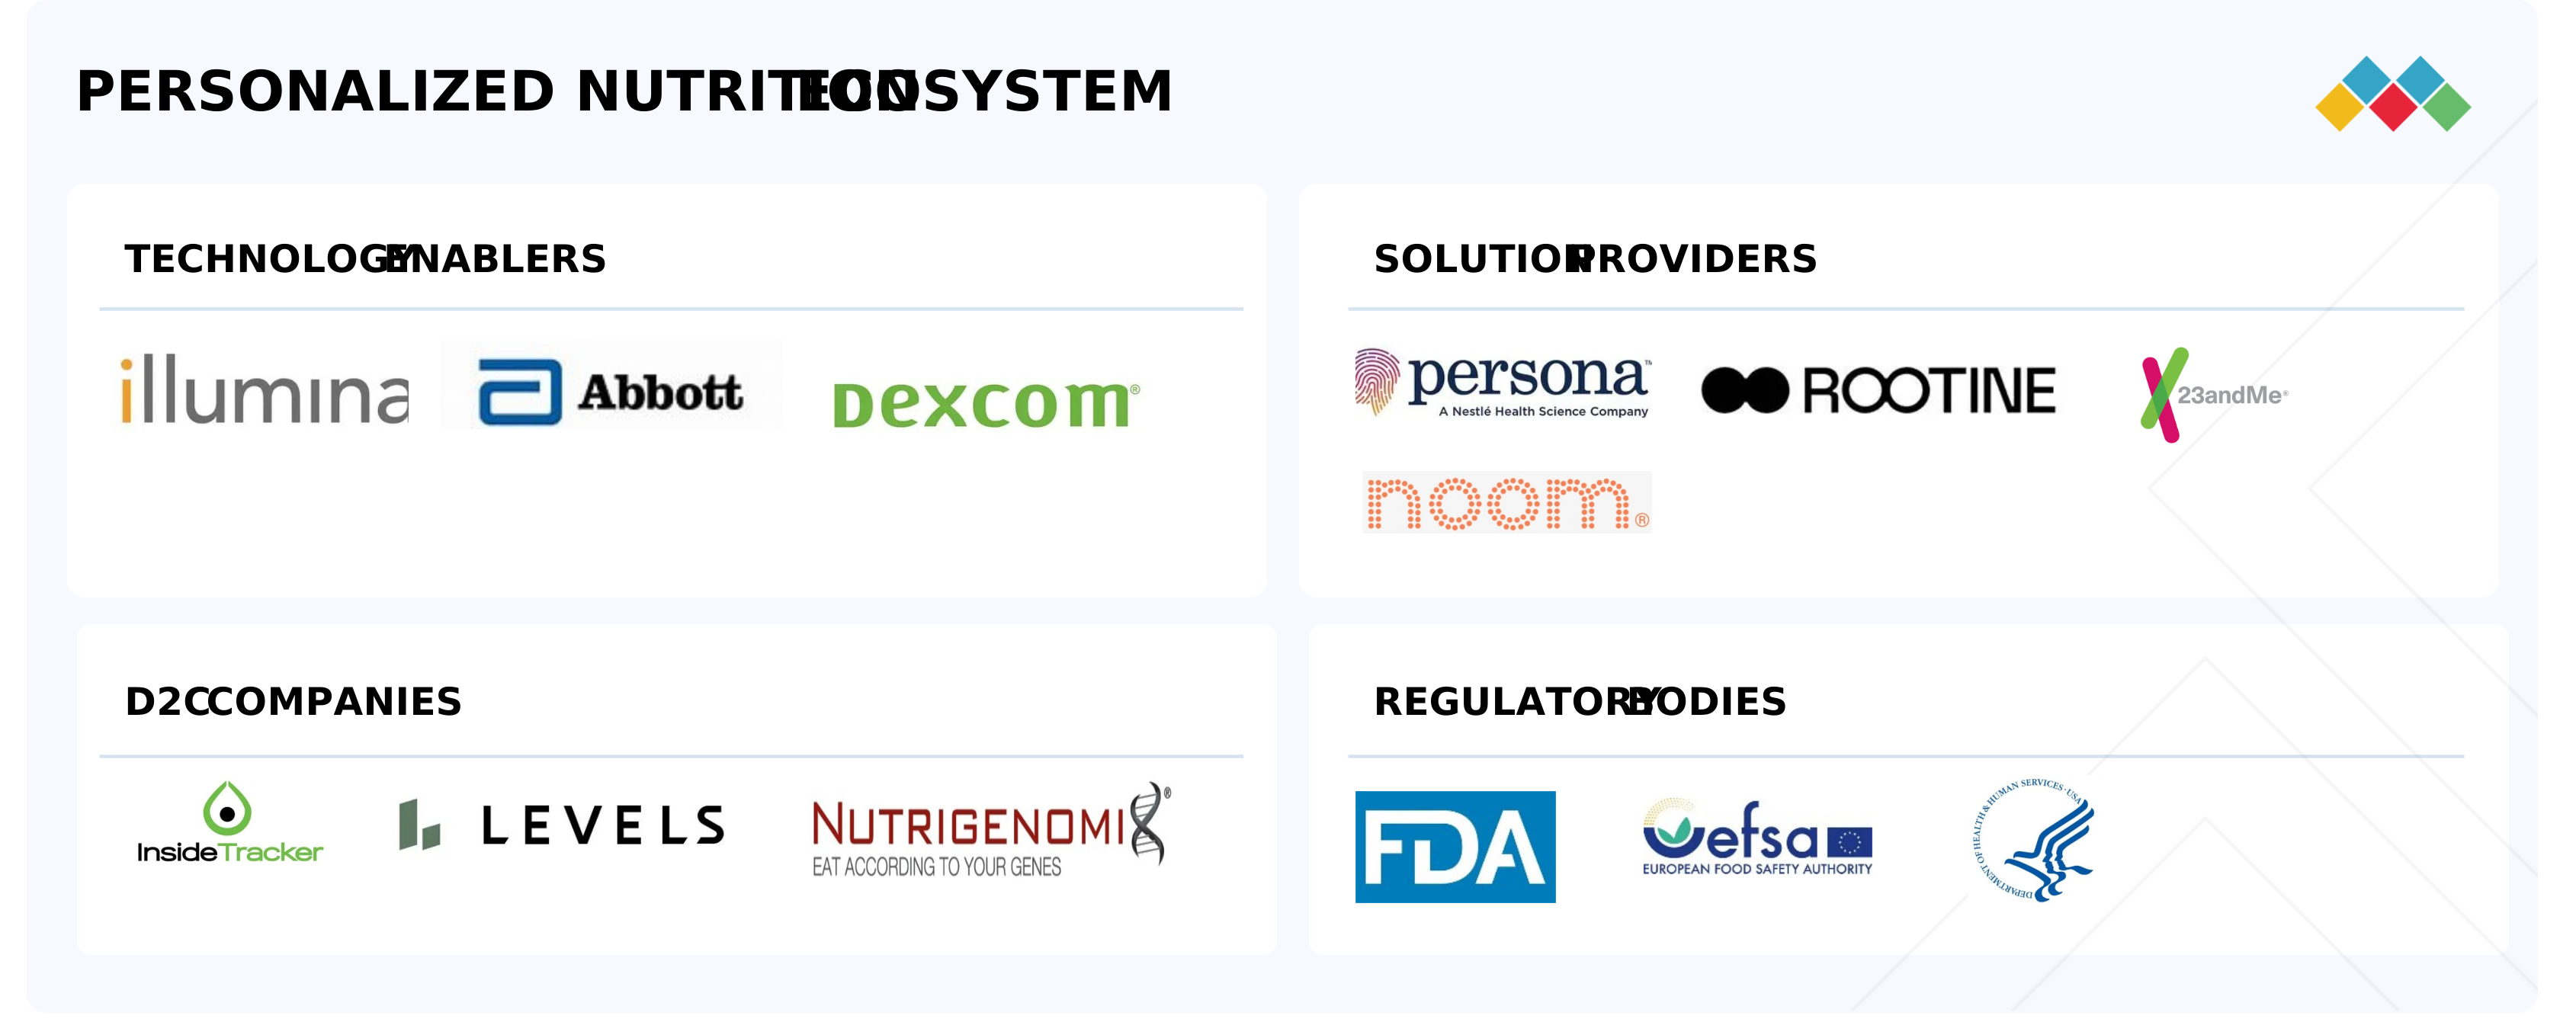
personalized nutrition market: COMMERCIAL USE CASES ACROSS INDUSTRIES
| COMPANY | USE CASE DESCRIPTION | BENEFITS |
|---|---|---|
 |
Continuous glucose monitoring (CGM) devices integrated with lifestyle apps (Libre, Lingo) for real-time nutrition feedback. | Enables personalized diet adjustments, improves metabolic health management, supports diabetes prevention, and broadens access to clinical-grade personalization. |
 |
Personalized supplement programs (Persona Nutrition) with digital profiling and subscription packs tailored to lifestyle and health needs. | Delivers convenient nutrition personalization, builds long-term customer loyalty, ensures science-backed formulations, and integrates into corporate wellness. |
 |
Microbiome, blood, and wearable data combined with AI-driven app for individualized diet guidance. | Provides evidence-based dietary personalization, enhances weight management outcomes, builds consumer trust via clinical trials, and scales engagement through subscriptions. |
 |
At-home microbiome and RNA sequencing tests linked to personalized supplement formulations and diet recommendations. | At-home microbiome and RNA sequencing tests linked to personalized supplement formulations and diet recommendations. |
Logos and trademarks shown above are the property of their respective owners. Their use here is for informational and illustrative purposes only.
Related Ecosystem
Fandb Ingredients
- Dairy Products
- Bakery Products
- Microorganism
- Polydextrose
- Carbohydrates
- AZELIS HOLDINGS SA
- Archer-Daniels-Midland Company
- Kerry Group plc
- Amway
- DSM FIRMMENICH
Key Takeaways
- Asia Pacific personalized nutrition market grows at 16.4% CAGR from 2025 to 2030, outpacing global growth of 14.4%.
- Market size in Asia Pacific expands from USD 1,971.0 million in 2025 to USD 2,683.9 million by 2030.
- Asia Pacific's digital-native consumers drive adoption of AI-powered nutrition apps, genomic testing, and wearable-integrated solutions.
- Rising lifestyle diseases and expanding middle-class populations in Asia Pacific create sustained demand for personalized dietary interventions.
Personalized Nutrition Market Report Scope
| Report Metric | Details |
|---|---|
| Base Year | 2025 |
| Fastest Growing Segment | TESTING KITS (Subtype) |
| Forecast Period | 2025–2030 |
| Growth Rate | CAGR of 14.4% from 2025 to 2030 |
| Largest Segment | ACTIVE MEASUREMENT (Product Type) |
| Market Size Base Year (Billions) | ~USD 15.79 (2025) |
| Revenue Forecast (Billions) | ~USD 30.94 (2030) |
| Segments Covered | Product Type, Subtype, Application, End Use, Form |
Asia Pacific Personalized Nutrition Market Report Segmentation
5 segment dimensions are covered across the global market.
By Product Type
- Active Measurement
- Standard Measurement
By Subtype
- Apps
- Health Nutrition
- Inherited
- Lifestyle
- Programs
- Sports Nutrition
- Testing Kits
By Application
- Disease-Based
- Standard Supplements
By End Use
- Direct-To-Consumer
- Hospitals & Clinics
- Institutions
- Wellness & Fitness Centers
By Form
- Capsules
- Liquid
- Other Forms
- Powder
- Tablets
Target Audience
- Nutrition & Wellness Companies : Develop regional expansion strategies and product portfolios tailored to Asia Pacific consumer preferences, market gaps, and growth trajectories in personalized nutrition.
- Digital Health & Tech Platforms : Understand integration opportunities with personalized nutrition services, AI-driven assessment tools, and wearable technology adoption across Asia Pacific markets.
- Investment & Private Equity Firms : Evaluate investment opportunities in high-growth Asia Pacific personalized nutrition companies and identify acquisition targets with strong regional market positioning.
- Food & Beverage Manufacturers : Assess market demand for customized nutritional products, functional foods, and personalized supplement solutions across Asia Pacific consumer segments.
- Healthcare & Wellness Retailers : Optimize product assortment, merchandising strategies, and omnichannel approaches to capitalize on growing consumer demand for personalized nutrition solutions in Asia Pacific.
Key Companies in the Asia Pacific Personalized Nutrition Market
| Company | HQ | Ownership | Strongest segments |
|---|---|---|---|
| BACTOLAC PHARMACEUTICAL INC | United States | Private Company | Vitamins & Multivitamins,Probiotics & Digestive Health,Sports Nutrition & Creatine Products, |
| PERSONA COMPANY | United States | Public Company | Oncology MRD and monitoring (NeXT Personal / NeXT Personal Dx),Comprehensive tissue profiling (ImmunoID NeXT / NeXT Dx),Pharma and diagnostics WES/WGS services, |
| AZELIS HOLDINGS SA | Belgium | Private Company | Life Sciences (food, nutrition, pharma, personal and home care),Industrial Specialties (coatings, plastics, lubricants, advanced materials), |
BACTOLAC PHARMACEUTICAL INC
Bactolac Pharmaceutical Inc is a United States-based private pharmaceutical company founded in 1995 with 126 employees.
PERSONA COMPANY
Persona Company is a United States-based public company founded in 2011 with 260 employees.
AZELIS HOLDINGS SA
Azelis Holdings SA is a Belgium-based private company founded in 2001 with 1,325 employees operating in the specialty chemicals sector.
Countries within Asia Pacific - compare and drill down
| Country | 2025 size (native) |
|---|---|
| China | USD 364.7 Million |
| Japan | USD 946.7 Million |
| South Korea | USD 552.3 Million |
| Australia | USD 720.3 Million |
| India | USD 289.3 Million |
| Rest Of Apac | USD 556.8 Million |
Country market size visualization
Reasons to Buy this Report
- Regional Growth Opportunity : Capture insights into Asia Pacific's fastest-growing personalized nutrition segment with 16.4% CAGR, outpacing global markets and offering superior investment and expansion opportunities.
- Country-Level Market Intelligence : Access detailed market sizing for key Asia Pacific markets including Japan (USD 946.7M), South Korea (USD 552.3M), Australia (USD 720.3M), and emerging markets like India and China.
- Competitive Positioning Strategy : Understand regional market dynamics, consumer preferences, and digital health adoption patterns to develop targeted go-to-market strategies and competitive advantages in Asia Pacific.
- Forecast-Driven Planning : Leverage five-year market projections (2025-2030) to inform product development, partnership strategies, and resource allocation decisions across Asia Pacific territories.
- Emerging Market Potential : Identify high-growth opportunities in underpenetrated markets within Asia Pacific, including India and Southeast Asia, where personalized nutrition adoption is accelerating rapidly.
Frequently asked questions
What is the current size of the personalized nutrition market in Asia Pacific?
The Asia Pacific personalized nutrition market is valued at USD 1,971.0 million in 2025 and is projected to grow to USD 2,683.9 million by 2030.
What is the growth rate of the personalized nutrition market in Asia Pacific?
Asia Pacific's personalized nutrition market is growing at a compound annual growth rate (CAGR) of 16.4% from 2025 to 2030, exceeding the global CAGR of 14.4%.
What are the primary drivers of growth in Asia Pacific's personalized nutrition market?
Key drivers include rising health consciousness, expanding middle-class populations, increasing prevalence of lifestyle diseases, digital health adoption, and investment in precision health infrastructure across Asia Pacific.
Which technologies are shaping the personalized nutrition market in Asia Pacific?
Asia Pacific consumers increasingly adopt genomic testing, AI-powered nutrition applications, wearable health devices, and mobile platforms that enable data-driven dietary personalization.
How does Asia Pacific's market growth compare to global trends?
Asia Pacific's 16.4% CAGR outpaces the global average of 14.4%, driven by younger demographics, higher digital adoption rates, and emerging market expansion in the region.
RESEARCH METHODOLOGY
The study involved two major approaches in estimating the current size of the personalized-nutrition-market. Exhaustive secondary research was done to collect information on the market, peer, and parent markets. The next step was to validate these findings, assumptions, and sizing with industry experts across the value chain through primary research. Both top-down and bottom-up approaches were employed to estimate the complete market size. After that, market breakdown and data triangulation were used to estimate the market size of segments and subsegments.
Secondary Research
This research study involved the extensive use of secondary sources—directories and databases such as Bloomberg Businessweek and Factiva—to identify and collect information useful for a technical, market-oriented, and commercial study of the market.
In the secondary research process, various sources such as annual reports, press releases & investor presentations of companies, white papers, food journals, certified publications, articles from recognized authors, directories, and databases were referred to to identify and collect information.
Secondary research was mainly used to obtain key information about the industry’s supply chain, the total pool of key players, and market classification and segmentation as per the industry trends to the bottom-most level, regional markets, and key developments from both market- and technology-oriented perspectives.
Primary Research
Extensive primary research was conducted after obtaining information regarding the personalized-nutrition-market scenario through secondary research. Several primary interviews were conducted with market experts from both the demand and supply sides across major countries of North America, Europe, Asia Pacific, South America, and the Rest of the World. Primary data was collected through questionnaires, emails, and telephonic interviews. The primary sources from the supply side included various industry experts, such as Chief X Officers (CXOs), Vice Presidents (VPs), Directors from business development, marketing, research, and development teams, and related key executives from distributors and key opinion leaders. Primary interviews were conducted to gather insights, including market statistics, revenue data from products and services, market breakdowns, market size estimations, market forecasting, and data triangulation. Primary research also helped in understanding the various trends related to personalized nutrition products, end-use, type, personalization basis, application, and region. Stakeholders from the demand side, such as end-users, were interviewed to understand the buyer’s perspective on the suppliers, products, their current usage of personalized nutrition products & services, and the outlook of their business, which will affect the overall market.
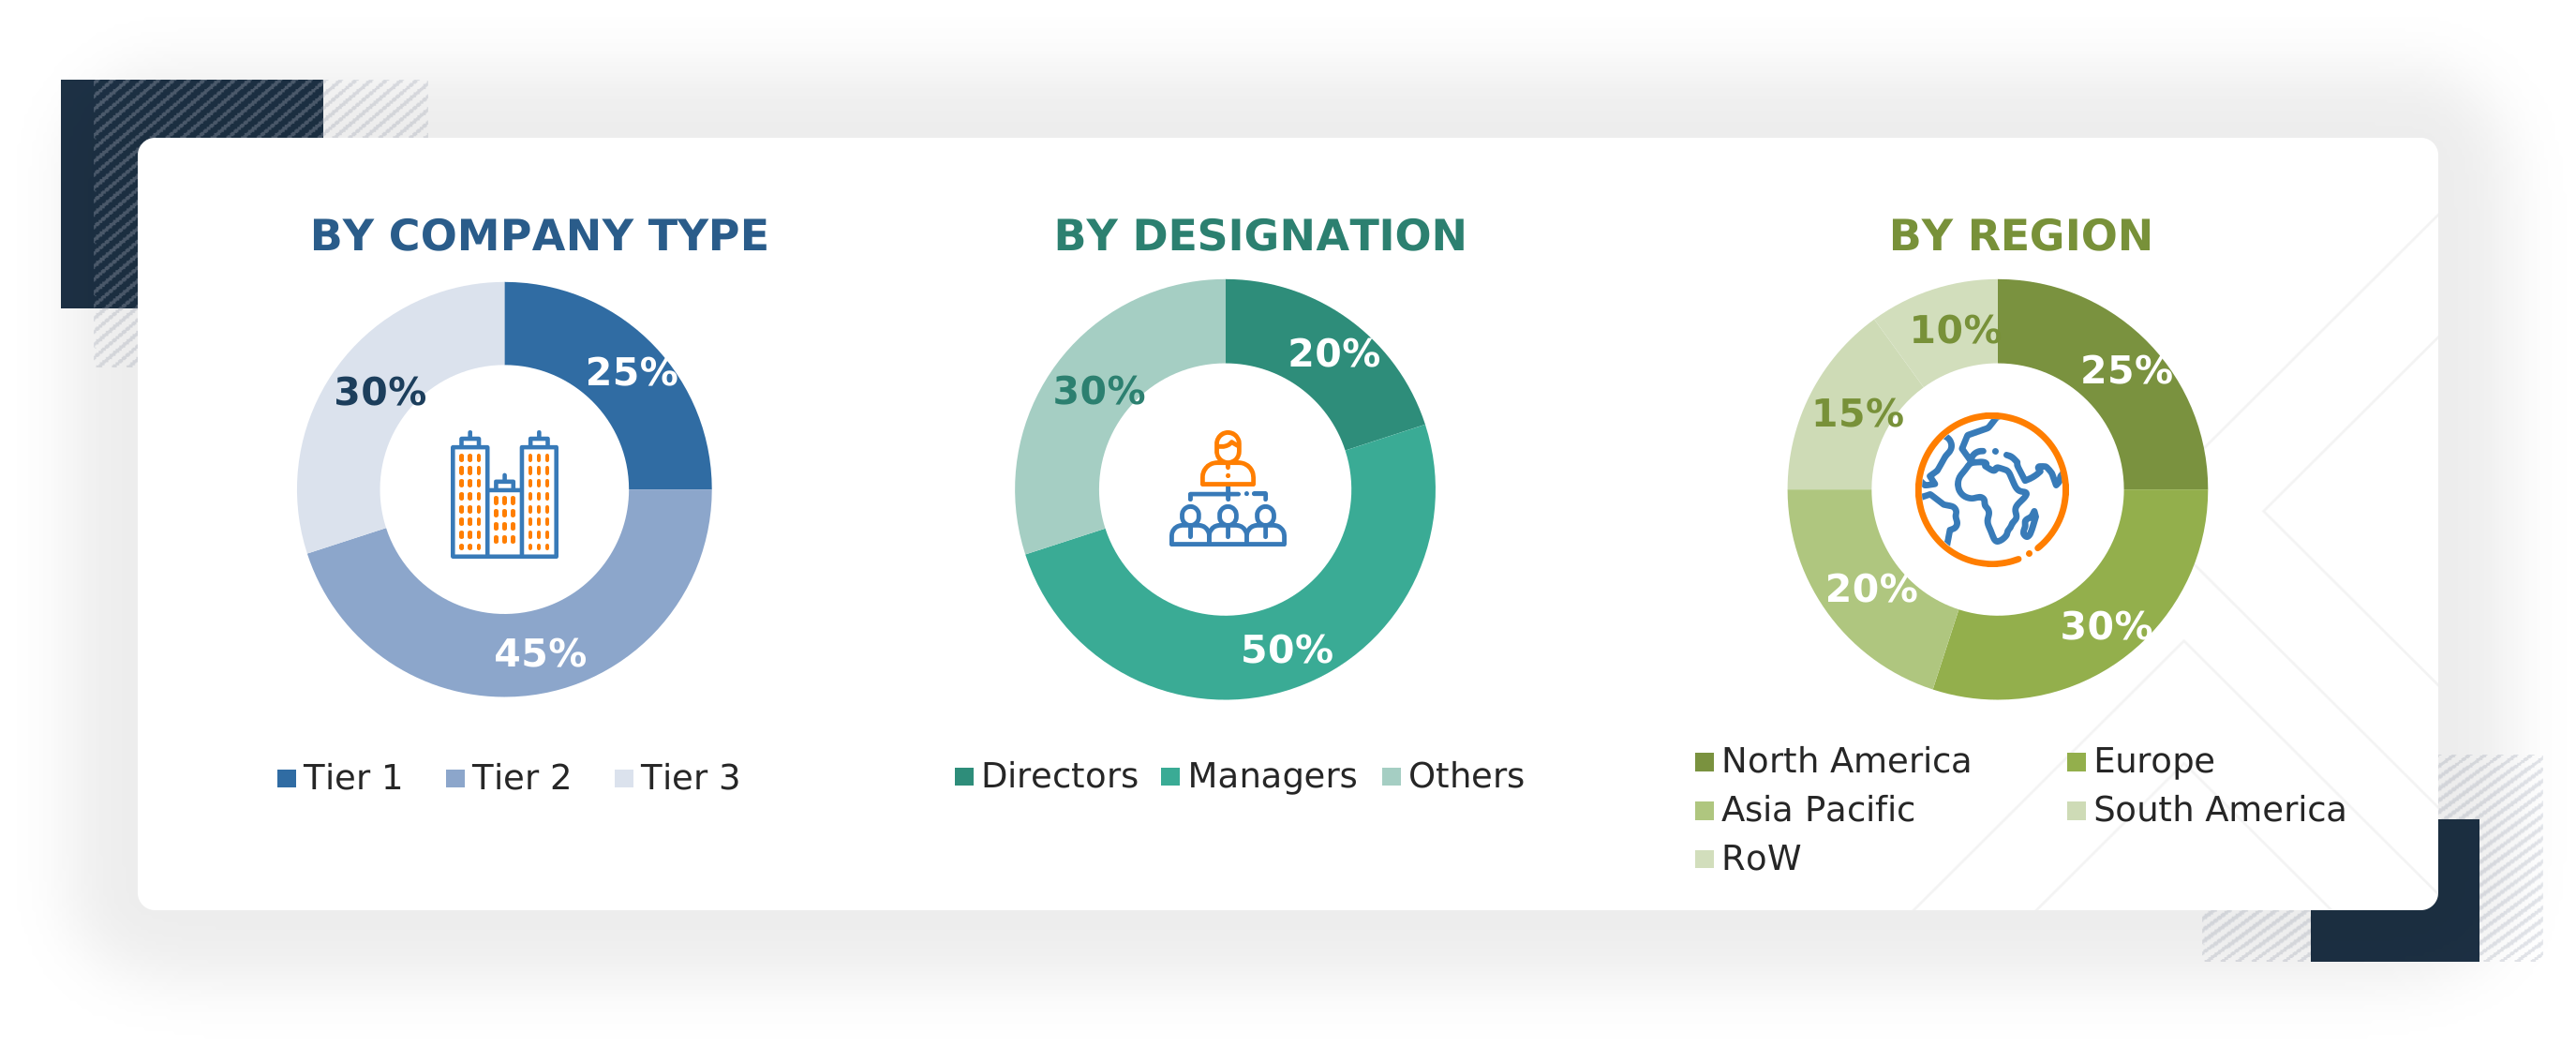
Note: The three tiers of the companies are defined based on their total revenues in 2023 or 2024,
as per the availability of financial data: Tier 1: Revenue >USD 1 billion; Tier 2: USD 100 million = Revenue = USD 1 billion;
Tier 3: Revenue
To know about the assumptions considered for the study, download the pdf brochure
|
COMPANY |
DESIGNATION |
|
Zoe (UK) |
General Manager |
|
Nestle Health Science (New Zealand) |
Sales Manager |
|
Abott (US) |
Manager |
|
Seed Health(US) |
Head of Processing Department |
|
Suggestic (US) |
Marketing Manager |
|
Viome (US) |
Sales Executive |
Market Size Estimation
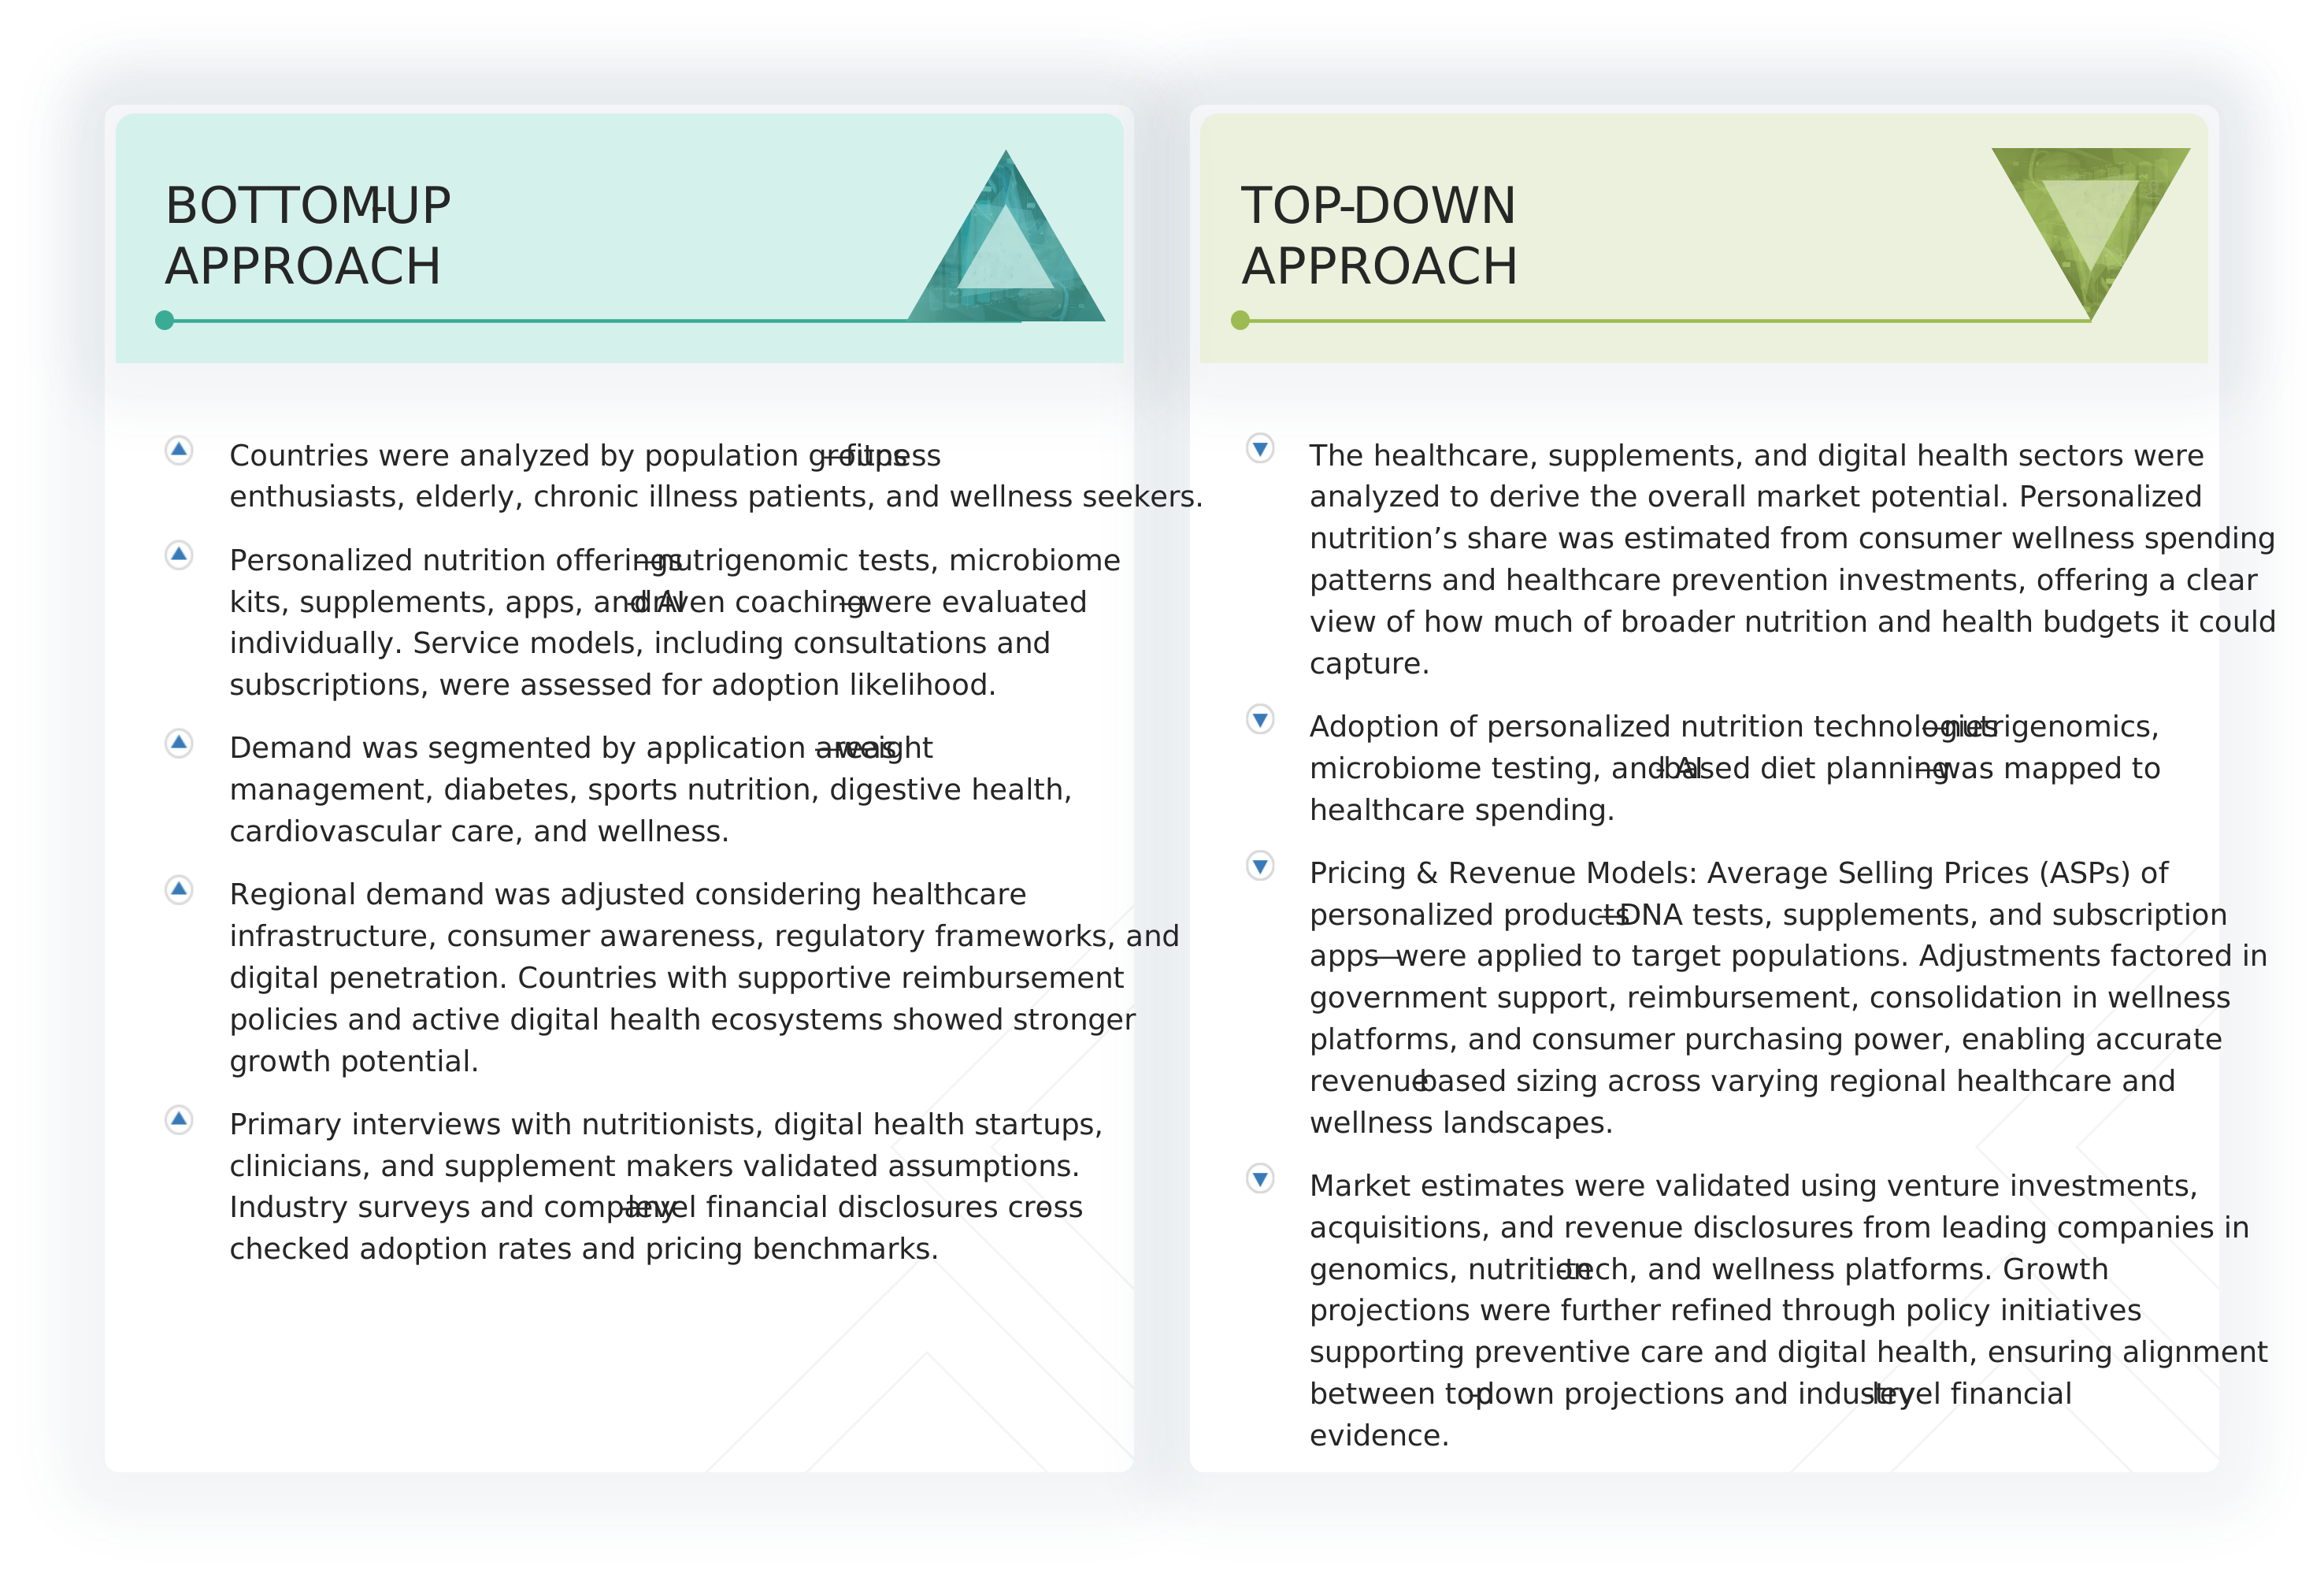
Both the top-down and bottom-up approaches were used to estimate and validate the total size of the personalized nutrition market. These approaches were also used extensively to determine the size of various subsegments in the market. The research methodology used to estimate the market size includes the following details:
- The key players in the industry and the overall markets were identified through extensive secondary research.
- All shares, splits, and breakdowns were determined using secondary sources and verified through primary sources.
- All possible parameters that affect the market covered in this research study were accounted for, viewed in extensive detail, verified through primary research, and analyzed to obtain final quantitative and qualitative data.
- The research included the study of reports, reviews, and newsletters of top market players, along with extensive interviews for opinions from leaders, such as CEOs, directors, and marketing executives.
personalized-nutrition-market : Top-Down and Bottom-Up Approach
Data Triangulation
After arriving at the overall market size from the estimation process explained above, the total market was split into several segments and subsegments. The data triangulation and market breakdown procedures were employed, wherever applicable, to estimate the overall personalized nutrition market and arrive at the exact statistics for all segments and subsegments. The data was triangulated by studying various factors and trends from the demand and supply sides. The market size was also validated using both the top-down and bottom-up approaches.
Market Definition
Personalized nutrition (PN) represents an approach aimed at delivering tailored dietary recommendations, products, or services to support both prevention and treatment of nutrition-related conditions and to improve individual health using genetic, phenotypic, medical, nutritional, and other pertinent information. Technically, personalized nutrition associates with an individual’s genetic, medical, nutritional, phenotypic, metabolic, biochemistry, and other information to produce healthy eating options as per his/her needs. Personalized nutrition is beneficial for both patients and healthy individuals.
Stakeholders
- Technology & Diagnostics Providers
- Personalized supplement manufacturers
- Functional food & beverage companies
- Digital Platforms & Service Providers
- Healthcare & Wellness Ecosystem
- Market research and consulting firms
- Intellectual property vendors
- Pharmaceutical & biotech companies
- Research institutions & universities
- Government & regulatory bodies (FDA, EFSA, regional health agencies setting safety and labeling standards)
Report Objectives
- To determine and project the size of the personalized nutrition market based on product, end-use, type, personalization basis, application, and region in terms of value over five years, ranging from 2025 to 2030
- To identify the attractive opportunities in the market by determining the largest and fastest-growing segments across regions
- To provide detailed information about the key factors influencing market growth (drivers, restraints, opportunities, and challenges)
- To analyze the opportunities in the market for stakeholders and provide details of the competitive landscape for market leaders
- To analyze the micro-markets with respect to individual growth trends, prospects, and their contribution to the total market
- To identify and profile the key players in the personalized nutrition market
- To understand the competitive landscape and identify the major growth strategies adopted by players across the key regions
Available Customizations
With the given market data, MarketsandMarkets offers customizations according to company-specific scientific needs. The following customization options are available for the report:
Product Analysis
- Product Matrix, which gives a detailed comparison of the product portfolio of each company.
Geographic Analysis as per Feasibility
With the given market data, MarketsandMarkets offers customizations according to company-specific scientific needs.
- Further breakdown of the Rest of Europe personalized nutrition market into key countries.
- Further breakdown of the Rest of Asia Pacific personalized nutrition market into key countries.
- Further breakdown of the Rest of South America personalized nutrition market into key countries.
Company Information
- Detailed analyses and profiling of additional market players (up to five)
Get the Full Personalized Nutrition Market Report
Full forecast, segment splits, and company analysis for all Personalized Nutrition Market.
- US Personalized Nutrition Market
- Canada Personalized Nutrition Market
- Mexico Personalized Nutrition Market
- Germany Personalized Nutrition Market
- France Personalized Nutrition Market
- UK Personalized Nutrition Market
- Italy Personalized Nutrition Market
- Spain Personalized Nutrition Market
- China Personalized Nutrition Market
- Japan Personalized Nutrition Market
- South Korea Personalized Nutrition Market
- Australia Personalized Nutrition Market
- India Personalized Nutrition Market
- Rest Of Europe Personalized Nutrition Market
- Rest Of Apac Personalized Nutrition Market
Need a Tailored Report?
Customize this report to your needs
Get 10% FREE Customization
Customize This Report
