
Japan Proximity Sensor Market (2025-2030)

The Japan Proximity Sensor Market was valued at $391.9 Million in 2025 and projected to reach to $563.9 Million by 2030, representing a compound annual growth rate of 7.5%. Japan's proximity sensor market is poised for sustained growth through 2030, driven by the country's leadership in automotive electrification, robotics, and smart consumer devices.


| Market Size in | USD 26.32 MN |
| Market Forecast in | |
| CAGR | |
| Forecast Period | |
| Units Considered | Value (USD MN) |
Japan Proximity Sensor Market Trends and Insights
- Japan's advanced manufacturing ecosystem and leadership in automotive and consumer electronics drive strong demand for proximity sensing technologies.
- The market in Japan benefits from the country's robust semiconductor industry and increasing adoption of automation across industrial and retail sectors..
Key Market Statistics
- CAGR (2025-2030) 7.5% CAGR
- Market Size, 2025 ~USD 391.9 Million
- Forecast, 2030 ~USD 563.9 Million
- Country Japan
Japan Proximity Sensor Market Overview
Market Valuation :
Japan's proximity sensor market is valued at USD 391.9 million in 2025, with projections reaching USD 563.9 million by 2030, demonstrating robust growth potential in the region.
Strong CAGR Performance :
Japan's proximity sensor market is growing at a CAGR of 7.5%, outpacing the global average of 6.9%, reflecting the country's technological advancement and industrial demand.
Automotive & Electronics Leadership :
Japan's advanced manufacturing ecosystem and dominance in automotive and consumer electronics sectors drive significant demand for proximity sensing technologies across multiple applications.
Semiconductor Excellence :
Japan's robust semiconductor infrastructure and innovation capabilities position it as a key hub for proximity sensor development, manufacturing, and deployment in Asia-Pacific.
Japan Proximity Sensor Market Dynamics
- The integration of proximity sensors in autonomous vehicles, industrial automation, and IoT applications continues to expand market opportunities.
- Japan's commitment to Industry 4.0 and advanced manufacturing technologies further accelerates adoption across sectors.
- With a CAGR of 7.5%, the market reflects strong domestic demand and export potential, supported by major electronics and automotive manufacturers investing in sensor innovation and miniaturization technologies..
Market Ecosystem
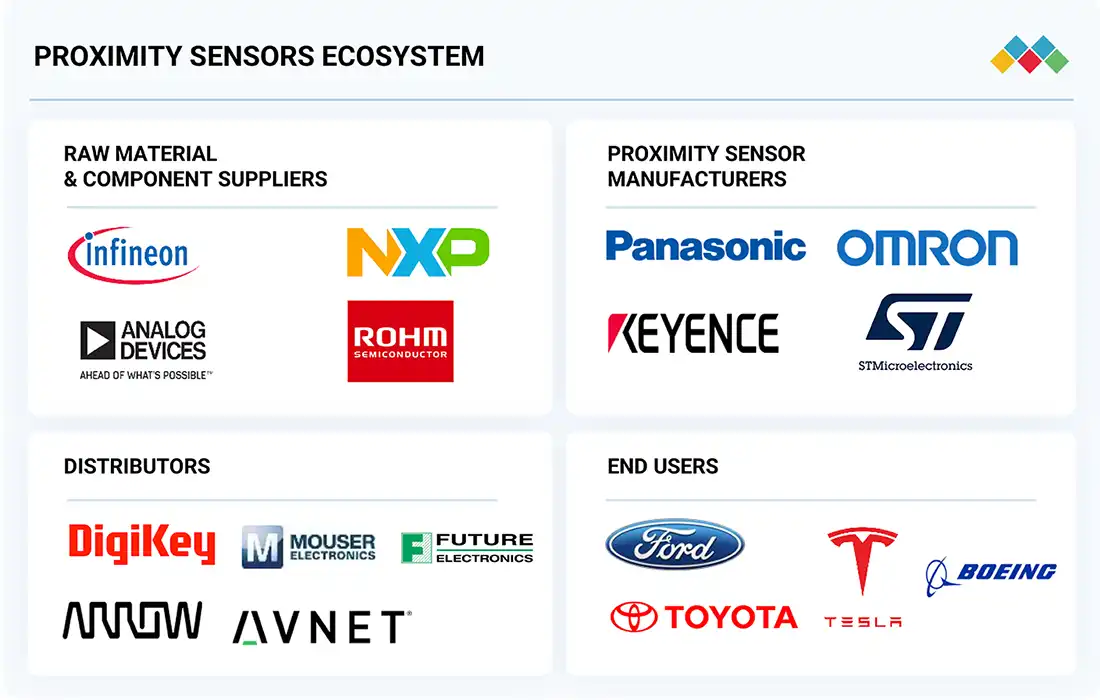
Proximity Sensor Market: COMMERCIAL USE CASES ACROSS INDUSTRIES
| COMPANY | USE CASE DESCRIPTION | BENEFITS |
|---|---|---|
 |
Proximity sensors for industrial automation systems, including assembly lines and robotics | Reliable non-contact object detection, improved safety, reduced downtime, enhanced production efficiency |
 |
High-precision proximity sensors for electronics and semiconductor manufacturing | Micron-level detection accuracy, faster inspection, higher yield rates, reduced defect rates |
 |
Compact proximity sensors integrated into consumer electronics and automotive applications | Miniaturized design, low-power consumption, seamless integration, enhanced user experience |
 |
Proximity sensors for logistics, packaging, and safety systems in smart factories | Accurate detection in harsh environments, improved machine safety, reduced operational errors, higher throughput |
 |
Proximity sensors for smartphones, IoT devices, and wearables | Low-power operation, gesture recognition, space-saving design, enhanced device interactivity and battery efficiency |
Logos and trademarks shown above are the property of their respective owners. Their use here is for informational and illustrative purposes only.
Related Ecosystem
Automotive Systems
- Light Commercial Vehicles (LCVs)
- Battery Electric Vehicle (BEV)
- Hybrid Electric Vehicle (HEV)
- Agricultural Tractors
- Fuel Cell Electric Vehicle (FCEV)
- BOSCH LIMITED
- DENSO Corporation
- ZF FRIEDRICHSHAFEN AG
- Continental ag
- GORKOVSKY AVTOMOBILNY ZAVOD
Information System And Analytics
- Machine Learning
- Natural Language Processing (NLP)
- Sensors
- Software as A Service (SaaS)
- Data Loss Prevention (DLP)
- International Business Machines Corporation
- MICROSOFT CORPORATION
- Amazon.com, Inc.
- Oracle Corporation
Sensors And Control
- Sensors
- Image Sensors
- Temperature Sensors
- Pressure Sensors
- Flow Sensors
- BAUMER ELECTRIC AG
- HONEYWELL INTERNATIONAL INC.
- Lenovo
- Stmicroelectronics
- Texas Instruments Incorporated
Key Takeaways
- Japan's proximity sensor market is estimated at USD 391.9 million in 2025 and will reach USD 563.9 million by 2030.
- Japan demonstrates a 7.5% CAGR, outpacing the global average of 6.9%, reflecting strong regional demand.
- Japan's automotive and consumer electronics sectors are primary growth drivers for proximity sensor adoption.
- Japan's advanced manufacturing capabilities position it as a key hub for proximity sensor innovation and production.
Proximity Sensor Market Report Scope
| Report Metric | Details |
|---|---|
| Base Year | 2025 |
| Fastest Growing Segment | ULTRASONIC (Technology) |
| Forecast Period | 2025-2030 |
| Growth Rate | CAGR of 6.9% from 2025 to 2030 |
| Largest Segment | FIXED DISTANCE (Product Type) |
| Market Size Base Year (Billions) | ~USD 4.28 (2025) |
| Revenue Forecast (Billions) | ~USD 5.97 (2030) |
| Segments Covered | Technology, End-Use Industry, Product Type, Range, Output |
Japan Proximity Sensor Market Report Segmentation
5 segment dimensions are covered across the global market.
By Technology
- Capacitive
- Inductive
- Magnetic
- Other Technologies
- Photoelectric/Optical
- Ultrasonic
By End-Use Industry
- Aerospace & Defense
- Automotive
- Building Automation
- Consumer Electronics
- Manufacturing
- Other End-Use Industries
- Pharmaceuticals
By Product Type
- Adjustable Distance
- Fixed Distance
By Range
- 10-20 Mm
- 21-40 Mm
- <10 Mm
- >40 Mm
By Output
- Analog
- Digital
JAPAN: PROXIMITY SENSOR MARKET, BY END-USE INDUSTRY, 2025–2030
| Segment | 2025 | 2026 | 2027 | 2028 | 2029 | 2030 | CAGR (%) |
|---|---|---|---|---|---|---|---|
| AEROSPACE & DEFENSE | 12.2 | 12.7 | 13.2 | 13.8 | 14.5 | 15.2 | 4.5 |
| AUTOMOTIVE | 140.4 | 152.1 | 165.4 | 180.7 | 197.9 | 217.1 | 9.1 |
| BUILDING AUTOMATION | 32.6 | 35.3 | 38.3 | 41.8 | 45.8 | 50.2 | 9 |
| CONSUMER ELECTRONICS | 60.1 | 63.8 | 68.1 | 73 | 78.5 | 84.6 | 7.1 |
| MANUFACTURING | 79.9 | 84.9 | 90.5 | 97 | 104.2 | 112.2 | 7 |
| OTHER END-USE INDUSTRIES | 39.6 | 41.1 | 42.8 | 44.7 | 46.8 | 49.1 | 4.4 |
| PHARMACEUTICALS | 27 | 28.3 | 29.8 | 31.5 | 33.4 | 35.5 | 5.7 |
| TOTAL | 391.9 | 418.1 | 448.2 | 482.7 | 521.2 | 563.9 | 7.5 |
Target Audience
- Automotive OEMs & Suppliers : Japanese and international automotive manufacturers need Japan-specific proximity sensor market data to optimize supply chain strategies, component sourcing, and technology roadmaps for vehicle electrification.
- Electronics & Consumer Device Manufacturers : Consumer electronics companies operating in Japan require detailed market insights to guide product development, sensor integration strategies, and competitive positioning in smartphones, wearables, and smart home devices.
- Semiconductor & Sensor Manufacturers : Proximity sensor and semiconductor producers need Japan market analysis to assess growth opportunities, competitive landscape, pricing strategies, and manufacturing capacity planning in this advanced market.
- Industrial Automation & Robotics Companies : Automation and robotics firms targeting Japan's Industry 4.0 initiatives require market data to understand sensor demand trends, application opportunities, and integration requirements in manufacturing environments.
- Investment & Strategy Consultants : Private equity, venture capital, and management consulting firms need Japan proximity sensor market intelligence to evaluate investment opportunities, support due diligence, and develop market entry strategies.
Reasons to Buy this Report
- Japan-Specific Market Sizing : Access precise valuation data for Japan's proximity sensor market with verified 2025 baseline (USD 391.9M) and 2030 forecasts, enabling accurate regional business planning and investment decisions.
- Competitive Regional Insights : Understand Japan's 7.5% CAGR advantage over global 6.9% growth, identifying why the Japanese market outperforms and what competitive advantages drive this premium growth trajectory.
- Automotive & Manufacturing Focus : Gain deep insights into Japan's automotive and consumer electronics sectors—the primary demand drivers—with actionable intelligence for targeting OEMs, Tier-1 suppliers, and manufacturing partners.
- Strategic Market Entry Planning : Develop Japan-specific go-to-market strategies with comprehensive data on market dynamics, growth drivers, and sector-specific opportunities in this high-value semiconductor market.
- Investment & Partnership Opportunities : Identify high-growth segments and partnership potential within Japan's advanced manufacturing ecosystem, supporting M&A, joint ventures, and technology collaboration decisions.
Frequently asked questions
What is the current size of Japan's proximity sensor market?
Japan's proximity sensor market is valued at USD 391.9 million in 2025.
What is the projected market size for Japan by 2030?
Japan's proximity sensor market is forecast to reach USD 563.9 million by 2030.
What is the CAGR for Japan's proximity sensor market?
Japan's proximity sensor market is expected to grow at a CAGR of 7.5% from 2025 to 2030.
Which industries drive proximity sensor demand in Japan?
Japan's automotive, consumer electronics, industrial automation, and retail sectors are primary drivers of proximity sensor adoption.
How does Japan's market growth compare to global trends?
Japan's 7.5% CAGR exceeds the global average of 6.9%, indicating stronger regional market momentum.
RESEARCH METHODOLOGY
The study involved major activities in estimating the current size of the proximity sensors market. Exhaustive secondary research was done to collect information on proximity sensors. The next step was to validate these findings, assumptions, and sizing with industry experts across the value chain using primary research. Different approaches, such as top-down and bottom-up, were employed to estimate the total market size. After that, the market breakup and data triangulation procedures were used to estimate the market size of the segments and subsegments of the proximity sensors.
Secondary Research
In the secondary research process, various secondary sources were used to identify and collect information for this study. These include annual reports, press releases, and investor presentations of companies, white papers, certified publications, and articles from recognized associations and government publishing sources. Research reports from a few consortia and councils were also consulted to structure qualitative content.
Secondary sources included corporate filings (annual reports, investor presentations, and financial statements); trade, business, and professional associations; white papers; robotics journals and certified publications; articles by recognized authors; gold-standard and silver-standard websites; directories; and databases. Data was also collected from secondary sources, such as the Association for Advancing Automation (A3), the International Electrotechnical Commission (IEC), and the International Organization of Motor Vehicle Manufacturers (OICA).
Secondary research has been mainly used to obtain important information about the industry's value chain, the market's monetary chain, the overall pool of key players, market classification and segmentation according to industry trends to the bottom-most level, regional markets, and key developments from market- and technology-oriented perspectives.
Primary Research
Primary research was conducted to identify segmentation types, industry trends, and key players in the market and analyze the competitive landscape; key market dynamics, such as drivers, restraints, challenges, and opportunities; industry trends; and key player strategies. In the complete market engineering process, top-down and bottom-up approaches were extensively used, along with several data triangulation methods, to estimate and forecast the market sizes, as well as their segments and sub-segments, as listed in this report. Extensive qualitative and quantitative analysis was conducted on the complete market engineering process to list the key information and insights throughout the report.
Extensive primary research was conducted after understanding and analyzing the proximity sensor market scenario through secondary research. Several primary interviews were conducted with key opinion leaders from demand- and supply-side vendors across four major regions—North America, Europe, Asia Pacific, and RoW. Approximately 30% of the primary interviews were conducted with the demand side and 70% with the supply side. Primary data was collected through questionnaires, emails, and telephonic interviews. Various departments within organizations, such as sales, operations, and administration, were contacted to provide a holistic viewpoint in the report.
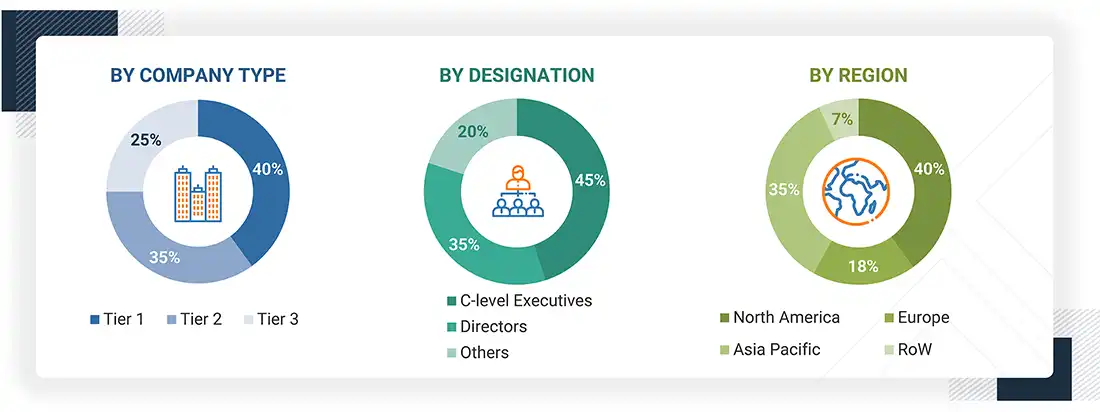
Notes: Other designations include sales & marketing executives, and researchers
Note: The three tiers of companies are based on their total revenue as of 2024: Tier 1 - equal to or more than USD 1,000 million; Tier 2 - between USD 500 million and USD 1,000 million; and Tier 3 - less than or equal to USD 500 million. Other designations include managers and academicians.
To know about the assumptions considered for the study, download the pdf brochure
Market Size Estimation
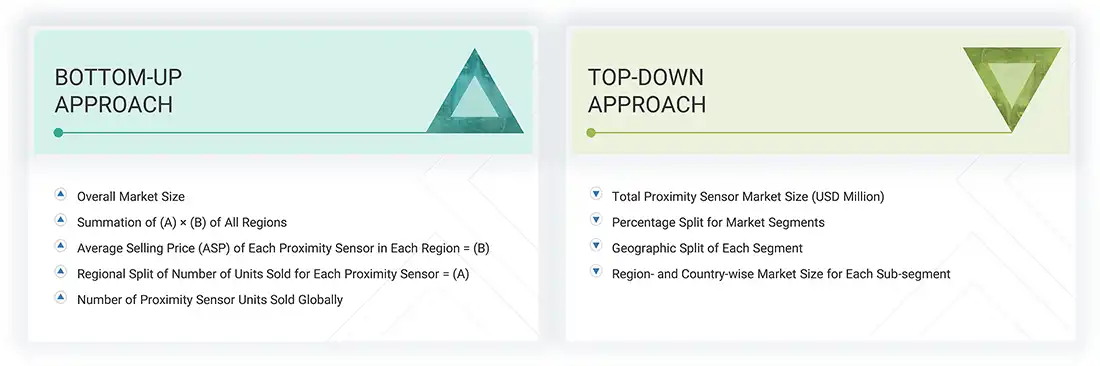
Both top-down and bottom-up approaches were used to estimate and validate the total size of the actuators market. These methods were also used extensively to estimate the size of various subsegments in the market. The research methodology used to estimate the market size includes the following:
Approach to arrive at market size using bottom-up analysis (demand side)
- Entities in the proximity sensor value chain influencing the entire proximity sensor industry were identified.
- All key companies and related product manufacturers for implementing proximity sensors were analyzed.
- Trends regarding the use of proximity sensors in different end-use industries, including aerospace & defense, automotive, pharmaceuticals, manufacturing, building automation, consumer electronics, and others, were analyzed.
- Ongoing and upcoming developments, such as investments, R&D activities, product launches, collaborations, and partnerships, in the market were tracked; the market was forecast based on these developments and other critical parameters.
- Multiple discussions were conducted with key opinion leaders to understand the types of contracts made, along with the identification of proximity sensors sold by companies in the proximity sensor market; this was expected to help analyze the breakup of the scope of work carried out by each key company operating in the proximity sensor market.
- Market estimates were arrived at by analyzing revenues generated by these companies based on their locations (countries) and combining this data to get the market estimate in terms of region.
- At every level, estimates were verified and cross-checked through discussions with key opinion leaders, including chief executive officers (CEO), directors, and operations managers, and finally, with domain experts at MarketsandMarkets.
- This process also included the study of various paid and unpaid sources of information, such as annual reports, press releases, white papers, and databases.
Top-down approach
In the top-down approach, the overall size of the proximity sensor market was used to estimate the size of the individual markets (mentioned in the market segmentation) through percentage splits obtained from secondary and primary research. To calculate the size of the specific market segments, the size of the most appropriate parent market was used to implement the top-down approach. The bottom-up approach was also implemented for the data extracted from the secondary research to validate the size of various segments of the proximity sensor market.
Each company's share in the market was estimated to verify the revenue shares used earlier in the bottom-up approach. With the data triangulation procedure and data validation through primaries, the sizes of the parent market and the individual markets' sizes were determined and confirmed. The data triangulation procedure used for this study has been explained in the next section.
Approach to arrive at market size using top-down analysis (supply side)
- The initial focus is on top-line investments in the proximity sensor ecosystem.
- The market size was calculated based on the revenue generated by players through the sales of proximity sensors.
- Further splits were obtained based on R&D activities and key developments in key market areas.
- Splits were derived based on proximity sensors in diverse end-use industries.
- Information related to revenue generated by players through their offerings was compiled and analyzed.
- Multiple on-field discussions were conducted with key opinion leaders across major companies involved in developing proximity sensors.
- The geographic split was estimated with the help of secondary sources based on various factors, such as the number of players in a specific country/region and systems used in various end-use industries, such as aerospace & defense, automotive, pharmaceuticals, manufacturing, building automation, consumer electronics, and others.
Proximity Sensor Market : Top-Down and Bottom-Up Approach
Data Triangulation
After arriving at the overall market size from the market size estimation process explained above, the total market was split into several segments and subsegments. Where applicable, data triangulation and market breakdown procedures were employed to complete the overall market engineering process and arrive at the exact statistics for all segments and sub-segments. The data was triangulated by studying various factors and trends from the demand and supply sides. The market size was also validated using top-down and bottom-up approaches.
Market Definition
The proximity sensor market encompasses devices designed to detect the presence or absence of objects, typically without physical contact. These sensors utilize various technologies, such as inductive, capacitive, magnetic, optical/photoelectric, and ultrasonic, to detect nearby objects or materials.
The scope of the proximity sensor market is expanding rapidly due to increasing automation across industries and the growing demand for smart technologies. In automotive applications, proximity sensors are crucial in ADAS and autonomous vehicles, enhancing safety and navigation capabilities. In industrial automation, these sensors optimize production processes by ensuring precise object detection, reducing downtime, and improving efficiency. Moreover, advancements in sensor technologies and the integration of artificial intelligence and IoT drive innovations that enhance sensor accuracy, reliability, and functionality, fueling market growth. As industries continue embracing digital transformation and smart manufacturing initiatives, the proximity sensor market is poised to expand globally.
Key Stakeholders
- Proximity sensor manufacturers
- Raw material vendors
- Electronic design automation (EDA) and design tool vendors
- Fabrication, wafer, and foundry process equipment vendors
- Integrated device manufacturers
- Fabless vendors
- Original equipment manufacturers: electronics modules, devices, equipment, instruments, and system manufacturers
- Technology investors
- Governments and financial institutions
- Analysts and strategic business planners
- Existing and prospective end users
- Venture capitalists, private equity firms, and startup companies
- Distributors and traders
- Research institutes and organizations
Report Objectives
- To define, describe, segment, and forecast the proximity sensor market size, by technology, product type, range, output, and end-use industry, in terms of value
- To estimate the global proximity sensor market, by technology, in terms of volume
- To forecast the market size of four key regions, namely, North America, Europe, Asia Pacific, and the RoW, in terms of value
- To present detailed information regarding the major factors influencing the growth of the market (drivers, restraints, opportunities, and challenges)
- To provide an ecosystem analysis, case study analysis, patent analysis, technology analysis, ASP analysis, Porter's Five Forces analysis, and regulations pertaining to the market
- To offer a comprehensive overview of the value chain of the proximity sensor market ecosystem
- To critically assess micromarkets1 with respect to individual growth trends, prospects, and contributions to the total market
- To strategically profile the key players and comprehensively analyze their market shares and core competencies2
- To assess the opportunities in the market for stakeholders and describe the competitive landscape of the market
- To analyze competitive developments in the market, such as collaborations, partnerships, product developments, and R&D
- To evaluate the impact of AI/GenAI, the 2025 US tariff, and the macroeconomic outlook for each region in the proximity sensors market
Note: Micromarkets are defined as the further segments and subsegments of the proximity sensor market included in the report.
Available Customizations
With the market data given, MarketsandMarkets offers customizations according to the company's specific needs. The following customization options are available for the report:
Company Information
- Detailed analysis and profiling of additional market players (up to 7)
Get the Full Proximity Sensor Market Report
Full forecast, segment splits, and company analysis for all Proximity Sensor Market.
- UK Proximity Sensor Market
- Germany Proximity Sensor Market
- France Proximity Sensor Market
- Italy Proximity Sensor Market
- China Proximity Sensor Market
- South Korea Proximity Sensor Market
- India Proximity Sensor Market
- Rest Of Europe Proximity Sensor Market
- Rest Of Asia Pacific Proximity Sensor Market
- Africa Proximity Sensor Market
- Middle East Proximity Sensor Market
- South America Proximity Sensor Market
- GCC Proximity Sensor Market
- Rest Of Middle East Proximity Sensor Market
- US Proximity Sensor Market
- Canada Proximity Sensor Market
- Mexico Proximity Sensor Market
Need a Tailored Report?
Customize this report to your needs
Get 10% FREE Customization
Customize This Report
