
Asia Pacific Smart Port Market (2025-2030)

The Asia Pacific Smart Port Market was valued at $1412.5 Million in 2025 and projected to reach to $4608.4 Million by 2030, representing a compound annual growth rate of 26.7%. Asia Pacific's smart port market is experiencing unprecedented expansion driven by massive infrastructure investments, particularly in China and Southeast Asian maritime hubs.


| Market Size in | USD 26.32 MN |
| Market Forecast in | |
| CAGR | |
| Forecast Period | |
| Units Considered | Value (USD MN) |
Asia Pacific Smart Port Market Trends and Insights
- Asia Pacific is driving significant growth in port automation and digitalization, with a compound annual growth rate of 26.7% over the forecast period.
- This acceleration reflects the region's strategic investments in IoT, AI, and real-time cargo management systems to enhance operational efficiency and reduce congestion at major shipping hubs. Asia Pacific's dominance in global maritime trade positions it as a critical market for smart port technologies.
- The region's leading ports are adopting advanced monitoring systems, autonomous equipment, and predictive analytics to optimize vessel turnaround times and improve supply chain visibility.
- Between 2025 and 2030, Asia Pacific is expected to capture substantial market share as governments and port operators prioritize digital transformation to meet rising container volumes and sustainability mandates. Key drivers in Asia Pacific include increasing e-commerce demand, regulatory pressure for emissions reduction, and competition among regional ports to attract international shipping lines.
- Asia Pacific's investment in smart infrastructure is reshaping port operations and establishing the region as a global leader in maritime innovation..
Key Market Statistics
- CAGR (2025-2030) 26.7% CAGR
- Market Size, 2025 ~USD 1412.5 Million
- Forecast, 2030 ~USD 4608.4 Million
- Geography Asia Pacific
Asia Pacific Smart Port Market Overview
Dominant Market Leader :
China commands the Asia Pacific smart port market with USD 2,960 million in 2025, representing over 209% of the regional average and driving the region's overall growth trajectory through massive port digitalization initiatives.
High-Growth Regional CAGR :
Asia Pacific's 26.7% CAGR significantly outpaces the global average of 25.8%, positioning the region as the fastest-growing hub for smart port technologies and IoT-enabled port automation solutions.
Strategic Hub Expansion :
Singapore, South Korea, and Hong Kong collectively represent over USD 1,033.7 million in market value, establishing Asia Pacific as a critical nexus for international shipping and port digitalization investments.
Rapid Forecast Growth :
The Asia Pacific smart port market is projected to nearly triple from USD 1,412.5 million in 2025 to USD 4,608.4 million by 2030, reflecting accelerating adoption of AI, IoT, and real-time cargo management systems.
Asia Pacific Smart Port Market Dynamics
- The region's 26.7% CAGR reflects strategic government initiatives to modernize port operations, enhance supply chain efficiency, and leverage emerging technologies like artificial intelligence and Internet of Things.
- Major ports in Singapore, Shanghai, and Busan are pioneering automation and digitalization, setting benchmarks for the region. The forecast period through 2030 anticipates sustained momentum as Asia Pacific ports compete for global trade dominance and address capacity constraints through technological innovation.
- Rising e-commerce volumes, increasing vessel sizes, and labor cost pressures are accelerating smart port adoption across the region.
- Investment in real-time cargo tracking, autonomous equipment, and predictive maintenance systems will drive market expansion, positioning Asia Pacific as the world's leading smart port market by 2030..
Market Ecosystem
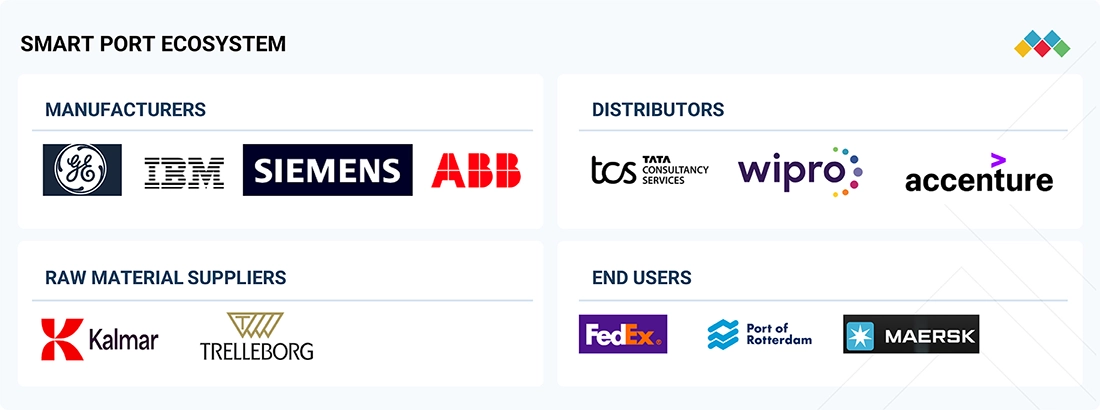
Smart Port Market: COMMERCIAL USE CASES ACROSS INDUSTRIES
| COMPANY | USE CASE DESCRIPTION | BENEFITS |
|---|---|---|
 |
Uses smart port logistics platforms to optimize cargo tracking, automate customs clearance, and improve intermodal container movement | Leverages IoT sensors and AI for predictive supply chain visibility | Faster cargo turnaround, reduced delays, improved shipment transparency |
 |
Implements digital twin technology, IoT-enabled quay sensors, and AI-driven traffic management to enhance vessel scheduling, berth allocation, and real-time monitoring of port operations | Higher operational efficiency, reduced congestion, better energy/resource management |
 |
Deploys blockchain-enabled trade platforms (e.g., TradeLens), automated container handling systems, and shore-power electrification to make port operations greener and more efficient | Increased transparency in trade, reduced paperwork, lower emissions, faster container handling |
Logos and trademarks shown above are the property of their respective owners. Their use here is for informational and illustrative purposes only.
Related Ecosystem
Smart Energy And Digital Solutions
- Cellular Network
- Analytics Software
- Geographical Information System (GIS)
- Meter Data Management (MDM)
- Smart Meters
- Siemens ag
- SCHNEIDER ELECTRIC SE
- ABB India Limited
- General Electric Company
- Eaton Corporation plc
Key Takeaways
- Asia Pacific smart port market grows from $1,412.5M (2025) to $4,608.4M (2030) at 26.7% CAGR, outpacing global growth.
- Asia Pacific ports are investing heavily in IoT, AI, and automation to optimize operations and reduce environmental impact.
- E-commerce surge and regional competition drive Asia Pacific adoption of real-time cargo tracking and predictive analytics.
- Asia Pacific's strategic geographic position and trade volume make it the fastest-growing smart port market globally.
Smart Port Market Report Scope
| Report Metric | Details |
|---|---|
| Base Year | 2025 |
| Fastest Growing Segment | BLOCKCHAIN (Technology) |
| Forecast Period | 2025-2030 |
| Growth Rate | CAGR of 25.8% from 2025 to 2030 |
| Largest Segment | SEAPORTS (Port Type) |
| Market Size Base Year (Billions) | ~USD 2.52 (2025) |
| Revenue Forecast (Billions) | ~USD 7.95 (2030) |
| Segments Covered | Element, Smart Port Infrastructure Type, Port Traffic Management System Type, Port Type, Technology, Throughput Capacity |
Asia Pacific Smart Port Market Report Segmentation
6 segment dimensions are covered across the global market.
By Element
- Port Community Systems
- Port Traffic Management Systems
- Smart Port Infrastructure
- Smart Port Safety & Security Systems
- Terminal Automation & Cargo Handling
By Smart Port Infrastructure Type
- Automated Mooring Systems
- Gate Automation
- Shore Power
- Smart Energy & Environment Solutions
By Port Traffic Management System Type
- Automated Information Systems
- Other Port Traffic Management Systems
- Real-Time Location Systems
By Port Type
- Inland Ports
- Seaports
By Technology
- AI
- Blockchain
- IoT
- Process Automation
By Throughput Capacity
- High Throughput Ports
- Low Throughput Ports
- Medium Throughput Ports
Target Audience
- Port Operators & Terminal Managers : Require market intelligence to justify smart port technology investments, benchmark operational efficiency gains, and identify best-in-class automation solutions deployed across Asia Pacific hubs.
- Technology Solution Providers : Need regional market sizing, growth forecasts, and competitive positioning data to develop Asia Pacific go-to-market strategies, localize offerings, and secure enterprise port operator contracts.
- Investment & Private Equity Firms : Seek comprehensive market analysis to identify high-growth acquisition targets, evaluate smart port technology companies, and assess Asia Pacific's investment potential through 2030.
- Government & Maritime Authorities : Utilize market data to inform port modernization policies, allocate infrastructure budgets, and align national maritime strategies with Asia Pacific's digital transformation trends.
- Supply Chain & Logistics Companies : Need insights into Asia Pacific port digitalization to optimize shipping routes, negotiate with smart-enabled terminals, and enhance end-to-end supply chain visibility and efficiency.
Countries within Asia Pacific - compare and drill down
| Country | 2025 size (native) |
|---|---|
| China | USD 2960 Million |
| Singapore | USD 400.5 Million |
| South Korea | USD 413.4 Million |
| Japan | USD 346.6 Million |
| Hong Kong | USD 219.8 Million |
| Rest Of Asia Pacific | USD 268.2 Million |
Country market size visualization
Reasons to Buy this Report
- Regional Market Dominance Insights : Understand China's commanding 2,960 USD million market position and identify growth opportunities across emerging Asia Pacific ports competing for regional leadership in smart port adoption.
- High-Growth Investment Opportunities : Capitalize on Asia Pacific's 26.7% CAGR—exceeding global averages—to identify early-mover advantages in port automation, IoT solutions, and AI-driven cargo management systems.
- Strategic Hub Analysis : Access detailed market sizing for Singapore (USD 400.5M), South Korea (USD 413.4M), and Hong Kong (USD 219.8M) to target premium maritime technology markets with highest adoption rates.
- Competitive Landscape Mapping : Benchmark your solutions against regional competitors and understand technology adoption patterns across Asia Pacific's diverse port ecosystems and regulatory environments.
- Forecast-Driven Strategy Planning : Leverage 2030 projections (USD 4,608.4M) to develop long-term market entry strategies, partnership frameworks, and product roadmaps aligned with Asia Pacific's digital transformation trajectory.
Frequently asked questions
What is the projected market size for smart ports in Asia Pacific by 2030?
Asia Pacific's smart port market is projected to reach USD 4,608.4 million by 2030, growing from USD 1,412.5 million in 2025.
What is the CAGR for the Asia Pacific smart port market?
Asia Pacific's smart port market is expected to grow at a compound annual growth rate of 26.7% between 2025 and 2030.
Which technologies are driving smart port adoption in Asia Pacific?
Asia Pacific ports are adopting IoT sensors, artificial intelligence, autonomous equipment, real-time monitoring systems, and predictive analytics to enhance operational efficiency.
Why is Asia Pacific a key market for smart port solutions?
Asia Pacific dominates global maritime trade, faces rising container volumes, and has competitive pressure among major ports to adopt digital transformation technologies.
What factors are accelerating smart port investment in Asia Pacific?
Key drivers include e-commerce growth, environmental regulations, supply chain visibility demands, and competition among regional ports to attract international shipping lines.
RESEARCH METHODOLOGY
The study involved major activities in estimating the current size of the smart port market. Exhaustive secondary research was done to collect information on the peer and parent markets. The next step was to validate these findings, assumptions, and sizing with industry experts across the value chain through primary research. Both top-down and bottom-up approaches were employed to estimate the complete market size. Thereafter, market breakdown and data triangulation techniques were used to estimate the market size of the segments and subsegments.
Secondary Research
This research study on the smart port market involved the use of extensive secondary sources, directories, and databases, such as Hoovers, Bloomberg, Businessweek, Factiva, International Energy Agency, and BP Statistical Review of World Energy, to identify and collect valuable information for a technical, market-oriented, and commercial study of the global smart port market. Other secondary sources included annual reports, press releases, and investor presentations of companies, white papers, certified publications, articles by recognized authors, manufacturer associations, trade directories, and databases.
Primary Research
The smart port market comprises stakeholders such as smart port technology providers, infrastructure developers, and support service providers in the supply chain. The demand side of this market is characterized by the rising demand for smart port solutions in nations due to the increasing need for port efficiency, real-time data analytics, and predictive operations in aging port infrastructure and expanding global trade volumes. The supply side is characterized by rising demand for smart infrastructure contracts from port authorities and operators, and mergers and acquisitions among major industry players. Various primary sources from both the supply and demand sides of the market were interviewed to obtain qualitative and quantitative information. The following is the breakdown of primary respondents:
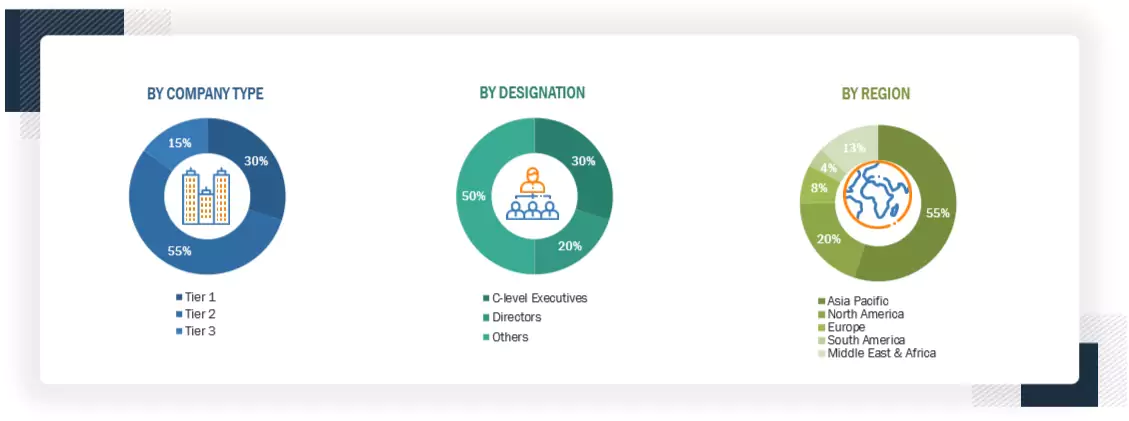
Note: Other designations include sales managers, engineers, and regional managers.
The tiers of the companies are defined based on their total revenue as of 2024: Tier 1: >USD 1 billion, Tier 2:
USD 500 million–1 billion, and Tier 3:
To know about the assumptions considered for the study, download the pdf brochure
Market Size Estimation
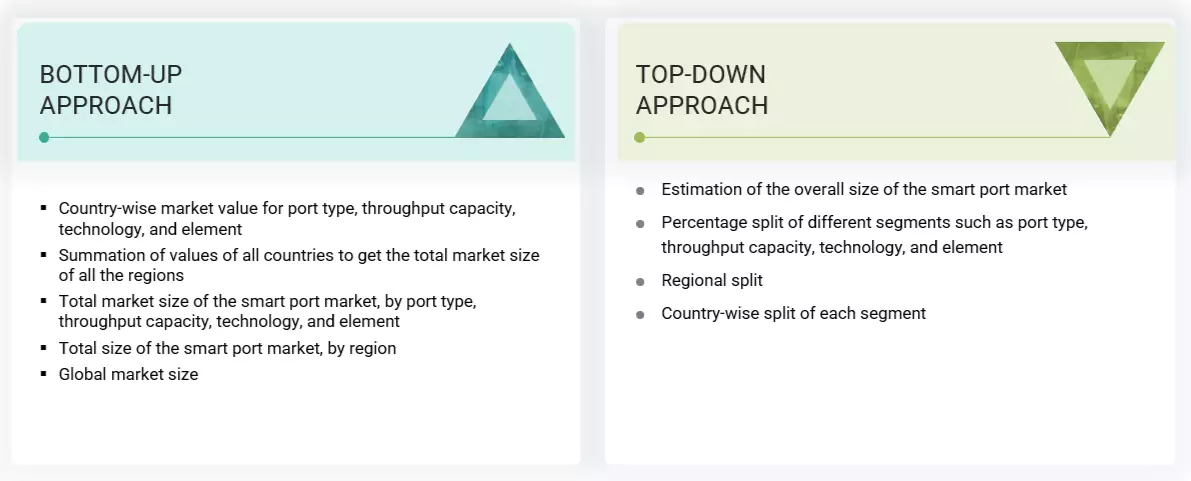
Both the top-down and bottom-up approaches were used to estimate and validate the size of the smart port market and its dependent submarkets. The key players in the market were identified through secondary research, and their market share in the respective regions was obtained through primary and secondary research. The research methodology includes studying the annual and financial reports of top market players and interviews with industry experts, such as chief executive officers, vice presidents, directors, sales managers, and marketing executives, for key quantitative and qualitative insights related to the smart port market.
Smart Port Market : Top-Down and Bottom-Up Approach
Data Triangulation
After arriving at the overall market size from the estimation process explained above, the total market was split into several segments and subsegments. The data triangulation and market breakdown processes were employed to complete the overall market engineering process and arrive at the exact statistics for all the segments and subsegments, wherever applicable. The data was triangulated by studying various factors and trends from both the demand and supply sides. The market was also validated using both the top-down and bottom-up approaches.
Market Definition
According to the Asian Development Bank, a smart port is equipped with sensors, cameras, and different types of devices, which help eliminate wastage of space, time, capital, and natural resources. Smart ports use smart technologies such as the Internet of Things (IoT), blockchain, artificial intelligence (AI), and process automation, which help enhance operational efficiency, cargo handling, passenger services, and port performance, ultimately reducing costs. These technologies allow the connection of the digital and physical worlds by providing real-time data and optimizing resources. A few major advantages associated with smart ports include eliminating human errors, faster turnaround time (increased productivity), and reduced port congestion. The smart port concept has been heavily influenced by the rise of Industry 4.0 (the Fourth Industrial Revolution) and its confluence with the Internet of Things (IoT). The manufacturing industry initially led industry 4.0. Since the port sector is an integral part of a manufacturer’s value chain, Industry 4.0 and IoT have been introduced into port operations as well, aiming at more efficient operations with less waste of space, time, and resources, resulting in the smart port concept. The flow of goods in the supply chain is a key focus of smart ports, but the other roles a port plays can equally benefit from smart initiatives—asset management, environmental protection, and staff support.
Stakeholders
- Maritime associations
- Port authorities and operators
- IoT and cloud-based solution providers
- Research and consulting companies in the marine sector
- Ship manufacturers
- Smart port equipment manufacturers
- AI solution providers
- Technology providers
- Banks and financial institutions
- Government organizations
- Investors/shareholders
- Logistic companies
- Barge operators
- Rail operators
- Terminal operators
- Cargo owners
Report Objectives
- To define, describe, segment, and forecast the smart port market based on element, technology, throughput capacity, port type, and region, in terms of value
- To describe and forecast the smart port market for various segments with respect to five main regions: North America, Europe, Asia Pacific, South America, and the Middle East & Africa, in terms of value
- To provide detailed information regarding drivers, restraints, opportunities, and challenges influencing the growth of the market
- To provide a detailed overview of the smart port value chain analysis, use case analysis, key stakeholders, buying criteria, patent analysis, trade analysis, tariff analysis, regulations and codes, pricing analysis, Porter’s five forces analysis, and impact of AI and 2025 US tariff on the market under study
- To strategically analyze micromarkets1 with respect to individual growth trends, prospects, and contributions to the total market
- To analyze opportunities in the market for various stakeholders by identifying high-growth segments
- To strategically profile key players and comprehensively analyze their market position regarding ranking and core competencies2, along with detailing the market’s competitive landscape.
- To analyze growth strategies adopted by market players, such as joint ventures, partnerships, mergers and acquisitions, contracts, agreements, and product launches in the smart port market
1. Micromarkets are defined as the segments and subsegments of the smart port market included in the report.
2. Core competencies of companies are defined in terms of the key developments and strategies adopted to sustain their position in the smart port market.
Available Customizations
MarketsandMarkets offers customizations according to the specific needs of the companies with the given market data.
The following customization options are available for the report:
Product Analysis
- Product matrix, which gives a detailed comparison of the product portfolio of each company
Geographic Analysis as per Feasibility
- Further breakdown of the smart port, by country
Company Information
- Detailed analysis and profiling of additional market players (up to five)
Get the Full Smart Port Market Report
Full forecast, segment splits, and company analysis for all Smart Port Market.
- China Smart Port Market
- Singapore Smart Port Market
- South Korea Smart Port Market
- Japan Smart Port Market
- Hong Kong Smart Port Market
- Germany Smart Port Market
- Italy Smart Port Market
- UK Smart Port Market
- Netherlands Smart Port Market
- Canada Smart Port Market
- Mexico Smart Port Market
- US Smart Port Market
- UAE Smart Port Market
- Saudi Arabia Smart Port Market
- Kuwait Smart Port Market
- South Africa Smart Port Market
- Brazil Smart Port Market
- Chile Smart Port Market
- Rest Of Europe Smart Port Market
- Rest Of Asia Pacific Smart Port Market
- Rest Of South America Smart Port Market
Need a Tailored Report?
Customize this report to your needs
Get 10% FREE Customization
Customize This Report
