
Asia Pacific Sports Analytics Market (2025-2030)

The Asia Pacific Sports Analytics Market was valued at $562 Million in 2025 and projected to reach to $1361 Million by 2030, representing a compound annual growth rate of 19.4%. The Asia Pacific sports analytics market is poised for transformative growth through 2030, driven by increasing digitalization of sports operations, substantial capital investments in professional leagues, and widespread adoption of data-driven decision-making across teams, broadcasters, and sports organizations.


| Market Size in | USD 26.32 MN |
| Market Forecast in | |
| CAGR | |
| Forecast Period | |
| Units Considered | Value (USD MN) |
Asia Pacific Sports Analytics Market Trends and Insights
- Asia Pacific's 19.4% compound annual growth rate significantly outpaces global trends, driven by increasing digitalization of sports operations, rising investment in professional leagues, and growing adoption of data-driven decision-making across the region.
- Asia Pacific's market growth reflects strong demand from cricket, football, and basketball sectors, where teams and franchises increasingly leverage analytics for player performance optimization, injury prevention, and fan engagement strategies. Asia Pacific's sports analytics ecosystem is characterized by emerging technology adoption and expanding infrastructure investments.
- Asia Pacific's major markets, including India, China, Japan, and Australia, are witnessing accelerated deployment of advanced analytics platforms, real-time performance tracking systems, and AI-powered insights tools.
- Asia Pacific's competitive landscape includes both established global analytics providers and regional startups capitalizing on localized sports preferences and regulatory environments.
- By 2030, Asia Pacific is expected to represent a substantially larger share of global sports analytics revenue, reflecting the region's growing prominence in professional sports and digital transformation initiatives..
Key Market Statistics
- CAGR (2025-2030) 19.4% CAGR
- Market Size, 2025 ~USD 562 Million
- Forecast, 2030 ~USD 1361 Million
- Geography Asia Pacific
Asia Pacific Sports Analytics Market Overview
Explosive Growth Trajectory :
Asia Pacific's sports analytics market is expanding at 19.4% CAGR, significantly outpacing the global rate of 15.7%, driven by rapid digitalization and increasing investment in professional sports infrastructure across the region.
China's Market Leadership :
China dominates Asia Pacific with a $307.4 million market valuation, leveraging its massive sports fan base and government support for digital sports innovation and data-driven athlete development programs.
Singapore's Premium Analytics Hub :
Singapore leads regional analytics adoption with a $332.9 million market size, serving as the technology and innovation center for sports data solutions across Southeast Asia and beyond.
Emerging Market Opportunities :
India ($121.9M) and South Korea ($155.2M) represent high-growth emerging markets with increasing professional league digitalization, rising sports viewership, and growing adoption of performance analytics among teams and broadcasters.
Asia Pacific Sports Analytics Market Dynamics
- The region's young, tech-savvy population and expanding middle class are fueling demand for advanced analytics solutions in cricket, football, basketball, and esports. Key growth catalysts include government initiatives supporting sports technology innovation, partnerships between international analytics providers and regional sports franchises, and the proliferation of mobile and cloud-based analytics platforms.
- Countries like China, Singapore, and India are emerging as innovation hubs, while Japan and South Korea continue to leverage analytics for competitive advantage in international sports competitions..
Market Ecosystem
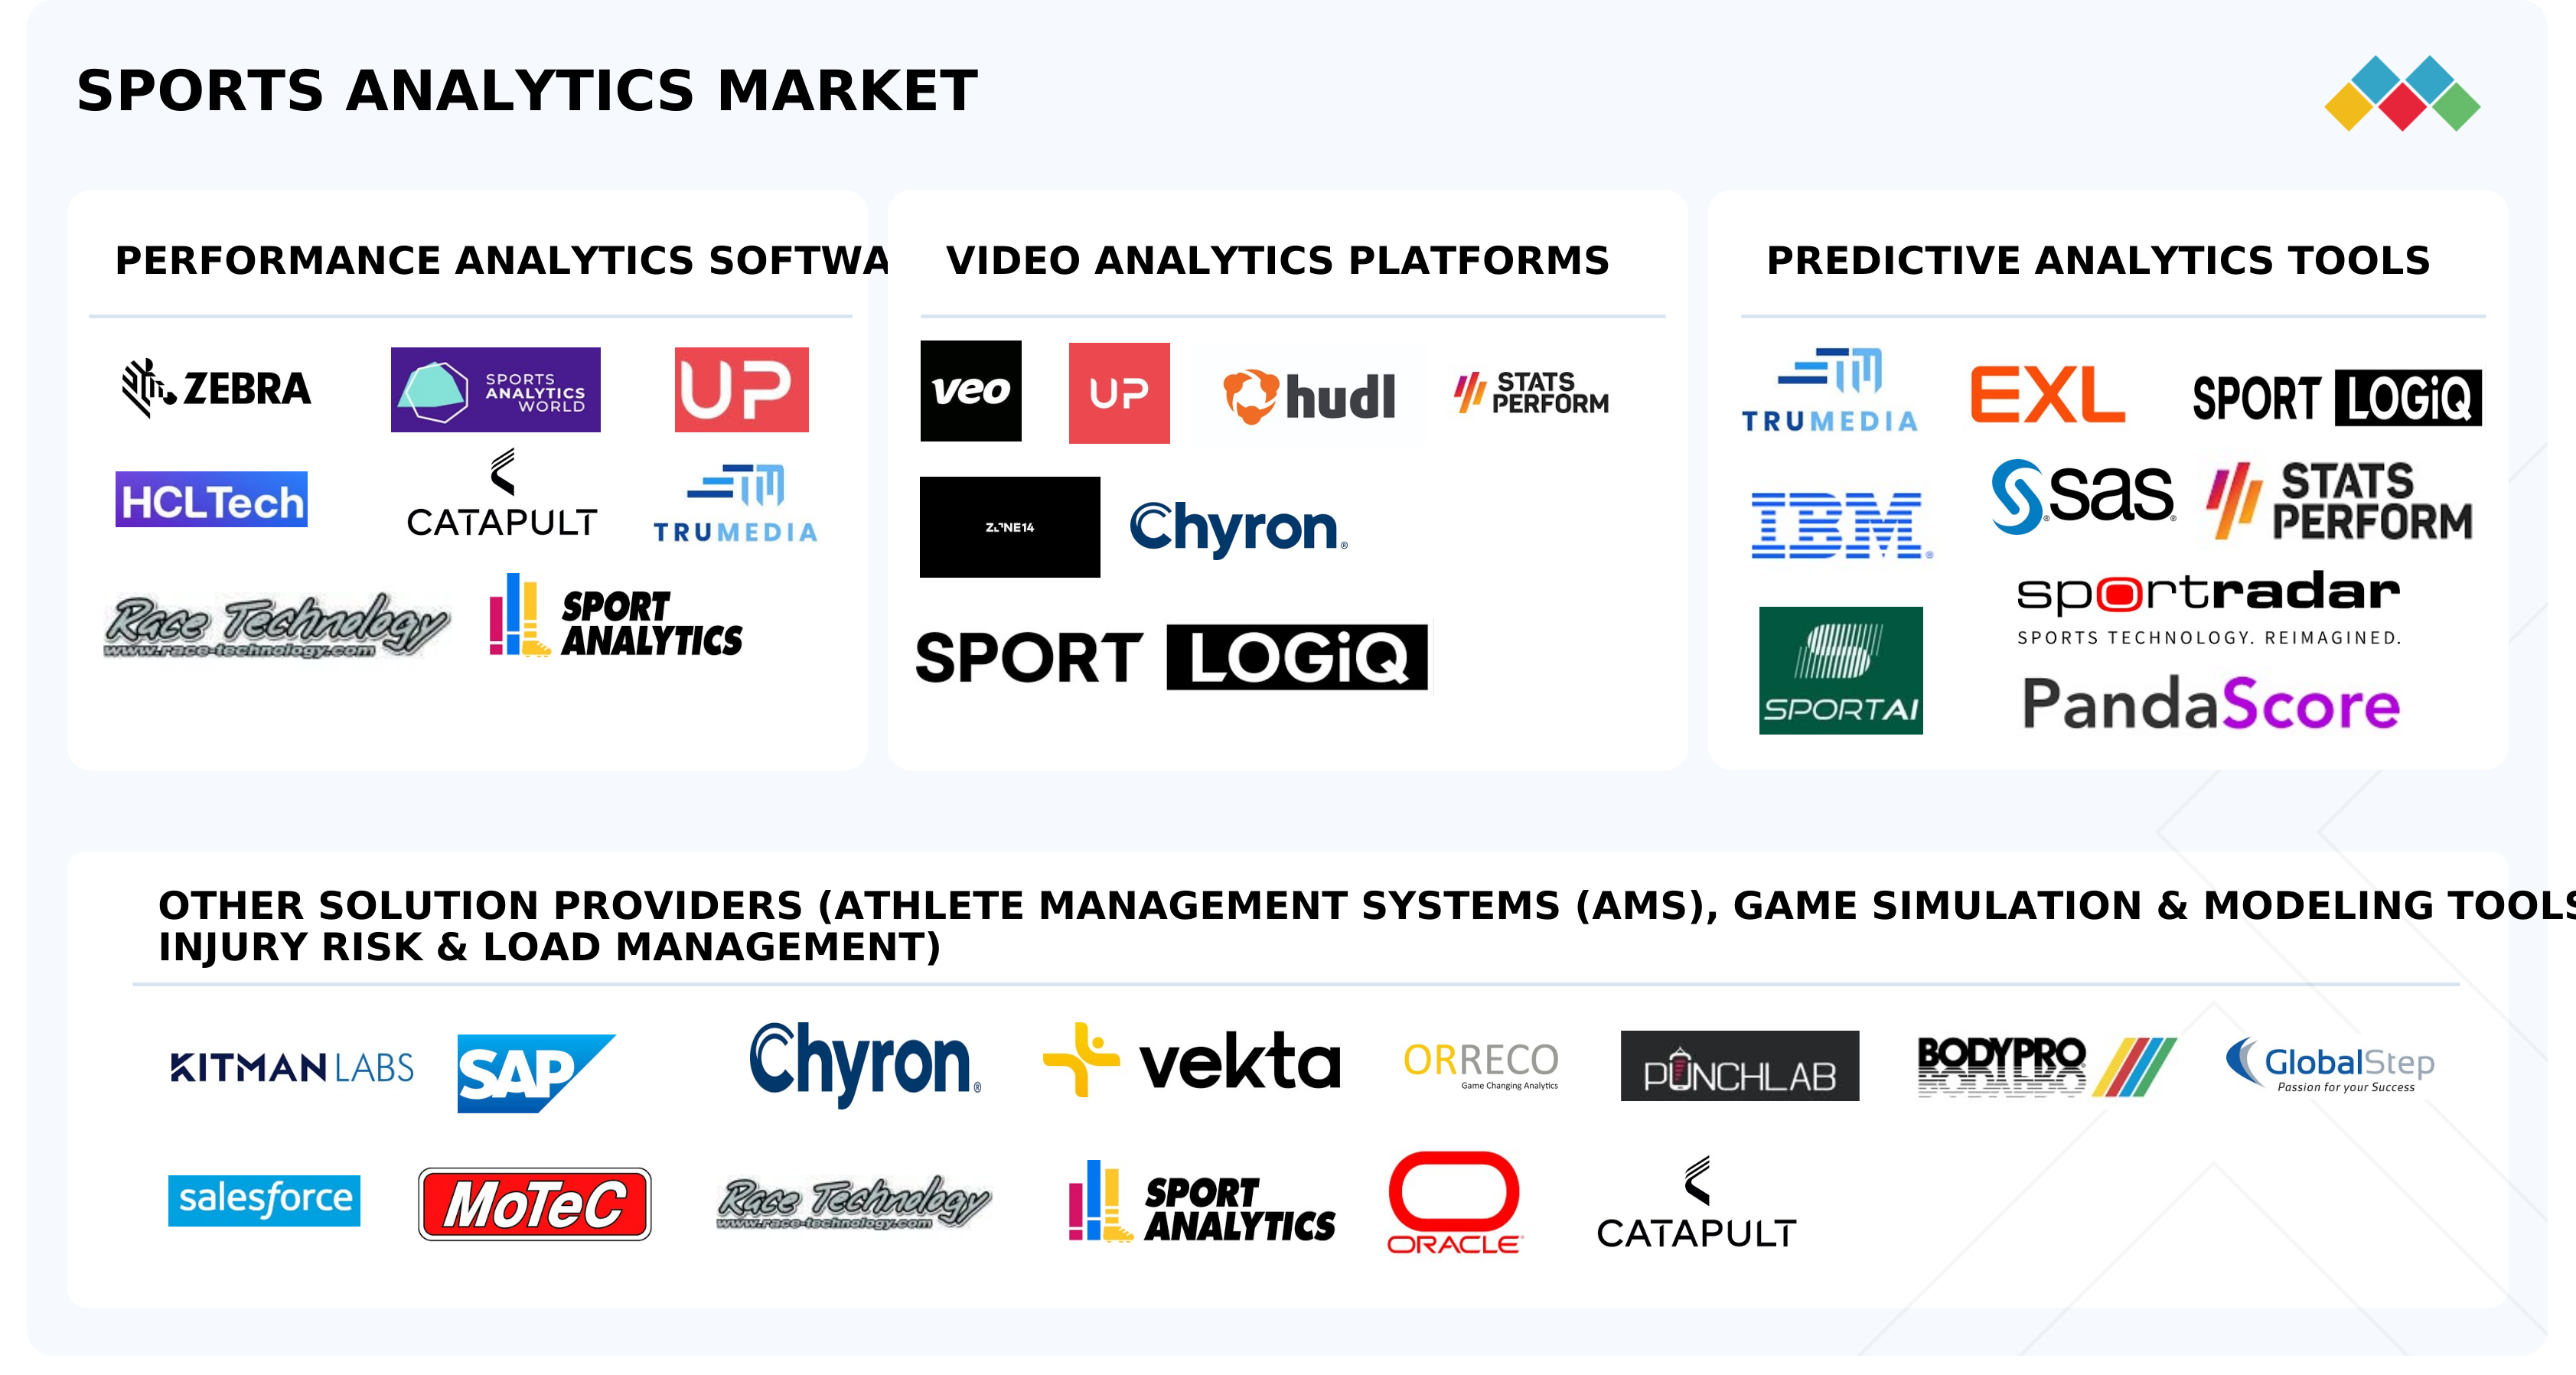
Sports Analytics Market: COMMERCIAL USE CASES ACROSS INDUSTRIES
| COMPANY | USE CASE DESCRIPTION | BENEFITS |
|---|---|---|
 |
IBM and ESPN transform fantasy football using AI-powered insights | AI delivers 48 billion personalized insights, helping 11 million fantasy football managers make data-driven roster choices. |
 |
Orlando Magic leverages SAS analytics to boost fan engagement and ticket revenue | Predictive analytics optimizes pricing for 41 home games, boosting revenue and operational efficiency. |
 |
Boston Celtics enhances sports analytics with AWS Cloud migration and mission Cloud expertise | Migrating to AWS Cloud reduced data processing time by over 75%, enabling faster decision-making. |
 |
FC Bayern Munich enhances fan experience and operational efficiency with SAP solutions | SAP S/4HANA consolidates over 50 systems, improving data consistency and operational efficiency. |
 |
Apostemos enhances player retention across Latin America with Sportradar’s AI-driven CRM | Personalized campaigns re-engaged 85% of targeted regular players, resulting in nearly four times higher sales revenue. |
Logos and trademarks shown above are the property of their respective owners. Their use here is for informational and illustrative purposes only.
Related Ecosystem
Analytics
- Natural Language Processing (NLP)
- Machine Learning
- Supply Chain Management
- Predictive Analytics
- Image Sensors
- International Business Machines Corporation
- MICROSOFT CORPORATION
- Oracle Corporation
- SAP SE
Key Takeaways
- Asia Pacific's sports analytics market will more than double from $562.0M (2025) to $1,361.0M (2030), representing a 19.4% CAGR.
- Asia Pacific's growth rate of 19.4% significantly exceeds the global average of 15.7%, positioning the region as a high-growth market.
- Asia Pacific's demand is driven by cricket, football, and basketball sectors leveraging analytics for performance optimization and fan engagement.
- Asia Pacific's major markets including India, China, Japan, and Australia are rapidly adopting AI-powered analytics platforms and real-time tracking systems.
Sports Analytics Market Report Scope
| Report Metric | Details |
|---|---|
| Base Year | 2025 |
| Fastest Growing Segment | CLOUD (Deployment Mode) |
| Forecast Period | 2025–2030 |
| Growth Rate | CAGR of 15.7% from 2025 to 2030 |
| Largest Segment | SOLUTIONS (Offering) |
| Market Size Base Year (Billions) | ~USD 2.29 (2025) |
| Revenue Forecast (Billions) | ~USD 4.75 (2030) |
| Segments Covered | Offering, Solution, Service, Professional Service, Deployment Mode, Sports Type, Team Sports, Individual Sports, Racing Sports, Online Or Virtual Sports, Emerging Sports, Application, End User |
Asia Pacific Sports Analytics Market Report Segmentation
13 segment dimensions are covered across the global market.
By Offering
- Services
- Software
- Solutions
By Solution
- Other Solutions
- Performance Analytics Software
- Predictive Analytics Tools
- Video Analytics Platforms
By Service
- Managed Services
- Professional Services
By Professional Service
- Support & Maintenance
- Support & Maintenance Services
- System Integration & Implementation
- System Integration & Implementation Services
- Training & Consulting
- Training & Consulting Services
By Deployment Mode
- Cloud
- Hybrid
- On-Premises
By Sports Type
- Emerging Sports
- Individual Sports
- Online Or Virtual Sports
- Racing Sports
- Team Sports
By Team Sports
- American Football
- Baseball
- Basketball
- Cricket
- Football (Soccer)
- Hockey
- Other Team Sports
- Volleyball
By Individual Sports
- Athletics
- Combat Sports
- Cycling
- Golf
- Gymnastics
- Other Individual Sports
- Swimming
- Tennis
By Racing Sports
- Formula 1
- Horse Racing
- Motogp
- Nascar
- Other Racing Sports
By Online Or Virtual Sports
- Daily Fantasy Leagues
- Fantasy Sports
- Online Betting
- Online Poker & Card Games
- Other Online Sports
By Emerging Sports
- Digital Extreme Sports
- Other Emerging Sports
- Paralympic Sports
By Application
- Ad Safety Optimization
- Article Writing & Summarizing
- Fake News Detection
- Film Scriptwriting, Vfx, & Storyboarding
- Gaming Content Optimization
- Immersive Entertainment
- Language Moderation
- Newsroom Analytics
- Npc Behavior Modeling
- Off-Field
- On-Field
- Post-Production Workflow Editing
- Predicting Viewer Preferences
- Real-Time Ott Content Moderation
- Video Production
By End User
- Broadcasting & Media Companies
- Entertainment
- Media
- Other End Users
- Sponsorship & Marketing Agencies
- Sports Academies & Colleges
- Sports Associations
- Sports Betting Companies
- Sports Equipment Manufacturers
- Sports Leagues & Governing Bodies
- Sports Media & Broadcasting
- Sports Teams
- Sports Teams & Clubs
Target Audience
- Sports Analytics Software Providers : Identify high-growth markets in Asia Pacific for product expansion, understand regional feature preferences, and develop localized solutions for cricket, football, and esports analytics.
- Professional Sports Organizations : Benchmark analytics adoption against regional competitors, evaluate technology vendors operating in Asia Pacific, and optimize performance management strategies using regional market intelligence.
- Investment & Private Equity Firms : Assess investment opportunities in Asia Pacific sports tech startups, evaluate market valuations, and identify acquisition targets in high-growth segments like India and Southeast Asia.
- Sports Broadcasting Networks : Enhance viewer engagement through data-driven content strategies, understand regional audience analytics preferences, and integrate advanced analytics into broadcast operations across Asia Pacific.
- Government & Sports Regulatory Bodies : Develop sports technology policies, support athlete development programs through analytics, and foster innovation ecosystems aligned with Asia Pacific's digital transformation initiatives.
Key Companies in the Asia Pacific Sports Analytics Market
| Company | HQ | Ownership | Strongest segments |
|---|---|---|---|
| NEW RELIC, INC. | United States | Private Company | Performance Analytics,Predictive Analytics,Video Analytics, |
| IBM | United States | Public Company | Performance Analytics,Predictive Analytics,Video Analytics, |
| SAP | Germany | Public Company | Performance Analytics,Predictive Analytics,Video Analytics, |
| HCLTECH | India | Public Company | Performance Analytics,Predictive Analytics,Video Analytics, |
| ZEBRA TECHNOLOGIES | United States | Public Company | Performance Analytics (tracking hardware, sensors, RTLS feeding analytics),Predictive Analytics (workflow and prescriptive analytics applied to sports ops),Video Analytics (machine vision, fixed industrial scanners in sports contexts), |
| SPORTRADAR | Switzerland | Public Company | Performance Analytics,Predictive Analytics,Video Analytics, |
| EXL | United States | Public Company | Performance Analytics,Predictive Analytics,Video Analytics, |
| CHYRON | United States | Private Company | Video Analytics (incl. tracking, telestration, virtual placement),Performance Analytics,Predictive Analytics, |
| CATAPULT | Australia | Public Company | Performance Analytics (wearables, athlete monitoring, health),Video Analytics (tactics & coaching, editing, publishing),Predictive Analytics & Media/Other (athlete management, learning, media licensing), |
NEW RELIC, INC.
New Relic, Inc. is a private software company founded in 2007 and headquartered in the United States. With 2,383 employees, the company provides cloud-based monitoring and observability solutions for software applications and infrastructure.
IBM
IBM is a public technology company founded in 1911 and based in the United States. With 264,300 employees, IBM is a global leader in enterprise hardware, software, and IT services.
SAP
SAP is a public software company founded in 1972 and headquartered in Germany. With 111,038 employees, SAP develops enterprise resource planning (ERP) and business management software solutions.
HCLTECH
HCLTech is a public information technology services company founded in 1976 and headquartered in India. The company delivers IT services, digital transformation, and business solutions to global clients.
ZEBRA TECHNOLOGIES
Zebra Technologies is a public company founded in 1969 and based in the United States. With 10,700 employees, Zebra specializes in mobile computing, data capture, and enterprise visibility solutions.
SPORTRADAR
Sportradar is a public company founded in 2001 and headquartered in Switzerland. The company specializes in sports data, analytics, and integrity services for the global sports industry.
EXL
EXL is a public company founded in 1999 and based in the United States. With 65,000 employees, EXL provides business process management, analytics, and digital transformation services.
CHYRON
Chyron is a private company founded in 1966 and based in the United States. With 190 employees, Chyron develops graphics, broadcast, and media technology solutions.
CATAPULT
Catapult is a public company founded in 2006 and headquartered in Australia. With 940 employees, Catapult provides sports analytics, wearable technology, and performance intelligence solutions.
Countries within Asia Pacific - compare and drill down
| Country | 2025 size (native) |
|---|---|
| China | USD 307.4 Million |
| Japan | USD 237.1 Million |
| India | USD 121.9 Million |
| South Korea | USD 155.2 Million |
| Singapore | USD 332.9 Million |
| ANZ | USD 171.1 Million |
| Rest Of Asia Pacific | USD 35.4 Million |
Country market size visualization
Reasons to Buy this Report
- Regional Market Segmentation : Gain detailed insights into country-level market dynamics across China, Japan, India, South Korea, Singapore, and ANZ, enabling targeted market entry and expansion strategies specific to Asia Pacific.
- Competitive Landscape Analysis : Understand the competitive positioning of analytics providers in Asia Pacific, identify key players dominating regional markets, and discover partnership opportunities with emerging technology leaders.
- Growth Driver Identification : Access comprehensive analysis of region-specific growth catalysts including digitalization trends, investment patterns, regulatory developments, and sports industry evolution unique to Asia Pacific markets.
- Investment Decision Support : Make informed investment and expansion decisions with detailed market forecasts, CAGR projections through 2030, and risk assessments tailored to Asia Pacific's diverse economic and regulatory environments.
- Strategic Planning Resources : Develop market-entry strategies, product localization roadmaps, and partnership frameworks based on Asia Pacific-specific consumer behavior, technology adoption rates, and sports industry maturity levels.
Frequently asked questions
What is the current size of the Asia Pacific sports analytics market?
The Asia Pacific sports analytics market is valued at $562.0 million in 2025 and is projected to reach $1,361.0 million by 2030.
What is the CAGR for Asia Pacific's sports analytics market?
Asia Pacific's sports analytics market is growing at a compound annual growth rate of 19.4% from 2025 to 2030.
Which sports sectors are driving growth in Asia Pacific?
Cricket, football, and basketball are the primary sectors driving Asia Pacific's sports analytics adoption, with teams using analytics for player performance and fan engagement.
Which countries represent the largest markets in Asia Pacific?
India, China, Japan, and Australia are the major markets in Asia Pacific, each experiencing significant adoption of analytics platforms and real-time tracking systems.
How does Asia Pacific's growth compare to global trends?
Asia Pacific's 19.4% CAGR significantly outpaces the global average of 15.7%, making it one of the fastest-growing regions for sports analytics.
RESEARCH METHODOLOGY
This research study on the sports analytics market involved the use of extensive secondary sources, such as directories, IEEE Communication-efficient Algorithms and Systems, International Journal of Innovation and Technology Management, and paid databases. Primary sources were mainly industry experts from the core and related industries, preferred sports analytics providers, third-party service providers, consulting service providers, end users, and other commercial enterprises. In-depth interviews with primary respondents, including key industry participants and subject matter experts, were conducted to obtain and verify critical qualitative and quantitative information and assess the market’s prospects.
Secondary Research
In the secondary research process, various sources were referred to identify and collect information for this study. Secondary sources included annual reports, press releases, and investor presentations of companies; white papers, journals, and certified publications; and articles from recognized authors, directories, and databases. The data was also collected from other secondary sources, such as journals, government websites, blogs, and vendors’ websites. Additionally, the sports analytics spending of various countries was extracted from the respective sources.
Primary Research
In the primary research process, various sources from the supply and demand sides were interviewed to obtain qualitative and quantitative information on the market. The primary sources from the supply side included various industry experts, such as Chief Experience Officers (CXOs), Vice Presidents (VPs), and directors specializing in business development, marketing, and sports analytics. It also included key executives from sports analytics solution and service vendors, system integrators (SIs), professional service providers, industry associations, and other key opinion leaders.
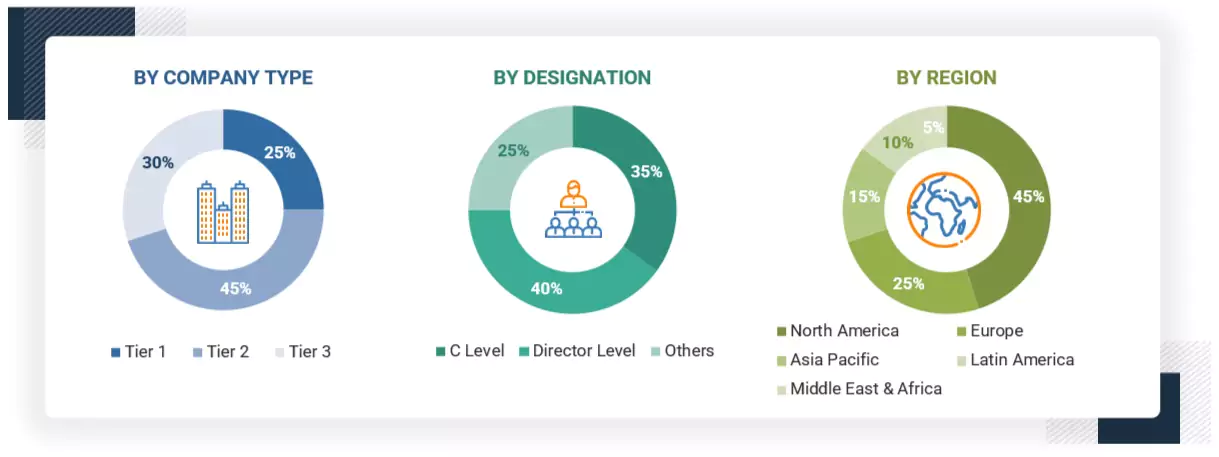
Note: Tier 1 companies’ revenues are more than USD 10 billion; tier 2 companies’ revenues range
between USD 1 and 10 billion; and tier 3 companies’ revenues range between USD 500 million
and USD 1 billion. Other designations include sales managers, marketing managers, and product managers.
Source: Industry Experts
To know about the assumptions considered for the study, download the pdf brochure
Market Size Estimation
Multiple approaches were adopted to estimate and forecast the sports analytics market. The first approach involved estimating the market size by companies’ revenue generated through the sale of sports analytics solutions.
Market Size Estimation Methodology- Top-down approach
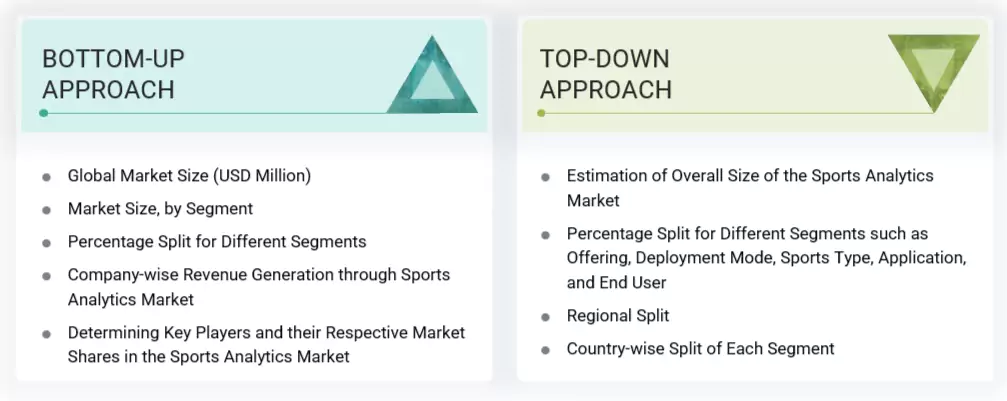
In the top-down approach, an exhaustive list of all the vendors offering products in the sports analytics market was prepared. The revenue contribution of the market vendors was estimated through annual reports, press releases, funding, investor presentations, paid databases, and primary interviews. Each vendor’s offerings were evaluated based on offering, deployment mode, sports type, application, and region. The markets were triangulated through primary and secondary research. The primary procedure included extensive interviews for key insights from industry leaders, such as CIOs, CEOs, VPs, directors, and marketing executives. The market numbers were further triangulated with the existing MarketsandMarkets’ repository for validation.
Market Size Estimation Methodology-Bottom-up approach
In the bottom-up approach, the adoption rate of sports analytics solutions across various verticals in key countries within their respective regions was identified as the main contributor to the market share. Cross-validation revealed the adoption of sports analytics solutions among enterprises, along with various use cases by region. Weightage was given to use cases identified in different regions for the market size calculation.
Based on the market numbers, the regional split was determined by primary and secondary sources. The procedure included analyzing the sports analytics market’s regional penetration. Based on secondary research, the regional spending on Information and Communications Technology (ICT), socio-economic analysis of each country, strategic vendor analysis of major sports analytics providers, and organic and inorganic business development activities of regional and global players were estimated.
Sports Analytics Market : Top-Down and Bottom-Up Approach
Data Triangulation
After determining the overall market size using the market size estimation processes as explained above, the market was split into several segments and subsegments. Data triangulation and market breakup procedures were employed, wherever applicable, to complete the overall market engineering process and determine the exact statistics of each market segment and subsegment. The overall market size was used in the top-down procedure to estimate the size of other individual markets via percentage splits of the market segmentation.
Market Definition
According to Catapult, sports analytics is the integration of data science and performance technology to support evidence-based decisions in sports. It involves collecting and analyzing real-time athlete data such as movement, load, and fatigue using video systems and software tools. The goal is to optimize individual and team performance, reduce injury risk, and refine tactical strategies. Catapult emphasizes removing guesswork from coaching by transforming raw performance data into clear, actionable insights. Its approach is deeply embedded in elite sport environments, enabling practitioners to track trends, benchmark results, and tailor interventions based on precision analytics.
Stakeholders
- Sports analytics providers
- Distributors and value-added resellers (VARs)
- Independent software vendors (ISV)
- Service providers
- Support & maintenance service providers
- System integrators (SIs)
- Technology providers
- Coaching staff & performance analysts
- Athlete monitoring & tech companies
- Sports technology & performance optimization firms
Report Objectives
- To define, describe, and forecast the sports analytics market by offering, deployment mode, sports type, application, and region
- To provide detailed information about major factors (drivers, restraints, opportunities, and industry-specific challenges) influencing market growth
- To analyze opportunities in the market and provide details of the competitive landscape for stakeholders and market leaders
- To forecast the market size of segments for North America, Europe, Asia Pacific, the Middle East & Africa, and Latin America
- To profile key players and comprehensively analyze their market rankings and core competencies
- To analyze competitive developments, such as partnerships, product launches, and mergers & acquisitions, in the sports analytics market
Available Customizations
With the given market data, MarketsandMarkets offers customizations to meet the company’s specific needs. The following customization options are available for the report:
Product Analysis
- The product matrix provides a detailed comparison of each company's product portfolio.
Geographic Analysis as per Feasibility
- Further breakup of the North American Sports Analytics market
- Further breakup of the European Sports Analytics market
- Further breakup of the Asia Pacific Sports Analytics market
- Further breakup of the Middle East & African Sports Analytics market
- Further breakup of the Latin American Sports Analytics market
Company Information
- Detailed analysis and profiling of additional market players (up to five)
Get the Full Sports Analytics Market Report
Full forecast, segment splits, and company analysis for all Sports Analytics Market.
- Anz Sports Analytics Market
- Rest Of Asia Pacific Sports Analytics Market
- Rest Of Latin America Sports Analytics Market
- Canada Sports Analytics Market
- US Sports Analytics Market
- UK Sports Analytics Market
- Germany Sports Analytics Market
- France Sports Analytics Market
- Italy Sports Analytics Market
- Spain Sports Analytics Market
- China Sports Analytics Market
- Japan Sports Analytics Market
- India Sports Analytics Market
- South Korea Sports Analytics Market
- Singapore Sports Analytics Market
- Saudi Arabia Sports Analytics Market
- UAE Sports Analytics Market
- South Africa Sports Analytics Market
- Qatar Sports Analytics Market
- Turkey Sports Analytics Market
- Brazil Sports Analytics Market
- Mexico Sports Analytics Market
- Argentina Sports Analytics Market
- Rest Of Europe Sports Analytics Market
Need a Tailored Report?
Customize this report to your needs
Get 10% FREE Customization
Customize This Report
