Kombucha Market

Kombucha Market by Product Type (Hard, Conventional), Type (Natural, Flavored), Nature, Packaging (Bottle, Can), Distribution Channel (Supermarket/Hypermarket, Online Retailers, Specialist Stores, Convenience Stores, & Other Channels), & Region - Global Forecast to 2029

Report Code: FB 3672 Apr, 2024, by marketsandmarkets.com

Kombucha Market Outlook (2024-2029)

The global kombucha market size was valued at US$ 2.0 billion in 2023 and is poised to grow from 2.4 billion in 2024 to USD 5.9 billion by 2029, growing at a CAGR of 19.4% in the forecast period. The trend towards organic and natural products has propelled the popularity of kombucha, as it is often made with organic ingredients and is seen as a healthier alternative to sugary sodas and artificial drinks. The availability of a wide range of flavors and variations has also contributed to market growth, appealing to diverse consumer preferences.

Kombucha Market Overview

To know about the assumptions considered for the study, Request for Free Sample Report

Kombucha Market Opportunities

To know about the assumptions considered for the study, download the pdf brochure

Kombucha Market Dynamics

Driver: Rise in demand for Fortified Food & Beverage Products

The demand for fortified food and beverages is experiencing significant growth due to several key reasons. Firstly, there is a growing awareness among consumers about the importance of nutrition and its impact on overall health and well-being. By fortifying kombucha with additional vitamins, minerals, or other functional ingredients, manufacturers can enhance its nutritional profile and offer added health benefits to consumers. This fortified version of kombucha caters to individuals seeking not only the probiotic benefits of traditional kombucha but also additional nutrients to support their health goals. Therefore, the growing demand for fortified food and beverages contributes to the expansion of the kombucha market by offering consumers more options that meet their nutritional needs and preferences.

Restraint: Supply chain risk

Throughout the processed kombucha supply chain, proper storage, packaging, and transportation facilities are essential due to its perishable nature. Contamination and spoilage pose significant risks, resulting in potential losses. To mitigate these risks, considerable expenses are incurred for cold storage units, sterilization methods, and specialized transportation like reefers. These additional costs contribute to a notable increase in the selling price of kombucha products, impacting overall demand. In many developing nations, price-conscious consumers tend to favor more affordable beverages over expensive kombucha options.

Opportunity: Increase in demand for organic products

The surge in demand for organic products has played a pivotal role in driving the increased popularity of kombucha. As consumers become increasingly health-conscious and environmentally aware, they are actively seeking out organic alternatives in their food and beverage choices. Kombucha, with its natural fermentation process and often organic ingredient base, aligns perfectly with this trend. Organic kombucha offers consumers a refreshing beverage option that not only provides potential health benefits like improved digestion and boosted immunity but also meets their preferences for sustainably sourced and environmentally friendly products. Additionally, the organic certification of kombucha assures consumers of the absence of synthetic chemicals, pesticides, and genetically modified organisms (GMOs) in its production, further enhancing its appeal among health-conscious shoppers. Consequently, the rise in demand for organic products has directly translated into increased interest and consumption of kombucha, driving its market growth and solidifying its position as a favored choice in the beverage landscape.

Challenge:Regulatory challenges

Regulatory challenges for kombucha primarily revolve around its fermentation process, alcohol content, and labeling requirements. One significant challenge is the classification of kombucha as a beverage or a dietary supplement, which varies across different regions and jurisdictions. In the United States, for example, the FDA regulates kombucha as a beverage, subjecting it to certain labeling and safety standards. Labeling requirements also present regulatory challenges, particularly regarding health claims and ingredient labeling accuracy. Regulators may have specific guidelines regarding the use of terms like "probiotic" or "live cultures" and require accurate disclosure of ingredients and nutritional information on product labels.

Kombucha Market Trends

Here are some trends that were shaping the kombucha market:

  • Increasing Health Consciousness: Consumers were becoming more health-conscious and seeking out beverages with perceived health benefits. Kombucha, known for its probiotic content and potential digestive health benefits, appealed to this trend.
  • Diversification of Flavors: Kombucha manufacturers were introducing a wide variety of flavors to cater to different consumer preferences, including traditional options like ginger and original, as well as more adventurous flavors like mango, hibiscus, and lavender.
  • Rising Demand for Functional Beverages: Kombucha was seen as a functional beverage, offering not only hydration but also potential health benefits such as improved digestion and immune support. This positioned it well in the growing market for functional beverages.
  • Expansion in Retail Availability: Kombucha was becoming more widely available in supermarkets, health food stores, and even convenience stores, reflecting its increasing popularity and mainstream acceptance.
  • Innovation in Packaging: Manufacturers were innovating in packaging to improve convenience and appeal to environmentally conscious consumers. This included the introduction of smaller, single-serve bottles, as well as sustainable packaging options such as recyclable glass bottles and compostable packaging materials.
  • Growth Potential: Despite challenges, the kombucha market had significant growth potential, driven by increasing consumer awareness of health and wellness, the popularity of probiotics, and the demand for natural and organic beverages.

Kombucha Market Ecosystem

Key players within this market consist of reputable and financially robust kombucha manufacturers. These entities boast extensive industry tenure, offering diversified product portfolios, advanced technologies, and robust global sales and marketing networks. Prominent companies in this market include GT's Living Foods (US), Brew Dr. (US), SYSTM Foods Inc. (US), Health-Ade LLC (US), Tropicana Brands Group (US), MOMO Kombucha (UK), GO Kombucha (UK), Harris Freeman (US), Kosmic Kombucha (US), Equinox Kombucha (UK), Remedy Drinks (Australia), Soulfresh Global Pty Ltd (Australia), Cruz Group Sp. z o. o. (Poland), NessAlla Kombucha (US), and FedUp Foods (US).

Top Companies in Kombucha Market

Bottle to hold the largest share by packaging type in the global kombucha market.

The bottle packaging is projected to hold the largest share of the kombucha market. The preference for bottles as the packaging type for kombucha drinks stems from several key factors. Firstly, bottles offer superior protection against light and air, which can degrade the quality of kombucha over time. This protection helps preserve the delicate balance of probiotics and other beneficial compounds in the beverage, ensuring that consumers receive the full spectrum of health benefits with each sip. Additionally, bottles provide a convenient and portable option for consumers, allowing them to enjoy kombucha on the go without compromising its freshness or taste.

By nature, the organic segment is expected to hold a significant market share in the kombucha market.

The organic type of kombucha is experiencing significant growth due to several key reasons. Firstly, there is a growing consumer preference for organic products driven by concerns about health, sustainability, and environmental impact. the organic certification of kombucha provides a level of transparency and credibility that enhances consumer trust and confidence in the product's integrity and authenticity. Another driving factor behind the growth of organic kombucha is the expansion of distribution channels and increased availability in retail outlets, health food stores, and online platforms. As consumer demand for organic products continues to rise, retailers are responding by offering a wider selection of organic beverages, including kombucha, thereby expanding market reach and accessibility.

By distribution channels, the supermarkets/hypermarkets segment holds the highest market share in the kombucha market. 

Supermarkets and Hypermarkets is essential for distributing kombucha products to consumers. These large retail outlets offer a wide variety of kombucha brands and flavors to cater to diverse preferences. They provide ample shelf space, ensuring visibility for kombucha products and encouraging impulse buys. Moreover, supermarkets and hypermarkets frequently offer promotions and discounts on kombucha items, further motivating consumer purchases. With their extensive presence in both urban and suburban areas, these establishments serve as convenient points of purchase for consumers, significantly contributing to the accessibility and popularity of kombucha products. In summary, the supermarkets/hypermarkets segment acts as a primary distribution channel for kombucha, fostering market penetration and fueling the growth of the kombucha market.

North America to dominate the kombucha market during the forecast period.

North America's dominance in the kombucha market can be attributed to several key factors. The region's early embrace of health-conscious trends, particularly in the United States, has fostered a culture receptive to alternative wellness products like kombucha. Furthermore, North American consumers' increasing awareness of the beverage's perceived health benefits and probiotic content has driven significant demand. Additionally, the widespread accessibility of kombucha products through various distribution channels, coupled with a relatively favorable regulatory environment, further bolsters market expansion.

North American Kombucha Market Size, and Share

Kombucha Market Share

The key players in this market include GT’s Living Foods (US), Brew Dr. (US), SYSTM Foods Inc. (US), Health-Ade LLC (US), Tropicana Brands Group (US), MOMO Kombucha (UK), GO Kombucha (UK), Harris Freeman (US), Kosmic Kombucha (US), Equinox Kombucha (UK), Remedy Drinks (Australia), Soulfresh Global Pty Ltd (Australia), Cruz Group Sp. z o. o. (Poland), NessAlla Kombucha (US), and FedUp Foods (US). These market participants are emphasizing the expansion of their footprint via agreements and partnerships. They maintain a robust presence in North America, Asia Pacific, South America, RoW, and Europe, and they are supported by manufacturing facilities and well-established distribution networks spanning these regions.

Get online access to the report on the World's First Market Intelligence Cloud

  • Easy to Download Historical Data & Forecast Numbers
  • Company Analysis Dashboard for high growth potential opportunities
  • Research Analyst Access for customization & queries
  • Competitor Analysis with Interactive dashboard
  • Latest News, Updates & Trend analysis
Request Sample

Scope of the Report

Report Metric

Details

Market valuation in 2024

USD 2.4 billion

Revenue prediction in 2029

USD 5.9 billion

Growth Rate

CAGR of 19.4% from 2024-2029

Market size estimation

2024–2029

Base year considered

2023

Forecast period considered

2024–2029

Units considered

Value (USD)

Segments Covered

By Product Type, Type, Nature, Packaging, Distribution Channels, and Region

Regions covered

North America, Europe, South America, Asia Pacific, and RoW

Key companies profiled

  • GT's Living Foods (US)
  • Brew Dr. (US)
  • SYSTM Foods Inc. (US)
  • Health-Ade LLC (US)
  • Tropicana Brands Group (US)
  • MOMO Kombucha (UK)
  • GO Kombucha (UK)
  • Harris Freeman (US)
  • Kosmic Kombucha (US)
  • Equinox Kombucha (UK)
  • Remedy Drinks (Australia)
  • Soulfresh Global Pty Ltd (Australia)
  • Cruz Group sp. zo.o. (Poland)
  • NessAlla Kombucha (US)
  • FedUp Foods (US)

Kombucha Market Segmentation:

This research report categorizes the kombucha market based on product type, type, nature, packaging, distribution channels, and region.

By Product Type
  • Hard
  • Conventional
By Type
  • Natural
  • Flavored
By Nature
  • Organic
  • Inorganic
By Packaging  Type
  • Bottle
  • Can
By Distribution Channels
  • Supermarkets/Hypermarkets
  • Online Retailers
  • Specialist Stores
  • Convenience Stores
  • Other Distribution Channels
By Region:
  • North America
  • Europe
  • Asia Pacific
  • South America
  • Rest of the World (RoW)

Target Audience

  • Kombucha traders, retailers, and distributors
  • Kombucha manufacturers & suppliers
  • Related government authorities, commercial research & development (R&D) institutions.
  • Regulatory bodies, including government agencies and NGOs.
  • Commercial research & development (R&D) institutions and financial institutions.
  • Government and research organizations.
  • Venture capitalists and investors.
  • Technology providers to kombucha and kombucha companies.
  • Associations and industry bodies. 

Kombucha Industry News

  • In April 2023, Brew Dr. Kombucha unveiled its latest product launch, showcasing a revamped branding and packaging design. The updated appearance features a modernized logo, redesigned labels, and the exciting addition of two enticing flavors: Strawberry Fields and Pineapple Paradise.
  • In February 2022, GT’s Living Foods announced the latest addition to its renowned Synergy raw kombucha brand: a new flavor that enriches its extensive range. This launch complemented the brand’s existing portfolio, which boasts an array of flavors, including Watermelon Wonder, Tangerine Dream, Guava Goddess, Tantric Turmeric, and Heart Beet.

Frequently Asked Questions (FAQ):

To speak to our analyst for a discussion on the above findings, click Speak to Analyst

TABLE OF CONTENTS
 
1 INTRODUCTION (Page No. - 25)
    1.1 STUDY OBJECTIVES 
    1.2 MARKET DEFINITION 
    1.3 STUDY SCOPE 
           1.3.1 MARKET SEGMENTATION
           1.3.2 INCLUSIONS & EXCLUSIONS
           1.3.3 REGIONS COVERED
    1.4 YEARS CONSIDERED 
    1.5 CURRENCY CONSIDERED 
           TABLE 1 USD EXCHANGE RATES, 2019–2023
    1.6 VOLUME UNIT CONSIDERED 
    1.7 STAKEHOLDERS 
    1.8 SUMMARY OF CHANGES 
           1.8.1 RECESSION IMPACT
 
2 RESEARCH METHODOLOGY (Page No. - 32)
    2.1 RESEARCH DATA 
           FIGURE 1 KOMBUCHA MARKET: RESEARCH DESIGN
           2.1.1 SECONDARY DATA
                    2.1.1.1 Key data from secondary sources
           2.1.2 PRIMARY DATA
                    2.1.2.1 Key industry insights
                    2.1.2.2 Breakdown of primaries
    2.2 MARKET SIZE ESTIMATION 
           2.2.1 BOTTOM-UP APPROACH
                    FIGURE 2 KOMBUCHA MARKET: DEMAND-SIDE CALCULATION
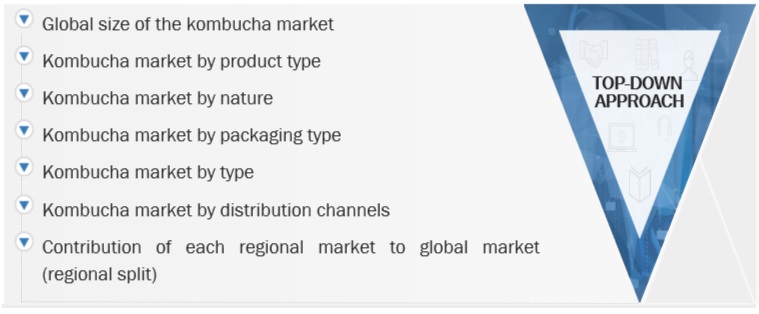
           2.2.2 TOP-DOWN APPROACH
                    2.2.2.1 Approach to estimate market size using top-down analysis
                               FIGURE 3 KOMBUCHA MARKET SIZE ESTIMATION STEPS AND RESPECTIVE SOURCES: SUPPLY SIDE
    2.3 DATA TRIANGULATION 
           FIGURE 4 DATA TRIANGULATION METHODOLOGY
    2.4 RESEARCH ASSUMPTIONS 
    2.5 LIMITATIONS AND RISK ASSESSMENT 
    2.6 IMPACT OF RECESSION ON KOMBUCHA MARKET 
           2.6.1 RECESSION MACRO-INDICATORS
                    FIGURE 5 INDICATORS OF RECESSION
                    FIGURE 6 GLOBAL INFLATION RATE, 2011–2022
                    FIGURE 7 GLOBAL GDP, 2011–2022 (USD TRILLION)
                    FIGURE 8 RECESSION INDICATORS AND THEIR IMPACT ON KOMBUCHA MARKET
                    FIGURE 9 KOMBUCHA MARKET: EARLIER FORECAST VS. RECESSION FORECAST
 
3 EXECUTIVE SUMMARY (Page No. - 43)
    TABLE 2 KOMBUCHA MARKET SNAPSHOT, 2024 VS. 2029 
    FIGURE 10 KOMBUCHA MARKET, BY TYPE, 2024 VS. 2029 (USD MILLION) 
    FIGURE 11 MARKET, BY PRODUCT TYPE, 2024 VS. 2029 (USD MILLION) 
    FIGURE 12 MARKET, BY NATURE, 2024 VS. 2029 (USD MILLION) 
    FIGURE 13 MARKET, BY PACKAGING TYPE, 2024 VS. 2029 (USD MILLION) 
    FIGURE 14 MARKET, BY DISTRIBUTION CHANNEL, 2024 VS. 2029 (USD MILLION) 
    FIGURE 15 MARKET SHARE (VALUE), BY REGION, 2023 
 
4 PREMIUM INSIGHTS (Page No. - 48)
    4.1 ATTRACTIVE OPPORTUNITIES FOR PLAYERS IN KOMBUCHA MARKET 
           FIGURE 16 RISING HEALTH CONSCIOUSNESS AMONG PEOPLE AND AWARENESS REGARDING HEALTH BENEFITS OF KOMBUCHA TO DRIVE MARKET
    4.2 EUROPE: KOMBUCHA MARKET, BY PRODUCT TYPE AND KEY COUNTRY 
           FIGURE 17 CONVENTIONAL SEGMENT AND SPAIN ACCOUNTED FOR SIGNIFICANT MARKET SHARE IN 2023
    4.3 KOMBUCHA MARKET, BY DISTRIBUTION CHANNEL 
           FIGURE 18 SUPERMARKETS/HYPERMARKETS SEGMENT TO LEAD MARKET BY 2029
    4.4 KOMBUCHA MARKET, BY PACKAGING TYPE 
           FIGURE 19 BOTTLES SEGMENT TO DOMINATE KOMBUCHA MARKET DURING FORECAST PERIOD
    4.5 KOMBUCHA MARKET, BY PRODUCT TYPE 
           FIGURE 20 CONVENTIONAL SEGMENT TO LEAD MARKET DURING REVIEW PERIOD
    4.6 KOMBUCHA MARKET, BY NATURE 
           FIGURE 21 ORGANIC SEGMENT TO ACCOUNT FOR LARGER SHARE BY 2029
    4.7 KOMBUCHA MARKET, BY TYPE 
           FIGURE 22 FLAVORED SEGMENT TO ACCOUNT FOR LARGER SHARE DURING FORECAST PERIOD
 
5 KOMBUCHA MARKET OVERVIEW (Page No. - 52)
    5.1 INTRODUCTION 
    5.2 MACROECONOMIC INDICATORS 
           5.2.1 INCREASE IN CONSUMER SPENDING
                    FIGURE 23 GROSS VALUE ADDED TO UK AGRI-FOOD SECTOR, 2021
           5.2.2 INCREASE IN ACCEPTANCE OF ALCOHOL-BASED DRINKS
    5.3 MARKET DYNAMICS 
           FIGURE 24 KOMBUCHA MARKET: MARKET DYNAMICS
           5.3.1 DRIVERS
                    5.3.1.1 Increase in gastrointestinal (GI) diseases
                    5.3.1.2 Spike in demand for alternatives to sugary beverages
                               FIGURE 25 CONSUMER RESEARCH CONDUCTED BY SUGAR ASSOCIATION IN 2021
                    5.3.1.3 Shift toward organic or natural products
           5.3.2 RESTRAINTS
                    5.3.2.1 Need for effective distribution and storage strategies
                    5.3.2.2 Stringent regulatory requirements
           5.3.3 OPPORTUNITIES
                    5.3.3.1 Increasing expansion into new domestic and international markets
                    5.3.3.2 Increase in retail beverage sales
           5.3.4 CHALLENGES
                    5.3.4.1 Exorbitant price of kombucha drinks
                    5.3.4.2 Divergence in taste preferences
 
6 KOMBUCHA INDUSTRY TRENDS (Page No. - 59)
    6.1 INTRODUCTION 
    6.2 VALUE CHAIN ANALYSIS 
           6.2.1 RESEARCH & PRODUCT DEVELOPMENT
           6.2.2 MANUFACTURING
           6.2.3 MARKETING & SALES
           6.2.4 DISTRIBUTION
           6.2.5 POST-SALE SERVICES
                    FIGURE 26 VALUE CHAIN ANALYSIS
    6.3 TECHNOLOGY ANALYSIS 
           6.3.1 AIR KNIFE TECHNOLOGY
           6.3.2 HIGH PRESSURE PROCESSING (HPP)
    6.4 PATENT ANALYSIS 
           FIGURE 27 PATENTS GRANTED FOR KOMBUCHA MARKET, 2014–2024
           FIGURE 28 REGIONAL ANALYSIS OF PATENT GRANTED FOR KOMBUCHA MARKET, 2014–2024
           6.4.1 LIST OF MAJOR PATENTS, 2014–2024
    6.5 ECOSYSTEM ANALYSIS/MARKET MAP 
           6.5.1 DEMAND SIDE
           6.5.2 SUPPLY SIDE
                    TABLE 3 KOMBUCHA MARKET ECOSYSTEM
                    FIGURE 29 KOMBUCHA: MARKET MAP
    6.6 TRADE ANALYSIS 
           TABLE 4 EXPORT VALUE OF KOMBUCHA, BY KEY COUNTRY, 2022 (USD MILLION)
           TABLE 5 IMPORT VALUE OF KOMBUCHA, BY KEY COUNTRY, 2022 (USD MILLION)
           TABLE 6 EXPORT VALUE OF KOMBUCHA, BY KEY COUNTRY, 2021 (USD MILLION)
           TABLE 7 IMPORT VALUE OF KOMBUCHA, BY KEY COUNTRY, 2021 (USD MILLION)
    6.7 PRICING ANALYSIS 
           6.7.1 AVERAGE SELLING PRICE TREND OF KEY PLAYERS, BY PACKAGING TYPE
                    FIGURE 30 AVERAGE SELLING PRICE TREND OF KEY PLAYERS, BY PACKAGING TYPE, 2023
                    TABLE 8 AVERAGE SELLING PRICE (ASP) TREND OF KEY PLAYERS, BY PACKAGING TYPE, 2023 (USD/TON)
           6.7.2 AVERAGE SELLING PRICE (ASP) TREND, BY PACKAGING TYPE
                    FIGURE 31 AVERAGE SELLING PRICE TREND, BY PACKAGING TYPE
                    TABLE 9 AVERAGE SELLING PRICE (ASP) TREND OF KOMBUCHA, BY PACKAGING TYPE, 2019–2023 (USD/TON)
           6.7.3 AVERAGE SELLING PRICE (ASP) TREND OF KOMBUCHA, BY REGION
                    FIGURE 32 AVERAGE SELLING PRICE TREND, BY BOTTLES PACKAGING TYPE
                    FIGURE 33 AVERAGE SELLING PRICE TREND, BY CANS PACKAGING TYPE
    6.8 TRENDS/DISRUPTIONS IMPACTING CUSTOMERS’ BUSINESSES 
           FIGURE 34 REVENUE SHIFT FOR KOMBUCHA MARKET
    6.9 KEY CONFERENCES & EVENTS (2024–2025) 
           TABLE 10 KOMBUCHA MARKET: LIST OF CONFERENCES & EVENTS
    6.1 REGULATORY LANDSCAPE 
           6.10.1 REGULATORY BODIES, GOVERNMENT AGENCIES, AND OTHER ORGANIZATIONS
                    TABLE 11 NORTH AMERICA: LIST OF REGULATORY BODIES, GOVERNMENT AGENCIES, AND OTHER ORGANIZATIONS
                    TABLE 12 EUROPE: LIST OF REGULATORY BODIES, GOVERNMENT AGENCIES, AND OTHER ORGANIZATIONS
                    TABLE 13 ASIA PACIFIC: LIST OF REGULATORY BODIES, GOVERNMENT AGENCIES, AND OTHER ORGANIZATIONS
           6.10.2 REGULATORY LANDSCAPE
                    6.10.2.1 North America
                               6.10.2.1.1 US
                               6.10.2.1.2 Canada
                               6.10.2.1.3 Mexico
                    6.10.2.2 Europe
                               6.10.2.2.1 Germany
                               6.10.2.2.2 France
                    6.10.2.3 Asia Pacific
                               6.10.2.3.1 China
                               6.10.2.3.2 India
                               6.10.2.3.3 Australia
                               6.10.2.3.4 Thailand
                    6.10.2.4 South America
                               6.10.2.4.1 Brazil
                               6.10.2.4.2 Argentina
                    6.10.2.5 Rest of the World
                               6.10.2.5.1 South Africa
                               6.10.2.5.2 UAE
                               6.10.2.5.3 Nigeria
    6.11 CASE STUDY ANALYSIS 
           6.11.1 BREW DR. KOMBUCHA UTILIZED SOCIAL MEDIA TO INCREASE BRAND AWARENESS
           6.11.2 HEALTH-ADE KOMBUCHA LEVERAGED INFLUENCERS FOR BRAND GROWTH
           6.11.3 GREAT LITTLE BOX COMPANY’S PACKAGING SOLUTION HELPED HEALTHY HOOCH CONTROL EXPENSES
    6.12 PORTER’S FIVE FORCES ANALYSIS 
                    TABLE 14 PORTER’S FIVE FORCES ANALYSIS
                    FIGURE 35 KOMBUCHA MARKET: PORTER’S FIVE FORCES ANALYSIS
           6.12.1 INTENSITY OF COMPETITIVE RIVALRY
           6.12.2 BARGAINING POWER OF SUPPLIERS
           6.12.3 BARGAINING POWER OF BUYERS
           6.12.4 THREAT OF SUBSTITUTES
           6.12.5 THREAT OF NEW ENTRANTS
    6.13 KEY STAKEHOLDERS & BUYING CRITERIA 
           6.13.1 KEY STAKEHOLDERS IN BUYING PROCESS
                    FIGURE 36 INFLUENCE OF STAKEHOLDERS ON BUYING PROCESS FOR KEY TYPES
                    TABLE 15 INFLUENCE OF STAKEHOLDERS ON BUYING PROCESS FOR ORGANIC AND INORGANIC KOMBUCHA TYPES
           6.13.2 BUYING CRITERIA
                    FIGURE 37 BUYING CRITERIA
                    TABLE 16 KEY BUYING CRITERIA FOR KEY TYPES
    6.14 INVESTMENT AND FUNDING SCENARIO 
                    FIGURE 38 INVESTMENT AND FUNDING SCENARIO OF FEW MAJOR PLAYERS
 
7 KOMBUCHA MARKET, BY TYPE (Page No. - 86)
    7.1 INTRODUCTION 
           FIGURE 39 KOMBUCHA MARKET, BY TYPE, 2024 VS. 2029 (USD MILLION)
           TABLE 17 KOMBUCHA MARKET, BY TYPE, 2019–2023 (USD MILLION)
           TABLE 18 MARKET, BY TYPE, 2024–2029 (USD MILLION)
    7.2 NATURAL (UNFLAVORED) 
           7.2.1 MINIMAL PROCESSING AND USE OF ADDITIVES TO FUEL DEMAND FOR NATURAL KOMBUCHA
                    TABLE 19 NÂBÂ KOMBUCHA PRODUCTS’ DATASHEET
                    TABLE 20 NATURAL: KOMBUCHA MARKET, BY REGION, 2019–2023 (USD MILLION)
                    TABLE 21 NATURAL: MARKET, BY REGION, 2024–2029 (USD MILLION)
    7.3 FLAVORED 
           7.3.1 RISING CULINARY EXPLORATION AND EXPERIMENTATION TO DRIVE DEMAND FOR UNIQUE AND INNOVATIVE FLAVOR COMBINATIONS OF KOMBUCHA
                    TABLE 22 FLAVORED: KOMBUCHA MARKET, BY REGION, 2019–2023 (USD MILLION)
                    TABLE 23 FLAVORED: MARKET, BY REGION, 2024–2029 (USD MILLION)
           7.3.2 HERBS & SPICES
                    TABLE 24 HERBS & SPICES: KOMBUCHA MARKET, BY REGION, 2019–2023 (USD MILLION)
                    TABLE 25 HERBS & SPICES: MARKET, BY REGION, 2024–2029 (USD MILLION)
           7.3.3 CITRUS
                    TABLE 26 CITRUS: KOMBUCHA MARKET, BY REGION, 2019–2023 (USD MILLION)
                    TABLE 27 CITRUS: MARKET, BY REGION, 2024–2029 (USD MILLION)
           7.3.4 BERRIES
                    TABLE 28 BERRIES: KOMBUCHA MARKET, BY REGION, 2019–2023 (USD MILLION)
                    TABLE 29 BERRIES: MARKET, BY REGION, 2024–2029 (USD MILLION)
           7.3.5 APPLE
                    TABLE 30 APPLE: KOMBUCHA MARKET, BY REGION, 2019–2023 (USD MILLION)
                    TABLE 31 APPLE: MARKET, BY REGION, 2024–2029 (USD MILLION)
           7.3.6 FLOWERS
                    TABLE 32 FLOWERS: KOMBUCHA MARKET, BY REGION, 2019–2023 (USD MILLION)
                    TABLE 33 FLOWERS: MARKET, BY REGION, 2024–2029 (USD MILLION)
           7.3.7 OTHER FLAVORS
                    TABLE 34 OTHER FLAVORS: KOMBUCHA MARKET, BY REGION, 2019–2023 (USD MILLION)
                    TABLE 35 OTHER FLAVORS: MARKET, BY REGION, 2024–2029 (USD MILLION)
 
8 KOMBUCHA MARKET, BY NATURE (Page No. - 98)
    8.1 INTRODUCTION 
           FIGURE 40 KOMBUCHA MARKET, BY NATURE, 2024 VS. 2029 (USD MILLION)
           TABLE 36 MARKET, BY NATURE, 2019–2023 (USD MILLION)
           TABLE 37 MARKET, BY NATURE, 2024–2029 (USD MILLION)
    8.2 ORGANIC 
           8.2.1 RISING POPULATION OF HEALTH-CONSCIOUS CONSUMERS TO DRIVE CONSUMPTION OF ORGANIC KOMBUCHA
                    TABLE 38 ORGANIC: KOMBUCHA MARKET, BY REGION, 2019–2023 (USD MILLION)
                    TABLE 39 ORGANIC: MARKET, BY REGION, 2024–2029 (USD MILLION)
    8.3 INORGANIC 
           8.3.1 AFFORDABILITY AND AVAILABILITY OF INORGANIC KOMBUCHA TO BOOST ITS CONSUMPTION
                    TABLE 40 INORGANIC: KOMBUCHA MARKET, BY REGION, 2019–2023 (USD MILLION)
                    TABLE 41 INORGANIC: MARKET, BY REGION, 2024–2029 (USD MILLION)
 
9 KOMBUCHA MARKET, BY PRODUCT TYPE (Page No. - 103)
    9.1 INTRODUCTION 
           FIGURE 41 KOMBUCHA MARKET, BY PRODUCT TYPE, 2024 VS. 2029 (USD MILLION)
           TABLE 42 MARKET, BY PRODUCT TYPE, 2019–2023 (USD MILLION)
           TABLE 43 MARKET, BY PRODUCT TYPE, 2024–2029 (USD MILLION)
    9.2 HARD 
           9.2.1 LIFESTYLE TRENDS SUCH AS MINDFUL DRINKING TO CREATE DEMAND FOR HARD KOMBUCHA
                    TABLE 44 HARD: KOMBUCHA MARKET, BY REGION, 2019–2023 (USD MILLION)
                    TABLE 45 HARD: MARKET, BY REGION, 2024–2029 (USD MILLION)
    9.3 CONVENTIONAL 
           9.3.1 CONSUMERS SEEKING PROBIOTIC HEALTH BEVERAGES TO PREFER CONVENTIONAL KOMBUCHA OVER HARD KOMBUCHA
                    TABLE 46 CONVENTIONAL: KOMBUCHA MARKET, BY REGION, 2019–2023 (USD MILLION)
                    TABLE 47 CONVENTIONAL: MARKET, BY REGION, 2024–2029 (USD MILLION)
 
10 KOMBUCHA MARKET, BY PACKAGING TYPE (Page No. - 108)
     10.1 INTRODUCTION 
               FIGURE 42 KOMBUCHA MARKET, BY PACKAGING TYPE, 2024 VS. 2029 (USD MILLION)
               TABLE 48 MARKET, BY PACKAGING TYPE, 2019–2023 (USD MILLION)
               TABLE 49 MARKET, BY PACKAGING TYPE, 2024–2029 (USD MILLION)
               TABLE 50 MARKET, BY PACKAGING TYPE, 2019–2023 (KT)
               TABLE 51 MARKET, BY PACKAGING TYPE, 2024–2029 (KT)
     10.2 CANS 
             10.2.1 CONVENIENCE AND PRESERVATION CONSIDERATIONS TO ENCOURAGE MANUFACTURERS TO USE CANS FOR PACKAGING
                       TABLE 52 CANS: KOMBUCHA MARKET, BY REGION, 2019–2023 (USD MILLION)
                       TABLE 53 CANS: MARKET, BY REGION, 2024–2029 (USD MILLION)
                       TABLE 54 CANS: MARKET, BY REGION, 2019–2023 (KT)
                       TABLE 55 CANS: MARKET, BY REGION, 2024–2029 (KT)
     10.3 BOTTLES 
             10.3.1 TRADITIONAL ASSOCIATION OF PEOPLE WITH QUALITY AND AUTHENTICITY TO MOTIVATE MANUFACTURERS TO FAVOR BOTTLES
                       TABLE 56 BOTTLES: KOMBUCHA MARKET, BY REGION, 2019–2023 (USD MILLION)
                       TABLE 57 BOTTLES: MARKET, BY REGION, 2024–2029 (USD MILLION)
                       TABLE 58 BOTTLES: MARKET, BY REGION, 2019–2023 (KT)
                       TABLE 59 BOTTLES: MARKET, BY REGION, 2024–2029 (KT)
 
11 KOMBUCHA MARKET, BY DISTRIBUTION CHANNEL (Page No. - 115)
     11.1 INTRODUCTION 
               FIGURE 43 KOMBUCHA MARKET, BY DISTRIBUTION CHANNEL, 2024 VS. 2029 (USD MILLION)
               TABLE 60 MARKET, BY DISTRIBUTION CHANNEL, 2019–2023 (USD MILLION)
               TABLE 61 MARKET, BY DISTRIBUTION CHANNEL, 2024–2029 (USD MILLION)
     11.2 SUPERMARKETS/HYPERMARKETS 
             11.2.1 SUPERMARKETS AND HYPERMARKETS SERVE AS CONVENIENT POINTS FOR CONSUMERS
                       TABLE 62 SUPERMARKETS/HYPERMARKETS: KOMBUCHA MARKET, BY REGION, 2019–2023 (USD MILLION)
                       TABLE 63 SUPERMARKETS/HYPERMARKETS: MARKET, BY REGION, 2024–2029 (USD MILLION)
     11.3 ONLINE RETAILERS 
             11.3.1 GROWING POPULARITY OF E-COMMERCE AND AVAILABILITY OF RANGE OF BRANDS AND FLAVORS TO SPUR MARKET
                       TABLE 64 ONLINE RETAILERS: KOMBUCHA MARKET, BY REGION, 2019–2023 (USD MILLION)
                       TABLE 65 ONLINE RETAILERS: MARKET, BY REGION, 2024–2029 (USD MILLION)
     11.4 SPECIALIST STORES 
             11.4.1 DEMAND FOR UNIQUE SHOPPING EXPERIENCE TO FUEL DEMAND FOR KOMBUCHA DRINKS
                       TABLE 66 SPECIALIST STORES: KOMBUCHA MARKET, BY REGION, 2019–2023 (USD MILLION)
                       TABLE 67 SPECIALIST STORES: MARKET, BY REGION, 2024–2029 (USD MILLION)
     11.5 CONVENIENCE STORES 
             11.5.1 DEMAND FOR QUICK AND HASSLE-FREE SHOPPING EXPERIENCE TO PROPEL MARKET GROWTH
                       TABLE 68 CONVENIENCE STORES: KOMBUCHA MARKET, BY REGION, 2019–2023 (USD MILLION)
                       TABLE 69 CONVENIENCE STORES: MARKET, BY REGION, 2024–2029 (USD MILLION)
     11.6 OTHER DISTRIBUTION CHANNELS 
               TABLE 70 OTHER DISTRIBUTION CHANNELS: KOMBUCHA MARKET, BY REGION, 2019–2023 (USD MILLION)
               TABLE 71 OTHER DISTRIBUTION CHANNELS: MARKET, BY REGION, 2024–2029 (USD MILLION)
 
12 KOMBUCHA MARKET, BY REGION (Page No. - 123)
     12.1 INTRODUCTION 
               FIGURE 44 SPAIN TO RECORD HIGHEST GROWTH IN KOMBUCHA MARKET
               TABLE 72 KOMBUCHA MARKET, BY REGION, 2019–2023 (USD MILLION)
               TABLE 73 MARKET, BY REGION, 2024–2029 (USD MILLION)
               TABLE 74 MARKET, BY REGION, 2019–2023 (KT)
               TABLE 75 MARKET, BY REGION, 2024–2029 (KT)
     12.2 NORTH AMERICA 
             12.2.1 NORTH AMERICA: RECESSION IMPACT
                       FIGURE 45 NORTH AMERICA: RECESSION IMPACT ANALYSIS, 2024
                       FIGURE 46 NORTH AMERICAN KOMBUCHA MARKET SNAPSHOT
                       TABLE 76 NORTH AMERICA: KOMBUCHA MARKET, BY COUNTRY, 2019–2023 (USD MILLION)
                       TABLE 77 NORTH AMERICA: MARKET, BY COUNTRY, 2024–2029 (USD MILLION)
                       TABLE 78 NORTH AMERICA: MARKET, BY NATURE, 2019–2023 (USD MILLION)
                       TABLE 79 NORTH AMERICA: MARKET, BY NATURE, 2024–2029 (USD MILLION)
                       TABLE 80 NORTH AMERICA: MARKET, BY PRODUCT TYPE, 2019–2023 (USD MILLION)
                       TABLE 81 NORTH AMERICA: MARKET, BY PRODUCT TYPE, 2024–2029 (USD MILLION)
                       TABLE 82 NORTH AMERICA: MARKET, BY TYPE, 2019–2023 (USD MILLION)
                       TABLE 83 NORTH AMERICA: MARKET, BY TYPE, 2024–2029 (USD MILLION)
                       TABLE 84 NORTH AMERICA: MARKET, BY PACKAGING TYPE, 2019–2023 (USD MILLION)
                       TABLE 85 NORTH AMERICA: MARKET, BY PACKAGING TYPE, 2024–2029 (USD MILLION)
                       TABLE 86 NORTH AMERICA: MARKET, BY PACKAGING TYPE, 2019–2023 (KT)
                       TABLE 87 NORTH AMERICA: MARKET, BY PACKAGING TYPE, 2024–2029 (KT)
                       TABLE 88 NORTH AMERICA: MARKET, BY DISTRIBUTION CHANNEL, 2019–2023 (USD MILLION)
                       TABLE 89 NORTH AMERICA: MARKET, BY DISTRIBUTION CHANNEL, 2024–2029 (USD MILLION)
             12.2.2 US
                       12.2.2.1 Major players in US to serve as catalysts for expansion of kombucha market
                                   TABLE 90 US: TOP 33 STATES IN TERMS OF NUMBER OF COMMERCIAL BRANDS, 2020
                                   TABLE 91 US: KOMBUCHA MARKET, BY NATURE, 2019–2023 (USD MILLION)
                                   TABLE 92 US: MARKET, BY NATURE, 2024–2029 (USD MILLION)
             12.2.3 CANADA
                       12.2.3.1 Rise in deaths caused by digestive problems to fuel demand for kombucha
                                   FIGURE 47 NUMBER OF DEATHS CAUSED BY DIGESTIVE PROBLEMS IN CANADA, 2018–2022
                                   TABLE 93 CANADA: KOMBUCHA MARKET, BY NATURE, 2019–2023 (USD MILLION)
                                   TABLE 94 CANADA: MARKET, BY NATURE, 2024–2029 (USD MILLION)
             12.2.4 MEXICO
                       12.2.4.1 Presence of small and regional brands to fuel growth of kombucha market
                                   TABLE 95 MEXICO: KOMBUCHA MARKET, BY NATURE, 2019–2023 (USD MILLION)
                                   TABLE 96 MEXICO: MARKET, BY NATURE, 2024–2029 (USD MILLION)
     12.3 EUROPE 
             12.3.1 EUROPE: RECESSION IMPACT
                       FIGURE 48 EUROPE: RECESSION IMPACT ANALYSIS, 2024
                       FIGURE 49 EUROPEAN KOMBUCHA MARKET SNAPSHOT
                       TABLE 97 EUROPE: KOMBUCHA MARKET, BY COUNTRY, 2019–2023 (USD MILLION)
                       TABLE 98 EUROPE: KOMBUCHA MARKET, BY COUNTRY, 2024–2029 (USD MILLION)
                       TABLE 99 EUROPE: MARKET, BY NATURE, 2019–2023 (USD MILLION)
                       TABLE 100 EUROPE: MARKET, BY NATURE, 2024–2029 (USD MILLION)
                       TABLE 101 EUROPE: MARKET, BY PRODUCT TYPE, 2019–2023 (USD MILLION)
                       TABLE 102 EUROPE: MARKET, BY PRODUCT TYPE, 2024–2029 (USD MILLION)
                       TABLE 103 EUROPE: MARKET, BY PACKAGING TYPE, 2019–2023 (USD MILLION)
                       TABLE 104 EUROPE: MARKET, BY PACKAGING TYPE, 2024–2029 (USD MILLION)
                       TABLE 105 EUROPE: MARKET, BY PACKAGING TYPE, 2019–2023 (KT)
                       TABLE 106 EUROPE: MARKET, BY PACKAGING TYPE, 2024–2029 (KT)
                       TABLE 107 EUROPE: MARKET, BY TYPE, 2019–2023 (USD MILLION)
                       TABLE 108 EUROPE: MARKET, BY TYPE, 2024–2029 (USD MILLION)
                       TABLE 109 EUROPE: MARKET, BY DISTRIBUTION CHANNEL, 2019–2023 (USD MILLION)
                       TABLE 110 EUROPE: MARKET, BY DISTRIBUTION CHANNEL, 2024–2029 (USD MILLION)
             12.3.2 FRANCE
                       12.3.2.1 Increased tax on sugary drinks to create opportunity for manufacturers to enter growing kombucha market
                                   TABLE 111 FRANCE: KOMBUCHA MARKET, BY NATURE, 2019–2023 (USD MILLION)
                                   TABLE 112 FRANCE: MARKET, BY NATURE, 2024–2029 (USD MILLION)
             12.3.3 SPAIN
                       12.3.3.1 Increasing population of health-conscious consumers seeking natural, probiotic-rich alternatives to traditional beverages to fuel demand
                                   TABLE 113 SPAIN: KOMBUCHA MARKET, BY NATURE, 2019–2023 (USD MILLION)
                                   TABLE 114 SPAIN: MARKET, BY NATURE, 2024–2029 (USD MILLION)
             12.3.4 ITALY
                       12.3.4.1 Popularity of organic beverages to create favorable environment for kombucha drinks
                                   FIGURE 50 ORGANIC BEVERAGE CONSUMPTION IN ITALY, 2018–2025
                                   TABLE 115 ITALY: KOMBUCHA MARKET, BY NATURE, 2019–2023 (USD MILLION)
                                   TABLE 116 ITALY: MARKET, BY NATURE, 2024–2029 (USD MILLION)
             12.3.5 GERMANY
                       12.3.5.1 Presence of small and regional brands to spur growth of kombucha market
                                   TABLE 117 GERMANY: KOMBUCHA MARKET, BY NATURE, 2019–2023 (USD MILLION)
                                   TABLE 118 GERMANY: MARKET, BY NATURE, 2024–2029 (USD MILLION)
             12.3.6 UK
                       12.3.6.1 Rising government initiatives and support to encourage beverage manufacturers to invest in product developments
                                   TABLE 119 UK: KOMBUCHA MARKET, BY NATURE, 2019–2023 (USD MILLION)
                                   TABLE 120 UK: MARKET, BY NATURE, 2024–2029 (USD MILLION)
             12.3.7 REST OF EUROPE
                       TABLE 121 REST OF EUROPE: KOMBUCHA MARKET, BY NATURE, 2019–2023 (USD MILLION)
                       TABLE 122 REST OF EUROPE: MARKET, BY NATURE, 2024–2029 (USD MILLION)
     12.4 ASIA PACIFIC 
             12.4.1 ASIA PACIFIC: RECESSION IMPACT
                       FIGURE 51 ASIA PACIFIC: RECESSION IMPACT ANALYSIS, 2024
                       TABLE 123 ASIA PACIFIC: KOMBUCHA MARKET, BY COUNTRY, 2019–2023 (USD MILLION)
                       TABLE 124 ASIA PACIFIC: MARKET, BY COUNTRY, 2024–2029 (USD MILLION)
                       TABLE 125 ASIA PACIFIC: MARKET, BY NATURE, 2019–2023 (USD MILLION)
                       TABLE 126 ASIA PACIFIC: MARKET, BY NATURE, 2024–2029 (USD MILLION)
                       TABLE 127 ASIA PACIFIC: MARKET, BY PRODUCT TYPE, 2019–2023 (USD MILLION)
                       TABLE 128 ASIA PACIFIC: MARKET, BY PRODUCT TYPE, 2024–2029 (USD MILLION)
                       TABLE 129 ASIA PACIFIC: MARKET, BY PACKAGING TYPE, 2019–2023 (USD MILLION)
                       TABLE 130 ASIA PACIFIC: MARKET, BY PACKAGING TYPE, 2024–2029 (USD MILLION)
                       TABLE 131 ASIA PACIFIC: MARKET, BY PACKAGING TYPE, 2019–2023 (KT)
                       TABLE 132 ASIA PACIFIC: MARKET, BY PACKAGING TYPE, 2024–2029 (KT)
                       TABLE 133 ASIA PACIFIC: MARKET, BY TYPE, 2019–2023 (USD MILLION)
                       TABLE 134 ASIA PACIFIC: MARKET, BY TYPE, 2024–2029 (USD MILLION)
                       TABLE 135 ASIA PACIFIC: MARKET, BY DISTRIBUTION CHANNEL, 2019–2023 (USD MILLION)
                       TABLE 136 ASIA PACIFIC: MARKET, BY DISTRIBUTION CHANNEL, 2024–2029 (USD MILLION)
             12.4.2 AUSTRALIA & NEW ZEALAND
                       12.4.2.1 Rising preference for natural and functional beverages to fuel demand
                                   TABLE 137 AUSTRALIA & NEW ZEALAND: KOMBUCHA MARKET, BY NATURE, 2019–2023 (USD MILLION)
                                   TABLE 138 AUSTRALIA & NEW ZEALAND: MARKET, BY NATURE, 2024–2029 (USD MILLION)
             12.4.3 CHINA
                       12.4.3.1 Challenges faced by beverage lovers in managing their sugar intake to drive demand for kombucha
                                   TABLE 139 CHINA: KOMBUCHA MARKET, BY NATURE, 2019–2023 (USD MILLION)
                                   TABLE 140 CHINA: MARKET, BY NATURE, 2024–2029 (USD MILLION)
             12.4.4 JAPAN
                       12.4.4.1 Japan’s commitment to global health initiatives to benefit market expansion
                                   TABLE 141 JAPAN: KOMBUCHA MARKET, BY NATURE, 2019–2023 (USD MILLION)
                                   TABLE 142 JAPAN: MARKET, BY NATURE, 2024–2029 (USD MILLION)
             12.4.5 INDIA
                       12.4.5.1 Rising demand for nutritional food products to encourage market expansion
                                   TABLE 143 INDIA: KOMBUCHA MARKET, BY NATURE, 2019–2023 (USD MILLION)
                                   TABLE 144 INDIA: MARKET, BY NATURE, 2024–2029 (USD MILLION)
             12.4.6 THAILAND
                       12.4.6.1 Increased consumption by young and adventurous population to prove lucrative for kombucha’s market growth
                                   TABLE 145 THAILAND: KOMBUCHA MARKET, BY NATURE, 2019–2023 (USD MILLION)
                                   TABLE 146 THAILAND: MARKET, BY NATURE, 2024–2029 (USD MILLION)
             12.4.7 REST OF ASIA PACIFIC
                                   TABLE 147 REST OF ASIA PACIFIC: KOMBUCHA MARKET, BY NATURE, 2019–2023 (USD MILLION)
                                   TABLE 148 REST OF ASIA PACIFIC: MARKET, BY NATURE, 2024–2029 (USD MILLION)
     12.5 SOUTH AMERICA 
             12.5.1 SOUTH AMERICA: RECESSION IMPACT
                       FIGURE 52 SOUTH AMERICA: RECESSION IMPACT ANALYSIS, 2024
                       TABLE 149 SOUTH AMERICA: KOMBUCHA MARKET, BY COUNTRY, 2019–2023 (USD MILLION)
                       TABLE 150 SOUTH AMERICA: MARKET, BY COUNTRY, 2024–2029 (USD MILLION)
                       TABLE 151 SOUTH AMERICA: MARKET, BY NATURE, 2019–2023 (USD MILLION)
                       TABLE 152 SOUTH AMERICA: MARKET, BY NATURE, 2024–2029 (USD MILLION)
                       TABLE 153 SOUTH AMERICA: MARKET, BY PRODUCT TYPE, 2019–2023 (USD MILLION)
                       TABLE 154 SOUTH AMERICA: MARKET, BY PRODUCT TYPE, 2024–2029 (USD MILLION)
                       TABLE 155 SOUTH AMERICA: MARKET, BY PACKAGING TYPE, 2019–2023 (USD MILLION)
                       TABLE 156 SOUTH AMERICA: MARKET, BY PACKAGING TYPE, 2024–2029 (USD MILLION)
                       TABLE 157 SOUTH AMERICA: MARKET, BY PACKAGING TYPE, 2019–2023 (KT)
                       TABLE 158 SOUTH AMERICA: MARKET, BY PACKAGING TYPE, 2024–2029 (KT)
                       TABLE 159 SOUTH AMERICA: MARKET, BY TYPE, 2019–2023 (USD MILLION)
                       TABLE 160 SOUTH AMERICA: MARKET, BY TYPE, 2024–2029 (USD MILLION)
                       TABLE 161 SOUTH AMERICA: MARKET, BY DISTRIBUTION CHANNEL, 2019–2023 (USD MILLION)
                       TABLE 162 SOUTH AMERICA: MARKET, BY DISTRIBUTION CHANNEL, 2024–2029 (USD MILLION)
             12.5.2 BRAZIL
                       12.5.2.1 Rising preference for natural and functional beverages to drive market
                                   TABLE 163 BRAZIL: KOMBUCHA MARKET, BY NATURE, 2019–2023 (USD MILLION)
                                   TABLE 164 BRAZIL: MARKET, BY NATURE, 2024–2029 (USD MILLION)
             12.5.3 ARGENTINA
                       12.5.3.1 Regulatory resolution of kombucha to lead to market growth
                                   TABLE 165 ARGENTINA: KOMBUCHA MARKET, BY NATURE, 2019–2023 (USD MILLION)
                                   TABLE 166 ARGENTINA: MARKET, BY NATURE, 2024–2029 (USD MILLION)
             12.5.4 REST OF SOUTH AMERICA
                       TABLE 167 REST OF SOUTH AMERICA: KOMBUCHA MARKET, BY NATURE, 2019–2023 (USD MILLION)
                       TABLE 168 REST OF SOUTH AMERICA: MARKET, BY NATURE, 2024–2029 (USD MILLION)
     12.6 REST OF THE WORLD (ROW) 
             12.6.1 ROW: RECESSION IMPACT
                       FIGURE 53 ROW: RECESSION IMPACT ANALYSIS, 2024
                       TABLE 169 ROW: KOMBUCHA MARKET, BY REGION, 2019–2023 (USD MILLION)
                       TABLE 170 ROW: MARKET, BY REGION, 2024–2029 (USD MILLION)
                       TABLE 171 ROW: MARKET, BY NATURE, 2019–2023 (USD MILLION)
                       TABLE 172 ROW: MARKET, BY NATURE, 2024–2029 (USD MILLION)
                       TABLE 173 ROW: MARKET, BY PRODUCT TYPE, 2019–2023 (USD MILLION)
                       TABLE 174 ROW: MARKET, BY PRODUCT TYPE, 2024–2029 (USD MILLION)
                       TABLE 175 ROW: MARKET, BY PACKAGING TYPE, 2019–2023 (USD MILLION)
                       TABLE 176 ROW: MARKET, BY PACKAGING TYPE, 2024–2029 (USD MILLION)
                       TABLE 177 ROW: MARKET, BY PACKAGING TYPE, 2019–2023 (KT)
                       TABLE 178 ROW: MARKET, BY PACKAGING TYPE, 2024–2029 (KT)
                       TABLE 179 ROW: MARKET, BY TYPE, 2019–2023 (USD MILLION)
                       TABLE 180 ROW: MARKET, BY TYPE, 2024–2029 (USD MILLION)
                       TABLE 181 ROW: MARKET, BY DISTRIBUTION CHANNEL, 2019–2023 (USD MILLION)
                       TABLE 182 ROW: MARKET, BY DISTRIBUTION CHANNEL, 2024–2029 (USD MILLION)
             12.6.2 AFRICA
                       TABLE 183 AFRICA: KOMBUCHA MARKET, BY COUNTRY, 2019–2023 (USD MILLION)
                       TABLE 184 AFRICA: MARKET, BY COUNTRY, 2024–2029 (USD MILLION)
                       TABLE 185 AFRICA: MARKET, BY NATURE, 2019–2023 (USD MILLION)
                       TABLE 186 AFRICA: MARKET, BY NATURE, 2024–2029 (USD MILLION)
                       12.6.2.1 South Africa
                                   12.6.2.1.1 Growing popularity of organic products to drive consumption of kombucha
                                   TABLE 187 SOUTH AFRICA: KOMBUCHA MARKET, BY NATURE, 2019–2023 (USD MILLION)
                                   TABLE 188 SOUTH AFRICA: MARKET, BY NATURE, 2024–2029 (USD MILLION)
                       12.6.2.2 Nigeria
                                   12.6.2.2.1 Increasing tax on sugary drinks to create opportunity for manufacturers to enter developing market
                                   TABLE 189 NIGERIA: KOMBUCHA MARKET, BY NATURE, 2019–2023 (USD MILLION)
                                   TABLE 190 NIGERIA: MARKET, BY NATURE, 2024–2029 (USD MILLION)
                       12.6.2.3 Kenya
                                   12.6.2.3.1 Rising awareness regarding health benefits associated with kombucha consumption to increase its popularity
                                   TABLE 191 KENYA: KOMBUCHA MARKET, BY NATURE, 2019–2023 (USD MILLION)
                                   TABLE 192 KENYA: MARKET, BY NATURE, 2024–2029 (USD MILLION)
                       12.6.2.4 Rest of Africa
                                   TABLE 193 REST OF AFRICA: KOMBUCHA MARKET, BY NATURE, 2019–2023 (USD MILLION)
                                   TABLE 194 REST OF AFRICA: MARKET, BY NATURE, 2024–2029 (USD MILLION)
             12.6.3 MIDDLE EAST
                       TABLE 195 MIDDLE EAST: KOMBUCHA MARKET, BY COUNTRY, 2019–2023 (USD MILLION)
                       TABLE 196 MIDDLE EAST: MARKET, BY COUNTRY, 2024–2029 (USD MILLION)
                       TABLE 197 MIDDLE EAST: MARKET, BY NATURE, 2019–2023 (USD MILLION)
                       TABLE 198 MIDDLE EAST: MARKET, BY NATURE, 2024–2029 (USD MILLION)
                       12.6.3.1 Saudi Arabia
                                   12.6.3.1.1 Rising popularity of organic food products to drive kombucha market
                                   TABLE 199 SAUDI ARABIA: KOMBUCHA MARKET, BY NATURE, 2019–2023 (USD MILLION)
                                   TABLE 200 SAUDI ARABIA: MARKET, BY NATURE, 2024–2029 (USD MILLION)
                       12.6.3.2 UAE
                                   12.6.3.2.1 Tax hike on sweetened drinks to create opportunity for manufacturers to enter growing kombucha market
                                   TABLE 201 UAE: KOMBUCHA MARKET, BY NATURE, 2019–2023 (USD MILLION)
                                   TABLE 202 UAE: MARKET, BY NATURE, 2024–2029 (USD MILLION)
                       12.6.3.3 Qatar
                                   12.6.3.3.1 Introduction of tax law on unhealthy products to drive market for healthy beverages, including kombucha
                                   TABLE 203 QATAR: KOMBUCHA MARKET, BY NATURE, 2019–2023 (USD MILLION)
                                   TABLE 204 QATAR: MARKET, BY NATURE, 2024–2029 (USD MILLION)
                       12.6.3.4 Rest of Middle East
                                   TABLE 205 REST OF MIDDLE EAST: KOMBUCHA MARKET, BY NATURE, 2019–2023 (USD MILLION)
                                   TABLE 206 REST OF MIDDLE EAST: MARKET, BY NATURE, 2024–2029 (USD MILLION)
 
13 COMPETITIVE LANDSCAPE (Page No. - 184)
     13.1 OVERVIEW 
     13.2 KEY PLAYERS’ STRATEGIES/RIGHT TO WIN 
               TABLE 207 OVERVIEW OF STRATEGIES ADOPTED BY KEY PLAYERS IN KOMBUCHA MARKET, 2020–2024
     13.3 MARKET SHARE ANALYSIS, 2023 
               TABLE 208 KOMBUCHA MARKET: DEGREE OF COMPETITION
               FIGURE 54 MARKET SHARE ANALYSIS FOR KEY COMPANIES IN 2023
     13.4 BRAND/PRODUCT ANALYSIS 
               FIGURE 55 BRAND/PRODUCT ANALYSIS, BY KOMBUCHA KEY BRAND
     13.5 COMPANY EVALUATION MATRIX: KEY PLAYERS, 2023 
             13.5.1 STARS
             13.5.2 EMERGING LEADERS
             13.5.3 PERVASIVE PLAYERS
             13.5.4 PARTICIPANTS
                       FIGURE 56 KOMBUCHA MARKET: COMPANY EVALUATION MATRIX (KEY PLAYERS), 2023
             13.5.5 COMPANY FOOTPRINT
                       FIGURE 57 KOMBUCHA MARKET: COMPANY FOOTPRINT
                       TABLE 209 MARKET: COMPANY PRODUCT TYPE FOOTPRINT
                       TABLE 210 MARKET: COMPANY PACKAGING TYPE FOOTPRINT
                       TABLE 211 MARKET: COMPANY NATURE FOOTPRINT
                       TABLE 212 MARKET: COMPANY TYPE FOOTPRINT
                       TABLE 213 MARKET: COMPANY REGIONAL FOOTPRINT
     13.6 COMPETITIVE SCENARIO 
             13.6.1 PRODUCT LAUNCHES
                       TABLE 214 KOMBUCHA MARKET: PRODUCT LAUNCHES, JANUARY 2020–MARCH 2024
             13.6.2 DEALS
                       TABLE 215 KOMBUCHA MARKET: DEALS, JANUARY 2020–MARCH 2024
             13.6.3 EXPANSIONS
                       TABLE 216 KOMBUCHA MARKET: EXPANSIONS, JANUARY 2020–MARCH 2024
 
14 COMPANY PROFILES (Page No. - 200)
(Business overview, Products/Solutions/Services offered, Recent developments & MnM View)*
     14.1 KEY PLAYERS 
             14.1.1 GT'S LIVING FOODS
                       TABLE 217 GT’S LIVING FOODS: COMPANY OVERVIEW
                       TABLE 218 GT’S LIVING FOODS: PRODUCTS/SOLUTIONS/SERVICES OFFERED
                       TABLE 219 GT’S LIVING FOODS: PRODUCT LAUNCHES
             14.1.2 BREW DR.
                       TABLE 220 BREW DR.: COMPANY OVERVIEW
                       TABLE 221 BREW DR.: PRODUCTS/SOLUTIONS/SERVICES OFFERED
                       TABLE 222 BREW DR.: PRODUCT LAUNCHES
             14.1.3 SYSTM FOODS INC.
                       TABLE 223 SYSTM FOODS INC.: COMPANY OVERVIEW
                       TABLE 224 SYSTM FOODS INC.: PRODUCTS/SOLUTIONS/SERVICES OFFERED
                       TABLE 225 SYSTM FOODS INC.: DEALS
                       TABLE 226 SYSTM FOODS INC.: PRODUCT LAUNCHES
             14.1.4 HEALTH-ADE LLC
                       TABLE 227 HEALTH-ADE LLC: COMPANY OVERVIEW
                       TABLE 228 HEALTH-ADE LLC: PRODUCTS/SOLUTIONS/SERVICES OFFERED
             14.1.5 TROPICANA BRANDS GROUP
                       TABLE 229 TROPICANA BRANDS GROUP: COMPANY OVERVIEW
                       TABLE 230 TROPICANA BRANDS GROUP: PRODUCTS/SOLUTIONS/SERVICES OFFERED
                       TABLE 231 TROPICANA BRANDS GROUP: PRODUCT LAUNCHES
             14.1.6 MOMO KOMBUCHA
                       TABLE 232 MOMO KOMBUCHA: COMPANY OVERVIEW
                       TABLE 233 MOMO KOMBUCHA: PRODUCTS/SOLUTIONS/SERVICES OFFERED
                       TABLE 234 MOMO KOMBUCHA: PRODUCT LAUNCHES
             14.1.7 GO KOMBUCHA
                       TABLE 235 GO KOMBUCHA: COMPANY OVERVIEW
                       TABLE 236 GO KOMBUCHA: PRODUCTS/SOLUTIONS/SERVICES OFFERED
             14.1.8 HARRIS FREEMAN
                       TABLE 237 HARRIS FREEMAN: COMPANY OVERVIEW
                       TABLE 238 HARRIS FREEMAN: PRODUCTS/SOLUTIONS/SERVICES OFFERED
                       TABLE 239 HARRIS FREEMAN: EXPANSIONS
             14.1.9 KOSMIC KOMBUCHA
                       TABLE 240 KOSMIC KOMBUCHA: COMPANY OVERVIEW
                       TABLE 241 KOSMIC KOMBUCHA: PRODUCTS/SOLUTIONS/SERVICES OFFERED
               14.1.10 EQUINOX KOMBUCHA
                                   TABLE 242 EQUINOX KOMBUCHA: COMPANY OVERVIEW
                                   TABLE 243 EQUINOX KOMBUCHA: PRODUCTS/SOLUTIONS/SERVICES OFFERED
                                   TABLE 244 EQUINOX KOMBUCHA: EXPANSIONS
               14.1.11 REMEDY DRINKS
                                   TABLE 245 REMEDY DRINKS: COMPANY OVERVIEW
                                   TABLE 246 REMEDY DRINKS: PRODUCTS/SOLUTIONS/SERVICES OFFERED
                                   TABLE 247 REMEDY DRINKS: PRODUCT LAUNCHES
                                   TABLE 248 REMEDY DRINKS: EXPANSIONS
               14.1.12 SOULFRESH GLOBAL PTY LTD
                                   TABLE 249 SOULFRESH GLOBAL PTY LTD: COMPANY OVERVIEW
                                   TABLE 250 SOULFRESH GLOBAL PTY LTD: PRODUCTS/SOLUTIONS/SERVICES OFFERED
                                   TABLE 251 SOULFRESH GLOBAL PTY LTD: PRODUCT LAUNCHES
               14.1.13 CRUZ GROUP SP. Z O. O.
                                   TABLE 252 CRUZ GROUP SP. Z O. O.: COMPANY OVERVIEW
                                   TABLE 253 CRUZ GROUP SP. Z O. O.: PRODUCTS/SOLUTIONS/SERVICES OFFERED
               14.1.14 NESSALLA KOMBUCHA
                                   TABLE 254 NESSALLA KOMBUCHA: COMPANY OVERVIEW
                                   TABLE 255 NESSALLA KOMBUCHA: PRODUCTS/SOLUTIONS/SERVICES OFFERED
               14.1.15 FEDUP FOODS
                                   TABLE 256 FEDUP FOODS: COMPANY OVERVIEW
                                   TABLE 257 FEDUP FOODS: PRODUCTS/SOLUTIONS/SERVICES OFFERED
     14.2 OTHER PLAYERS 
             14.2.1 AQUA VITEA
                       TABLE 258 AQUA VITEA: COMPANY OVERVIEW
                       TABLE 259 AQUA VITEA: PRODUCTS/SOLUTIONS/SERVICES OFFERED
                       TABLE 260 AQUA VITEA: DEALS
             14.2.2 DRINK LIVE
                       TABLE 261 DRINK LIVE: COMPANY OVERVIEW
                       TABLE 262 DRINK LIVE: PRODUCTS/SOLUTIONS/SERVICES OFFERED
             14.2.3 KØBENHAVN KOMBUCHA
                       TABLE 263 KØBENHAVN KOMBUCHA: COMPANY OVERVIEW
                       TABLE 264 KØBENHAVN KOMBUCHA: PRODUCTS/SOLUTIONS/SERVICES OFFERED
                       TABLE 265 KØBENHAVN KOMBUCHA: DEALS
             14.2.4 LÆSK
                       TABLE 266 LÆSK: COMPANY OVERVIEW
                       TABLE 267 LÆSK: PRODUCTS/SOLUTIONS/SERVICES OFFERED
             14.2.5 FIX8
                       TABLE 268 FIX8: COMPANY OVERVIEW
                       TABLE 269 FIX8: PRODUCTS/SOLUTIONS/SERVICES OFFERED
                       TABLE 270 FIX8: DEALS
                       TABLE 271 FIX8: EXPANSIONS
             14.2.6 BB KOMBUCHA
             14.2.7 BROTHERS AND SISTERS
             14.2.8 ATMOSPHERE KOMBUCHA
             14.2.9 KULTUR’D
             14.2.10 BORÉCHA
*Details on Business overview, Products/Solutions/Services offered, Recent developments & MnM View might not be captured in case of unlisted companies.
 
15 ADJACENT AND RELATED MARKETS (Page No. - 240)
     15.1 INTRODUCTION 
               TABLE 272 ADJACENT MARKETS
     15.2 RESEARCH LIMITATIONS 
     15.3 SPECIALTY YEAST MARKET 
             15.3.1 MARKET DEFINITION
             15.3.2 MARKET OVERVIEW
                       TABLE 273 SPECIALTY YEAST MARKET, BY TYPE, 2017–2021 (USD MILLION)
                       TABLE 274 SPECIALTY YEAST MARKET, BY TYPE, 2022–2027 (USD MILLION)
     15.4 STARTER CULTURES MARKET 
             15.4.1 MARKET DEFINITION
             15.4.2 MARKET OVERVIEW
                       TABLE 275 STARTER CULTURES MARKET, BY APPLICATION, 2017–2021 (USD MILLION)
                       TABLE 276 STARTER CULTURES MARKET, BY APPLICATION, 2022–2027 (USD MILLION)
 
16 APPENDIX (Page No. - 244)
     16.1 DISCUSSION GUIDE 
     16.2 KNOWLEDGESTORE: MARKETSANDMARKETS’ SUBSCRIPTION PORTAL 
     16.3 CUSTOMIZATION OPTIONS 
     16.4 RELATED REPORTS 
     16.5 AUTHOR DETAILS 

The study involved four major activities in estimating the current size of the kombucha market. Exhaustive secondary research was done to collect information on the market, peer market, and parent market. The next step was to validate these findings, assumptions, and sizing with industry experts across the value chain through primary research. Both top-down and bottom-up approaches were employed to estimate the complete market size. After that, market breakdown and data triangulation were used to estimate the market size of segments and subsegments.

Secondary Research

This research study involved the extensive use of secondary sources—directories and databases such as Bloomberg Businessweek and Factiva—to identify and collect information useful for a technical, market-oriented, and commercial study of the kombucha market.

In the secondary research process, various sources such as annual reports, press releases & investor presentations of companies, white papers, certified publications, articles from recognized authors, gold & silver standard websites, directories, and databases were referred to identify and collect information. This research study involved the extensive use of secondary sources—directories and databases such as Bloomberg Businessweek and Factiva—to identify and collect information useful for a technical, market-oriented, and commercial study of the kombucha market.

Secondary research was mainly used to obtain key information about the industry’s supply chain, the total pool of key players, and market classification and segmentation as per the industry trends to the bottom-most level, regional markets, and key developments from both market- and technology-oriented perspectives.

Primary Research

Extensive primary research was conducted after obtaining information regarding the kombucha market scenario through secondary research. Several primary interviews were conducted with market experts from both the demand and supply sides across major countries of North America, Europe, Asia Pacific, the Middle East & Africa, and South America. Primary data was collected through questionnaires, emails, and telephonic interviews. The primary sources from the supply side included various industry experts, such as Chief X Officers (CXOs), Vice Presidents (VPs), Directors from business development, marketing, research, and development teams, and related key executives from distributors and key opinion leaders. Primary interviews were conducted to gather insights such as market statistics, data on revenue collected from the products and services, market breakdowns, market size estimations, market forecasting, and data triangulation. Primary research also helped in understanding the various trends related to product type, type, by nature, packaging, by distribution channels and region.
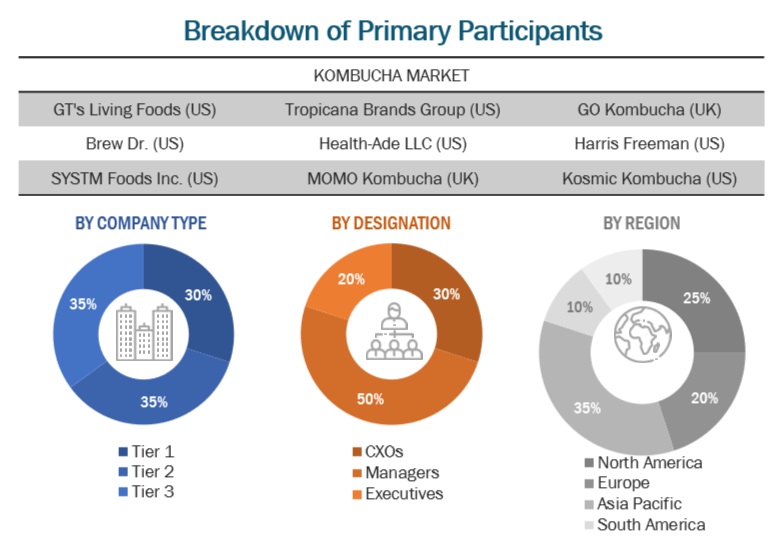
Kombucha Market Size, and Share

To know about the assumptions considered for the study, download the pdf brochure

Kombucha Market Size Estimation

Both the top-down and bottom-up approaches were used to estimate and validate the total size of the kombucha market. These approaches were also used extensively to estimate the size of various dependent submarkets. The research methodology used to estimate the market size includes the following:

  • Key players were identified through extensive secondary research.
  • The industry’s value chain and market size were determined through primary and secondary research.
  • All percentage share splits and breakdowns were determined using secondary sources and verified through primary sources.
  • All the possible parameters that affect the markets covered in this research study were accounted for, viewed in extensive detail, verified through primary research, and analyzed to obtain the final quantitative and qualitative data.
  • The following figure provides an illustrative representation of the complete market size estimation process implemented in this research study for an overall estimation of the kombucha market in a consolidated format.

The following sections (bottom-up & top-down) depict the overall market size estimation process employed for the purpose of this study.

Global Kombucha  Market: Bottom-Up Approach

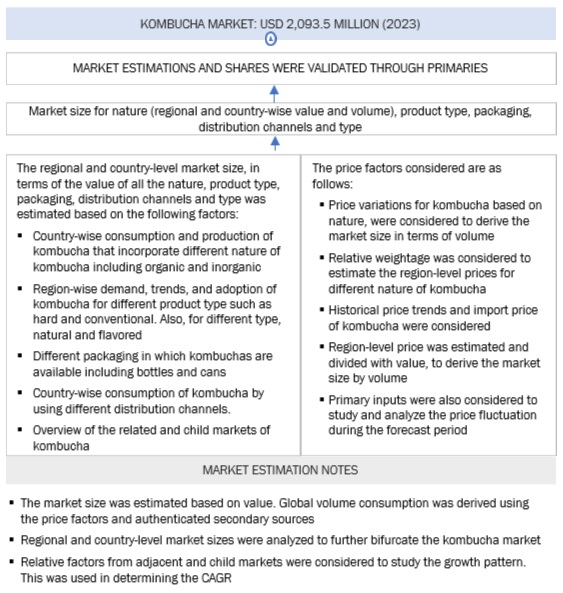
Kombucha Market Bottom Up Approach

To know about the assumptions considered for the study, Request for Free Sample Report

Global Kombucha Market: Top-Down Approach

Kombucha Market Top Down Approach

Data Triangulation

After arriving at the overall market size from the estimation process explained above, the total market was split into several segments and subsegments. Data triangulation and market breakdown procedures were employed, wherever applicable, to estimate the overall kombucha market and arrive at the exact statistics for all segments and subsegments. The data was triangulated by studying various factors and trends from the demand and supply sides. Along with this, the market size was validated using both the top-down and bottom-up approaches.

Market Definition

Kombucha is an ancient tea-based beverage that is referred to as a healing tonic. It originated in China and has been known as the immortal health elixir for years. The main ingredients used in the manufacturing of kombucha are tea, sugar, water, and kombucha culture. Kombucha culture can include SCOBY, molds, enzymes, and other microbes; SCOBY is a Symbiotic Colony of Bacteria and Yeast. After the fermentation process, Kombucha becomes carbonated and contains vinegar, numerous beneficial acids, probiotics, amino acids, vitamins, and antioxidants. A variety of flavors can be added to add different tastes to the drink.

Key Stakeholders

  • Government and Research Organizations
  • Associations and Industrial Bodies
  • Kombucha Manufacturers
  • Kombucha Traders, Distributors, and Suppliers
  • Beverage Manufacturers and Suppliers
  • Live Science Laboratories and Institutes
  • Government, Legislative, and Regulatory Bodies
  • Consumers

Kombucha Market Report Objectives

Market Intelligence

  • Determining and projecting the size of the kombucha market with respect to product type, type,  nature, packaging, and region.
  • Identifying the attractive opportunities in the market by determining the largest and fastest-growing segments
  • Providing detailed information about the key factors influencing the market growth (drivers, restraints, opportunities, and industry-specific challenges)
  • Providing the regulatory framework and market entry process related to the kombucha market
  • Analyzing the micro markets with respect to individual growth trends, prospects, and their contribution to the total market

Competitive Intelligence

  • Identifying and profiling the key players in the kombucha market
  • Providing a comparative analysis of market leaders based on the following:
    • Product offerings
    • Business strategies
    • Strengths and weaknesses
    • Key financials
  • Understanding the competitive landscape and identifying the major growth strategies adopted by players across the country
  • Providing insights on key product innovations and investments in the kombucha market

Available Customizations:

With the given market data, MarketsandMarkets offers customizations according to company-specific scientific needs.

The following customization options are available for the report:

Product Analysis

  • Product Matrix, which gives a detailed comparison of the product portfolio of each company.

Geographic Analysis

With the given market data, MarketsandMarkets offers customizations according to company-specific scientific needs.

  • Further breakdown of the Rest of Europe into Netherlands, Poland, and other EU & non-EU countries
  • Further breakdown of the Rest of Asia Pacific into Indonesia, Vietnam, and Republic of Korea.
  • Further breakdown of the Rest of South America into Colombia, Paraguay, Peru, and other South American countries

Company Information

  • Detailed analyses and profiling of additional market players (up to five)
Custom Market Research Services

We will customize the research for you, in case the report listed above does not meet with your exact requirements. Our custom research will comprehensively cover the business information you require to help you arrive at strategic and profitable business decisions.

Request Customization
Report Code
FB 3672
Published ON
Apr, 2024
Choose License Type
BUY NOW
  • SHARE
X
Request Customization
Speak to Analyst
Speak to Analyst
OR FACE-TO-FACE MEETING
PERSONALIZE THIS RESEARCH
  • Triangulate with your Own Data
  • Get Data as per your Format and Definition
  • Gain a Deeper Dive on a Specific Application, Geography, Customer or Competitor
  • Any level of Personalization
REQUEST A FREE CUSTOMIZATION
LET US HELP YOU!
  • What are the Known and Unknown Adjacencies Impacting the Kombucha Market
  • What will your New Revenue Sources be?
  • Who will be your Top Customer; what will make them switch?
  • Defend your Market Share or Win Competitors
  • Get a Scorecard for Target Partners
CUSTOMIZED WORKSHOP REQUEST
  • Call Us
  • +1-888-600-6441 (Corporate office hours)
  • +1-888-600-6441 (US/Can toll free)
  • +44-800-368-9399 (UK office hours)
CONNECT WITH US
ABOUT TRUST ONLINE
©2024 MarketsandMarkets Research Private Ltd. All rights reserved
DMCA.com Protection Status Website Feedback