
North America Smart Stadiums Market (2024-2029)

The North America Smart Stadiums Market was valued at $5750.1 Million in 2024 and projected to reach to $11522 Million by 2029, representing a compound annual growth rate of 14.9%. North America's smart stadiums market is poised for significant expansion, growing from $5,750.1 million in 2024 to $11,522.0 million by 2029.


| Market Size in | USD 26.32 MN |
| Market Forecast in | |
| CAGR | |
| Forecast Period | |
| Units Considered | Value (USD MN) |
North America Smart Stadiums Market Trends and Insights
- This expansion reflects North America's leadership in adopting advanced venue technologies, including IoT connectivity, AI-driven analytics, and integrated fan engagement platforms.
- North America's mature sports infrastructure and high capital investment capacity position the region as a key driver of innovation in stadium digitalization. The North America smart stadiums market is propelled by increasing demand for enhanced spectator experiences, operational efficiency, and data-driven decision-making across professional and collegiate sports venues.
- North America's major sports franchises and venue operators are prioritizing real-time crowd management, personalized ticketing, and seamless connectivity to differentiate their offerings.
- Between 2024 and 2029, North America is expected to maintain its competitive edge through continuous technology upgrades and strategic partnerships with software and hardware providers..
Key Market Statistics
- CAGR (2024-2029) 14.9% CAGR
- Market Size, 2024 ~USD 5750.1 Million
- Forecast, 2029 ~USD 11522 Million
- Geography North America
North America Smart Stadiums Market Overview
Market Leadership Position :
North America commands the largest share of the global smart stadiums market, driven by early adoption of IoT, AI analytics, and integrated fan engagement technologies across major sports franchises and venues.
Strong CAGR Performance :
With a 14.9% CAGR from 2024 to 2029, North America's smart stadiums market is expanding faster than many mature markets, reflecting sustained investment in venue modernization and digital transformation.
US Market Dominance :
The United States represents $9,259.4 million of North America's $5,750.1 million 2024 valuation, showcasing the region's concentration of high-capital sports infrastructure and technology-forward venue operators.
Capital Investment Maturity :
North America's established sports infrastructure, combined with high disposable incomes and competitive franchise environments, creates sustained demand for advanced stadium technologies and premium fan experiences.
North America Smart Stadiums Market Dynamics
- This growth trajectory reflects the region's commitment to leveraging cutting-edge technologies—including IoT connectivity, AI-driven analytics, and real-time fan engagement platforms—to enhance operational efficiency and revenue generation across professional sports venues. The market's momentum is sustained by North America's mature sports ecosystem, substantial capital availability, and competitive pressure among franchises to differentiate fan experiences.
- Investment in smart infrastructure, from connected seating systems to predictive maintenance solutions, continues to accelerate as venue operators recognize the dual benefits of operational cost reduction and enhanced spectator engagement, positioning North America as the global benchmark for stadium technology adoption..
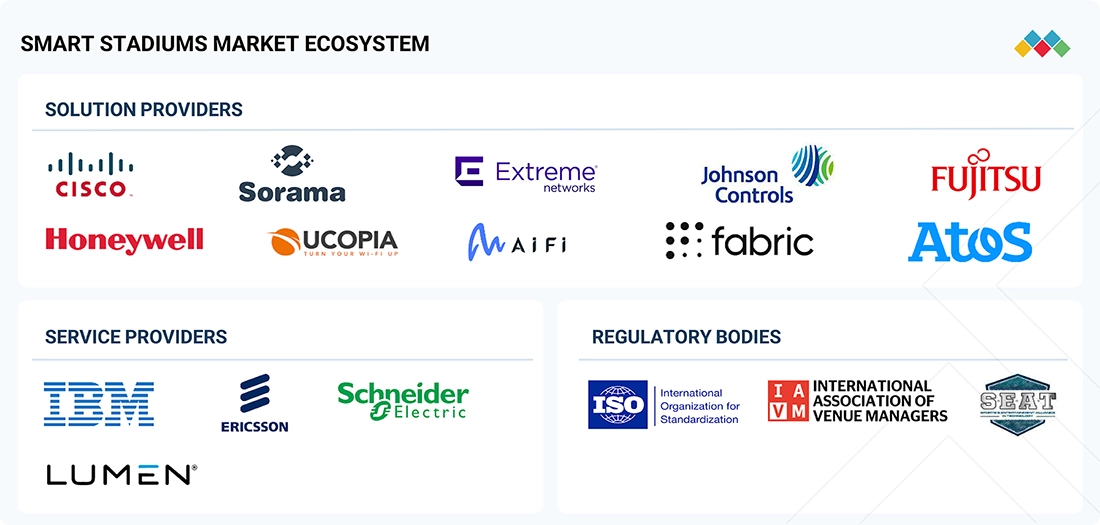
Market Ecosystem
Smart Stadiums Market: COMMERCIAL USE CASES ACROSS INDUSTRIES
| COMPANY | USE CASE DESCRIPTION | BENEFITS |
|---|---|---|
 |
The client is responsible for operating multiple stadiums in Qatar, with the goal of enhancing operational efficiency and the fan experience, particularly in preparation for the FIFA World Cup 2022. These stadiums are pivotal in showcasing Qatar's capabilities in hosting major international events. | Significant reduction in energy consumption, leading to lower operational costs | Enhanced fan experience through improved comfort and security measures | Increased operational efficiency, allowing for better management of resources during high-capacity events |
 |
River Plate Club is a prominent football club based in Buenos Aires, Argentina, known for its rich history and strong fan base. The club strives to deliver an exceptional experience for its fans and visitors, particularly during matches and events held at its stadium. | Significantly improved internet speeds and reliability, allowing fans to share their experiences in real time | Enhanced fan engagement using mobile applications and social media during events | Future-proofing the stadium's connectivity infrastructure, making it adaptable to emerging technologies and growing demands |
Logos and trademarks shown above are the property of their respective owners. Their use here is for informational and illustrative purposes only.
Related Ecosystem
Analytics
- Natural Language Processing (NLP)
- Machine Learning
- Supply Chain Management
- Predictive Analytics
- Image Sensors
- International Business Machines Corporation
- MICROSOFT CORPORATION
- Oracle Corporation
- SAP SE
Digitalization And Iot
- Sensors
- Remote Monitoring
- Supply Chain Management
- Passenger Information System (PIS)
- Platform as A Service (PaaS)
- International Business Machines Corporation
- Cisco Systems, Inc.
- MICROSOFT CORPORATION
- Oracle Corporation
- HUAWEI TECHNOLOGIES CO LTD
Mobility And Telecom
- Smart Utilities
- Smart Healthcare
- Sensors
- Parking Management System
- Passenger Information System (PIS)
- AT&T Inc.
- Cisco Systems, Inc.
- HUAWEI TECHNOLOGIES CO LTD
- Telefonaktiebolaget LM Ericsson (publ)
- International Business Machines Corporation
Key Takeaways
- North America's smart stadiums market will double from $5.75B in 2024 to $11.52B by 2029, growing at a 14.9% CAGR.
- North America leads global adoption of IoT, AI, and cloud-based stadium management solutions driven by major sports leagues and franchises.
- North America's venues are investing heavily in fan engagement technologies, including mobile apps, personalized experiences, and real-time analytics.
- North America's competitive landscape features both established technology providers and emerging startups targeting stadium digitalization and operational optimization.
Smart Stadiums Market Report Scope
| Report Metric | Details |
|---|---|
| Base Year | 2024 |
| Fastest Growing Segment | SMART TRANSPORTATION (Application) |
| Forecast Period | 2024-2029 |
| Growth Rate | CAGR of 16.3% from 2024 to 2029 |
| Largest Segment | SMART CITIZEN SERVICES (Application) |
| Market Size Base Year (Billions) | ~USD 19.59 (2024) |
| Revenue Forecast (Billions) | ~USD 41.68 (2029) |
| Segments Covered | Offering, Type, Stadium Type, Solution, Digital Content Management, Stadium And Public Security, Building Automation, Event Management, Service, Professional Service, Technology, Sport, End User, Application |
North America Smart Stadiums Market Report Segmentation
14 segment dimensions are covered across the global market.
By Offering
- Services
- Solutions
By Type
- Access Control
- Audio And Video Management
- Building Automation
- Consulting
- Crowd Management
- Cybersecurity
- Deployment & Integration
- Digital Content Management
- Digital Signage
- Emergency And Disaster Management
- Energy Management Systems
- Event Management
- Event Marketing And Registration
- Facility Management Systems
- Managed Services
- Mobile And Web Content Management
- Network Management
- Parking Management Systems
- Professional Services
- Psim
- Security Scanning, Imaging, And Metal Detection
- Stadium And Public Security
- Support & Maintenance
- Ticketing Management
- Video Surveillance
- Workforce Management
By Stadium Type
- Indoor
- Multi-Purpose
- Outdoor
By Solution
- Building Automation
- Crowd Management
- Data Management
- Digital Content Management
- Event Management
- Network Management
- Real-Time Location System
- Remote Monitoring
- Reporting And Analytics
- Security
- Stadium And Public Security
By Digital Content Management
- Audio And Video Management
- Digital Signage
- Mobile And Web Content Management
By Stadium And Public Security
- Access Control
- Cybersecurity
- Emergency And Disaster Management
- Psim
- Security Scanning, Imaging, And Metal Detection
- Video Surveillance
By Building Automation
- Energy Management Systems
- Facility Management Systems
- Parking Management Systems
By Event Management
- Event Marketing And Registration
- Ticketing Management
- Workforce Management
By Service
- Managed Services
- Professional Services
By Professional Service
- Consulting
- Deployment & Integration
- Support & Maintenance
By Technology
- Devices
- Esports
- Smart Stadiums
- Sports Analytics
By Sport
- American Football/Rugby
- Baseball
- Basketball
- Cricket
- Esports
- Golf
- ICE Hockey
- Soccer
- Tennis
By End User
- Athletes
- Clubs
- Coaches
- Leagues
- Sports Associations
By Application
- Smart Building
- Smart Citizen Services
- Smart Transportation
- Smart Utilities
Target Audience
- Stadium Technology Vendors : Vendors of IoT, AI, and fan engagement solutions need North America market data to identify high-value franchise accounts, understand regional technology preferences, and prioritize product roadmaps for the world's most advanced sports venue market.
- Sports Franchise Operators : Team owners and venue managers require competitive benchmarking data on smart stadium investments across North America to justify capital expenditures, evaluate technology ROI, and enhance fan experience competitively.
- Private Equity & Investment Firms : Investors evaluating sports technology and venue modernization opportunities need North America market sizing and growth forecasts to assess portfolio company valuations, identify acquisition targets, and project returns.
- Systems Integrators & Consultants : Integration firms and management consultants advising on stadium digital transformation require North America-specific market intelligence to develop implementation roadmaps, justify consulting engagements, and demonstrate industry expertise.
- Government & Economic Development Agencies : Regional economic development organizations need market data to attract technology companies, support sports infrastructure investment initiatives, and position North America venues as innovation hubs.
Countries within North America - compare and drill down
| Country | 2025 size (native) |
|---|---|
| US | USD 9259.4 Million |
| Canada | USD 2262.6 Million |
| Mexico | USD 545.9 Million |
Country market size visualization
Reasons to Buy this Report
- Regional Market Sizing & Forecasts : Access precise market valuations for North America ($5.75B in 2024) and country-level breakdowns for the US and Canada, enabling accurate budget allocation and investment planning.
- Competitive Landscape Intelligence : Understand North America's technology adoption leaders, franchise investment patterns, and venue modernization priorities to benchmark against competitors and identify market entry opportunities.
- Growth Driver Analysis : Identify the specific factors fueling North America's 14.9% CAGR—including capital availability, fan experience demands, and operational efficiency requirements—to align product development and go-to-market strategies.
- Country-Level Opportunity Assessment : Evaluate distinct market dynamics between the US ($9.26B) and Canada ($2.26B) to prioritize geographic expansion, localize offerings, and optimize resource deployment across North America.
- Strategic Investment Guidance : Leverage North America-specific insights to make informed decisions on technology partnerships, venue operator relationships, and capital allocation in the fastest-growing developed sports technology market.
Frequently asked questions
What is the current size of North America's smart stadiums market?
North America's smart stadiums market was valued at $5,750.1 million in 2024 and is projected to grow to $11,522.0 million by 2029.
What is the expected growth rate for North America's smart stadiums market?
North America's smart stadiums market is expected to grow at a compound annual growth rate (CAGR) of 14.9% from 2024 to 2029.
What technologies are driving North America's smart stadiums adoption?
North America's smart stadiums are being driven by IoT connectivity, artificial intelligence, cloud computing, mobile applications, and real-time data analytics for fan engagement and operational efficiency.
Which sectors are investing most in smart stadium solutions in North America?
North America's professional sports leagues, collegiate athletic departments, and major venue operators are leading investments in smart stadium technologies to enhance fan experiences and streamline operations.
What are the key challenges for North America's smart stadiums market?
North America's smart stadiums face challenges including high initial capital costs, cybersecurity concerns, legacy infrastructure integration, and the need for standardized technology platforms across venues.
RESEARCH METHODOLOGY
This research study involved the extensive use of secondary sources, directories, and databases, such as Dun & Bradstreet (D&B) Hoovers and Bloomberg BusinessWeek, to identify and collect valuable information for a technical, market-oriented, and commercial study of the Smart Stadiums market. The primary sources have been mainly industry experts from the core and related industries and preferred suppliers, manufacturers, distributors, service providers, technology developers, alliances, and organizations related to all segments of the value chain of this market. In-depth interviews have been conducted with various primary respondents, including key industry participants, subject matter experts, C-level executives of key market players, and industry consultants, to obtain and verify critical qualitative and quantitative information.
Secondary Research
In the secondary research process, various secondary sources were referred to identify and collect information for the study. The secondary sources included annual reports, press releases, investor presentations of companies, white papers, certified publications, and articles from recognized associations and government publishing sources. Several journals and associations, such as Stadium Innovation Conference 2024, SMART Conference 2024, Stadium Innovation Conference, World Stadium Congress, World of Stadiums, were also referred to. Secondary research was used to obtain key information about industry insights, the market’s monetary chain, the overall pool of key players, market classification and segmentation according to industry trends to the bottom-most level, regional markets, and key developments from both the market and technology-oriented perspectives.
Primary Research
In the primary research process, various primary sources from both the supply and demand sides were interviewed to obtain qualitative and quantitative information for the report. The primary sources from the supply side included industry experts, such as Chief Executive Officers (CEOs), Chief Technology Officers (CTOs), Chief Operating Officers (COOs), Vice Presidents (VPs), marketing directors, technology and innovation directors, and related key executives from various key companies and organizations operating in the Smart Stadiums market. The primary sources from the demand side included Smart Stadiums end users, consultants/specialists, Chief Information Officers (CIOs), and subject-matter experts from enterprises and government associations.
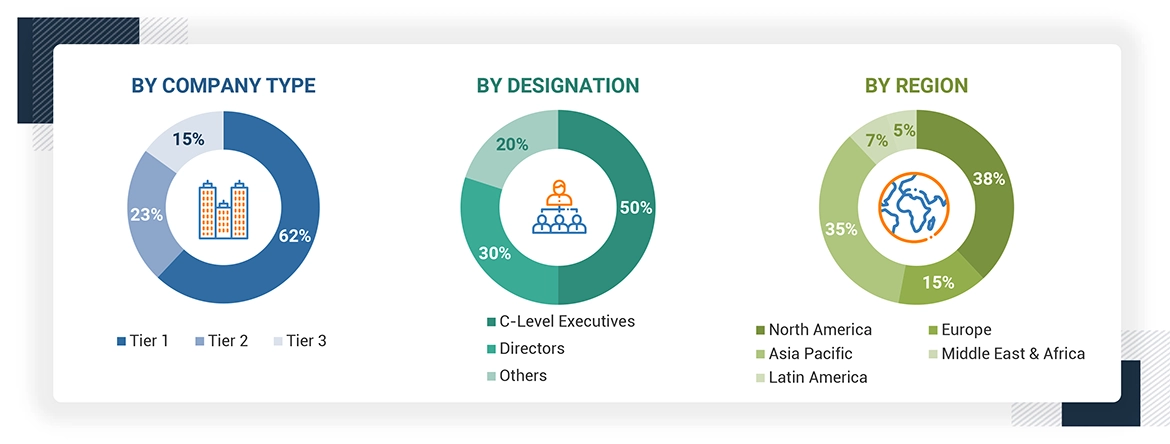
*Others include sales managers, marketing managers, and product managers.
Note: Tier 1 companies’ revenue is more than USD 1 billion; Tier 2 companies ‘revenue ranges between
USD 500 million to 1 billion; and Tier 3 companies’ revenue ranges in between USD
100 million and USD 500 million
To know about the assumptions considered for the study, download the pdf brochure
Market Size Estimation
Multiple approaches were adopted to estimate and forecast the size of the Smart Stadiums market. The first approach involves estimating market size by summing up the revenue generated by companies through the sale of Smart Stadiums.
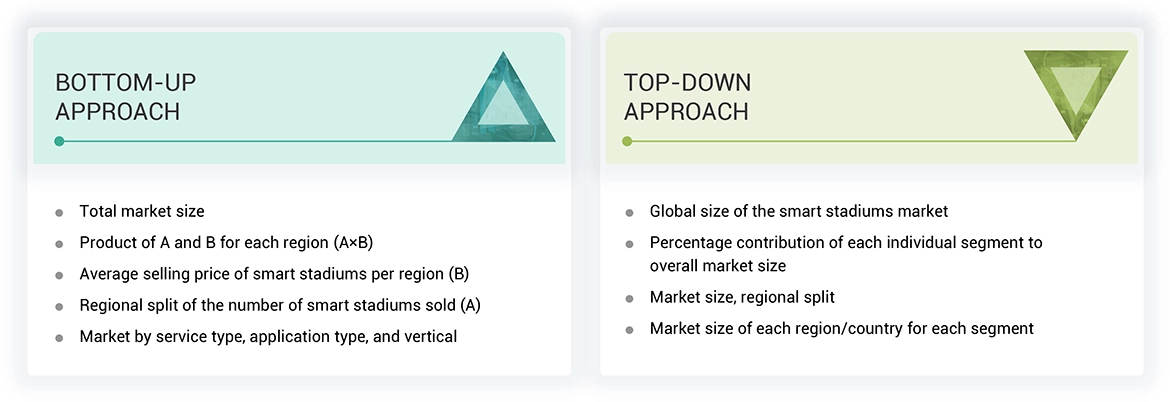
Both top-down and bottom-up approaches were used to estimate and validate the total size of the Smart Stadiums market. These methods were extensively used to estimate the size of various segments in the market. The research methodology used to estimate the market size includes the following:
- Key players in the market have been identified through extensive secondary research.
- In terms of value, the industry’s supply chain and market size have been determined through primary and secondary research processes.
- All percentage shares, splits, and breakups have been determined using secondary sources and verified through primary sources.
Smart Stadiums Market : Top-Down and Bottom-Up Approach
Data Triangulation
A Smart Stadium, is an application of smart technology integrated solutions and hardware in the stadium's infrastructure. Advanced digital technologies such as IoT, high-density Wi-Fi, integrated security systems, as well as mobile applications, are used to serve a better experience of sports and entertainment viewing, increased profitability, and improved security within the stadium.
According to Intel, a Smart Stadium may be defined as an arena where IoT, 5G connectivity, cloud computing, and AI-driven analytics deliver an immersed fan experience, improved stadium operations, enhanced safety, and revenue generation through data-driven decision-making.
Market Definition
Digital identity solutions refer to the tools and systems that enable individuals, organizations, and anything else related to computers, smartphones, and IoT devices, systems, services, and applications to establish and verify identities in a digital environment.
Stakeholders
- Stadium Owners and Operators
- Sports Teams and Leagues
- Event Organizers
- Fans and Spectators
- Technology Providers
- Network Operators
- Security Service Providers
- Government Agencies
- Facility Management Companies
- Infrastructure Providers
- Payment Solution Providers
- Broadcast and Media Companies
- Fan Engagement and Marketing Solution Providers
- Data Analytics Providers
- Sponsorship and Advertising Partners
- Health and Safety Providers
- Sustainability and Energy Management Providers
- Food and Beverage Service Providers
- Parking and Transportation Providers
- Digital Content Providers
Report Objectives
- To determine, segment, and forecast the Smart Stadiums market based on offering (solutions and services), stadium type, and region in terms of value
- To forecast the size of the market segments with respect to five main regions: North America, Europe, Asia Pacific, Middle East & Africa, and Latin America
- To provide detailed information about the major factors (drivers, restraints, opportunities, and challenges) influencing the growth of the market
- To study the complete value chain and related industry segments and perform a value chain analysis of the market landscape
- To strategically analyze the macro and micromarkets1 with respect to individual growth trends, prospects, and contributions to the total market
- To analyze the industry trends, pricing data, patents, and innovations related to the market
- To analyze the opportunities for stakeholders by identifying the high-growth segments of the market
- To profile the key players in the market and comprehensively analyze their market share/ranking and core competencies2
- To track and analyze competitive developments, such as mergers & acquisitions, product launches & developments, partnerships, agreements, collaborations, business expansions, and R&D activities
Available Customizations
With the given market data, MarketsandMarkets offers customizations as per the company’s specific needs. The following customization options are available for the report:
Country-wise information
- Analysis for additional countries (up to five)
Company Information
- Detailed analysis and profiling of additional market players (up to 5)
Get the Full Smart Stadiums Market Report
Full forecast, segment splits, and company analysis for all Smart Stadiums Market.
- France Smart Stadiums Market
- Germany Smart Stadiums Market
- Italy Smart Stadiums Market
- Nordic Countries Smart Stadiums Market
- Rest Of Europe Smart Stadiums Market
- Spain Smart Stadiums Market
- India Smart Stadiums Market
- Japan Smart Stadiums Market
- Rest Of Asia Pacific Smart Stadiums Market
- South Korea Smart Stadiums Market
- Southeast Asia Smart Stadiums Market
- Mexico Smart Stadiums Market
- Rest Of Latin America Smart Stadiums Market
- Bahrain Smart Stadiums Market
- Ksa Smart Stadiums Market
- Kuwait Smart Stadiums Market
- Rest Of Middle East Smart Stadiums Market
- UAE Smart Stadiums Market
- Canada Smart Stadiums Market
- US Smart Stadiums Market
- UK Smart Stadiums Market
- China Smart Stadiums Market
- Brazil Smart Stadiums Market
Need a Tailored Report?
Customize this report to your needs
Get 10% FREE Customization
Customize This Report
