
Precision Farming Market Size, Share & Trends

Precision Farming Market Size, Share and Trends by Automation & Control Systems, Cloud-based Software, System Integration & Consulting Services, Guidance Technology, Variable Rate Technology, Yield Monitoring, Field Mapping, Variable Rate Application - Global Forecast to 2032


Precision Farming Market Size, Share & Trends
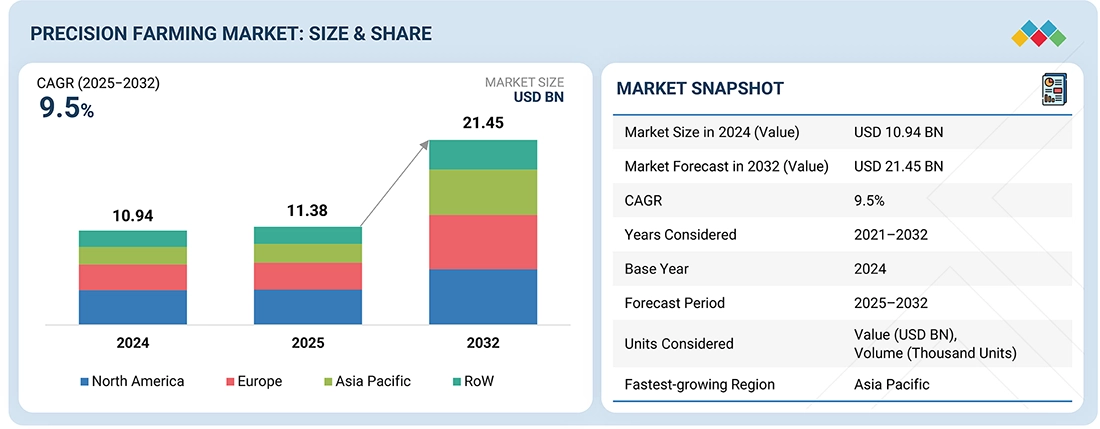
According to Marketsandmarkets, the global precision farming market size will grow from USD 11.38 billion in 2025 to USD 21.45 billion by 2032, with a CAGR of 9.5%. The global precision farming market growth is driven by technological advancements that support data-driven efficient farming, increased interest in sustainable agriculture, and government backing of agricultural initiatives. Additional growth stems from the adoption of data analytics, variable rate application (VRA) techniques, and progress in nanotechnology. The market is expanding rapidly due to global digital transformation efforts and the integration of IoT and AI with existing technologies, enabling smarter decision-making, resource optimization, and improved long-term agricultural productivity.
MARKET SNAPSHOT TABLE
| REPORT METRIC | DETAILS |
|---|---|
| Market Size in 2025 (Value) | USD 11.38 Billion |
| Market Forecast in 2032 (Value | USD 21.45 Billion |
| Growth Rate | CAGR of 9.5% from 2025-2032 |
| Years Considered | 2021-2032 |
| Base Year | 2024 |
| Forecast Period | 2025-2032 |
| Units Considered | Value (USD Million/Billion), Volume (Thousand Units) |
| Report Coverage | Revenue forecast, company ranking, competitive landscape, growth factors, and trends |
| Top Companies |
|
| Growth Driver |
|
| Segments Covered |
|
| Regions Covered | North America, Europe, Asia Pacific, and RoW |
Market Size & Forecast
PRECISION FARMING MARKET KEY TAKEAWAYS
-
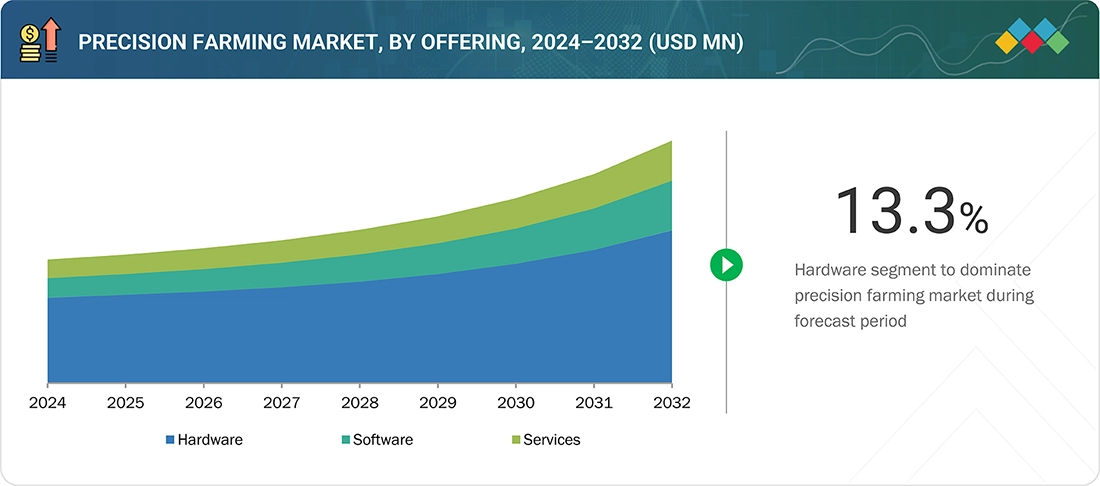
BY OFFERINGHardware holds the largest market share in the precision farming industry because it provides the foundation for data collection and automation, with widespread use of sensors, GPS devices, drones, and automated machinery enabling real-time monitoring, field mapping, and efficient farm operations.
-
BY TECHNOLOGYGuidance technology has the largest market share in precision farming, as GPS- and GNSS-based systems enable accurate field navigation, reduce overlaps and input waste, and improve operational efficiency during planting, spraying, and harvesting.
-
BY APPLICATIONYield monitoring dominates the precision farming market because it gives farmers real-time insights into crop performance, allowing data-driven decisions to optimize inputs, boost yield quality, and maximize overall farm productivity.
-
BY REGIONNorth America commands the largest share of the precision farming market, driven by widespread adoption of advanced smart agricultural technologies, robust government backing for sustainable farming practices, and substantial investments in precision equipment and IoT-based solutions.
-
COMPETITIVE LANDSCAPEMajor market players have adopted both organic growth and inorganic strategies, such as forming partnerships and making investments. For instance, Deere & Company, AGCO Corporation, CNH Industrial N.V., KUBOTA Corporation, and TOPCON CORPORATION have formed various agreements and partnerships to meet the rising demand for aerospace materials in innovative applications.
A significant future opportunity in the precision farming market share involves integrating advanced technologies like artificial intelligence (AI), machine learning (ML), and data analytics to support predictive and autonomous farm management. As data from IoT sensors, drones, and satellite imagery continues to grow, AI-driven insights can improve irrigation, fertilization, pest control, and yield predictions with unmatched accuracy. Moving toward data-driven and automated decision-making will boost productivity, decrease input costs, and encourage sustainable resource use. Additionally, the increasing adoption of autonomous tractors, robotics, and cloud-based farm management systems supported by 5G connectivity and government initiatives for digital agriculture will open new growth opportunities and transform the future of modern farming practices.
The North America precision farming market is projected to grow from USD 4.10 billion in 2025 to USD 6.46 billion by 2032, at a CAGR of 6.7%.The US precision farming accounts for the largest market share, supported by its extensive commercial farming operations, widespread use of GPS/GNSS guidance systems, AI-enabled analytics, variable-rate technology, and a strong OEM presence from companies such as John Deere, Trimble, AGCO, and CNH Industrial. Canada, meanwhile, is the fastest-growing market in the region, benefiting from rapid digitalization of agriculture, government-backed sustainability programs, and increasing adoption of remote sensing, soil monitoring, and autonomous machinery. The region’s focus on addressing labor shortages, improving resource efficiency, and meeting carbon neutrality targets further accelerates the adoption of precision farming across both countries, reinforcing North America’s position as the most mature and innovation-driven market globally.
Source: Secondary Research, Interviews with Experts, MarketsandMarkets Analysis
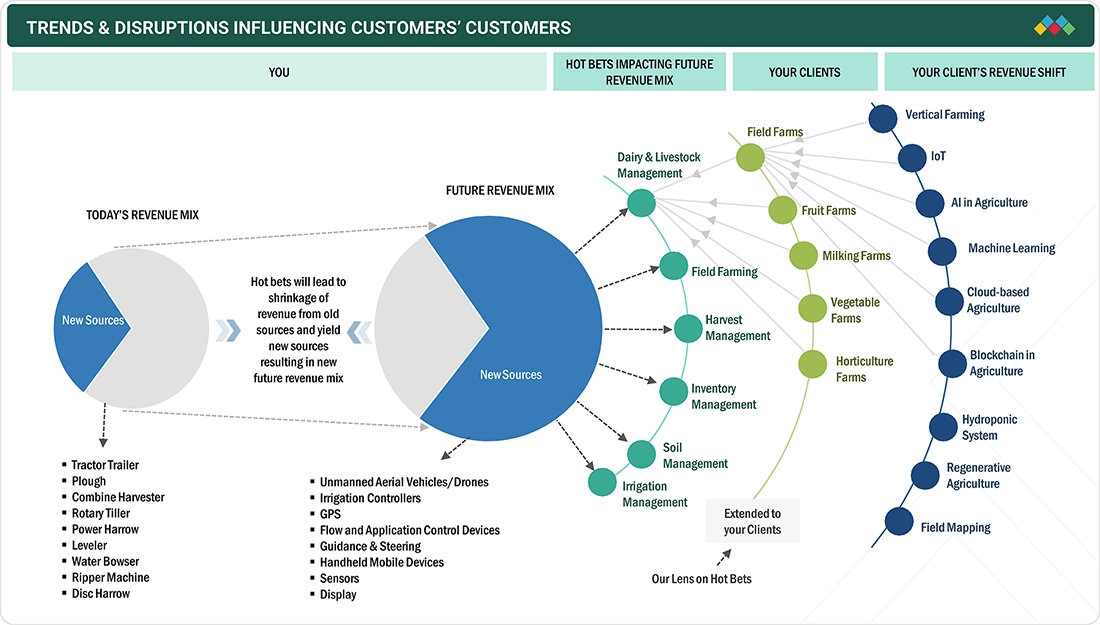
TRENDS & DISRUPTIONS IMPACTING CUSTOMERS' CUSTOMERS
Core technologies such as drones, irrigation controllers, GPS, flow and application control devices, guidance and steering systems, handheld mobile devices, sensors, and displays are essential parts of the precision farming ecosystem. These technologies are widely applied in areas including dairy and livestock management, field farming, harvest and inventory management, soil and irrigation management, pruning, and weather monitoring. Automation and control systems are increasingly advancing the automation of field operations such as crop scouting, planting, tilling, spraying, and weeding. Agricultural software plays a crucial role by providing modules for crop protection, environmental monitoring, waste and pollution management, landscape and soil care, and crop nutrition optimization. With progress in AI, IoT, blockchain, and cloud services, the adoption of software is speeding up, opening lucrative opportunities for providers to offer solutions that improve operational efficiency, energy use, and accessibility.
Source: Secondary Research, Interviews with Experts, MarketsandMarkets Analysis
PRECISION FARMING MARKET DYNAMICS
Level
-
Technological Advancements Fueling Data-Driven and Efficient Farming

-
Growing Emphasis on Sustainable Agricultural Practices

Level
-
High Initial Investment and Technology Costs

-
Lack of Technical Knowledge and Skilled Workforce.

Level
-
Growth Potential of Variable Rate Application (VRA) in Precision Farming

-
Adoption of Data Analytics in the Agriculture Sector

Level
-
Lack of Standardized Policies and Regulations

-
Data Privacy Issues and Security Concerns

Source: Secondary Research, Interviews with Experts, MarketsandMarkets Analysis
Driver: Growing emphasis on sustainable agricultural practices
The increasing focus on sustainable agriculture is promoting the use of precision farming. By utilizing soil sensors, satellite images, and data analysis, precision farming allows for the efficient use of water, fertilizers, and pesticides, reducing waste and environmental harm while boosting crop yields. Global efforts, such as government-supported natural farming clusters in India and international programs by FAO and IFAD, further encourage eco-friendly farming, making precision agriculture a crucial tool for reaching scalable and measurable sustainability targets.
Restraint: High initial investment and technology costs
High initial investments and technology costs limit the adoption of precision farming. Advanced tools like GPS-guided machinery, soil sensors, and data analytics platforms require substantial spending on purchase, installation, and maintenance, making them inaccessible for small and marginal farmers, especially in developing regions. Along with limited financing, subsidies, and technical knowledge, these high costs pose a major barrier to widespread adoption despite the long-term benefits of improved yields, resource efficiency, and sustainability.
Opportunity: Growth potential of variable rate application (VRA) in precision farming
Variable rate application (VRA) shows strong potential in precision farming by allowing farmers to optimize inputs like fertilizers, pesticides, and water based on specific field conditions. This precision increases yields, cuts costs and waste, and supports sustainability. Leading industry companies, including Deere & Company, Hexagon AB, and Valmont Industries, are advancing VRA technology through smart machinery, digital tools, and irrigation systems, emphasizing its role in creating efficient, sustainable, and future-ready farming practices.
Challenge: Lack of standardized policies and regulations
The absence of standardized policies and regulations presents a significant obstacle for precision agriculture. Inconsistent rules cause interoperability problems among equipment and systems from different manufacturers, resulting in inefficiencies, increased operational costs, and slower innovation. Without a uniform regulatory framework, technology integration becomes difficult, limiting the productivity and sustainability benefits of precision farming. Initiatives like the US GAO’s 2024 recommendations for technical standards and funding support aim to tackle these challenges and foster a more efficient, integrated agricultural ecosystem.
PRECISION FARMING MARKET SIZE, SHARE & GROWTH: COMMERCIAL USE CASES ACROSS INDUSTRIES
| COMPANY | USE CASE DESCRIPTION | BENEFITS |
|---|---|---|
 |
Integration of GPS-guided autonomous tractors and real-time data analytics through the John Deere Operations Center platform | Enhances planting accuracy, optimizes input use, reduces labor dependency, and increases overall yield efficiency |
 |
Deployment of precision farming and variable rate application technologies via Fendt and Massey Ferguson machinery | Reduces seed and fertilizer wastage, improves field uniformity, and boosts crop productivity |
 |
Use of AFS (Advanced Farming Systems) for automated steering, yield mapping, and field data integration across Case IH and New Holland brands | Improves resource utilization, minimizes overlaps, reduces fuel consumption, and enhances farm profitability |
 |
Implementation of smart tractors and remote farm monitoring systems integrated with IoT sensors and GNSS-based guidance | Increases operational precision, lowers input costs, and supports sustainable farming practices |
 |
Development of GNSS-based precision guidance systems, crop health monitoring, and machine control solutions | Provides centimeter-level accuracy, enhances operational efficiency, and ensures data-driven decision-making in farm management |
Logos and trademarks shown above are the property of their respective owners. Their use here is for informational and illustrative purposes only.
PRECISION FARMING MARKET ECOSYSTEM
The precision farming market ecosystem includes major players such as Deere & Company (US), AGCO Corporation (US), CNH Industrial N.V. (UK), Kubota Corporation (Japan), and Topcon Corporation (Japan). These companies operate globally through strategic partnerships, acquisitions, and technological expansion to enhance their product offerings. Their combined efforts through innovation and compliance help advance precision farming by providing better services, sustainable practices, and innovative agricultural solutions.
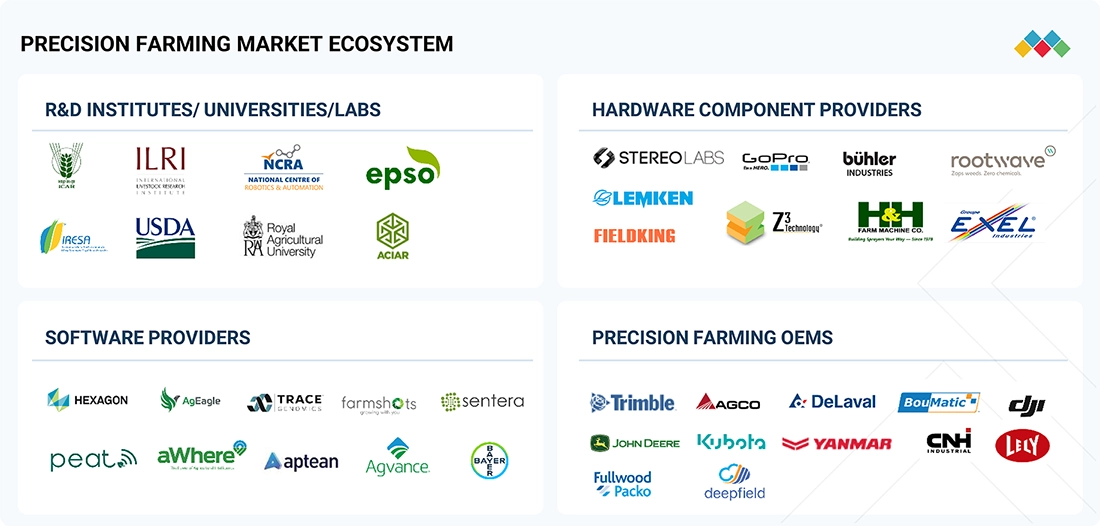
Logos and trademarks shown above are the property of their respective owners. Their use here is for informational and illustrative purposes only.
PRECISION FARMING MARKET SEGMENTS
Source: Secondary Research, Interviews with Experts, MarketsandMarkets Analysis
Precision Farming Market, By Offering
Software in precision farming is projected to grow at the highest CAGR during 2025 to 2032 due to increasing reliance on data-driven farming techniques. Farmers are increasingly using software to monitor crop health, optimize irrigation, manage inputs, and accurately predict yields. The integration of IoT devices, sensors, drones, and satellite imagery produces large amounts of data that need advanced software for real-time analysis and actionable insights. Additionally, cloud-based platforms and mobile apps enable remote farm management and scalability, making software adoption more flexible and cost-effective than hardware upgrades. Industry trends such as a focus on sustainability, government-supported digital farming initiatives, and collaborations between agri-tech firms and software providers further drive market growth, establishing software as a key component in modernizing precision agriculture.
Precision Farming Market, By Technology
Variable rate application (VRA) technology is projected to have the highest CAGR in the precision farming market because of its ability to optimize the application of inputs such as fertilizers, pesticides, seeds, and water based on real-time field variability. By adjusting input rates to the specific needs of different soil zones and crops, VRA improves yield, lowers input costs, and minimizes environmental impact. The growing use of IoT sensors, GPS-enabled equipment, and advanced analytics platforms supports VRA's scalability and accuracy. Additionally, increasing demand for sustainable and resource-efficient farming, along with partnerships between equipment manufacturers and digital solution providers (for example, Deere & Company, Valmont Industries), accelerates the deployment of VRA systems, establishing it as a key growth area in precision agriculture technology.
Precision Farming Market, By Application
Weather tracking and forecasting apps are set to see the fastest growth in the precision farming market trends. This is driven by the increasing impact of climate variability and extreme weather on crop yields and farm profits. Advanced monitoring tools, paired with AI-based prediction models, offer farmers real-time data on rainfall, temperature, humidity, and frost risk, helping them make proactive choices. These systems assist in optimizing irrigation, planting, harvesting schedules, and crop protection, which reduces losses and enhances resource use. Additionally, integration with IoT devices, drones, and cloud platforms enables smooth data collection and analysis, supporting scalable and accurate farm management. Rising awareness of climate-smart agriculture and government programs are further boosting the adoption of weather forecasting solutions in precision farming.
PRECISION FARMING MARKET REGION
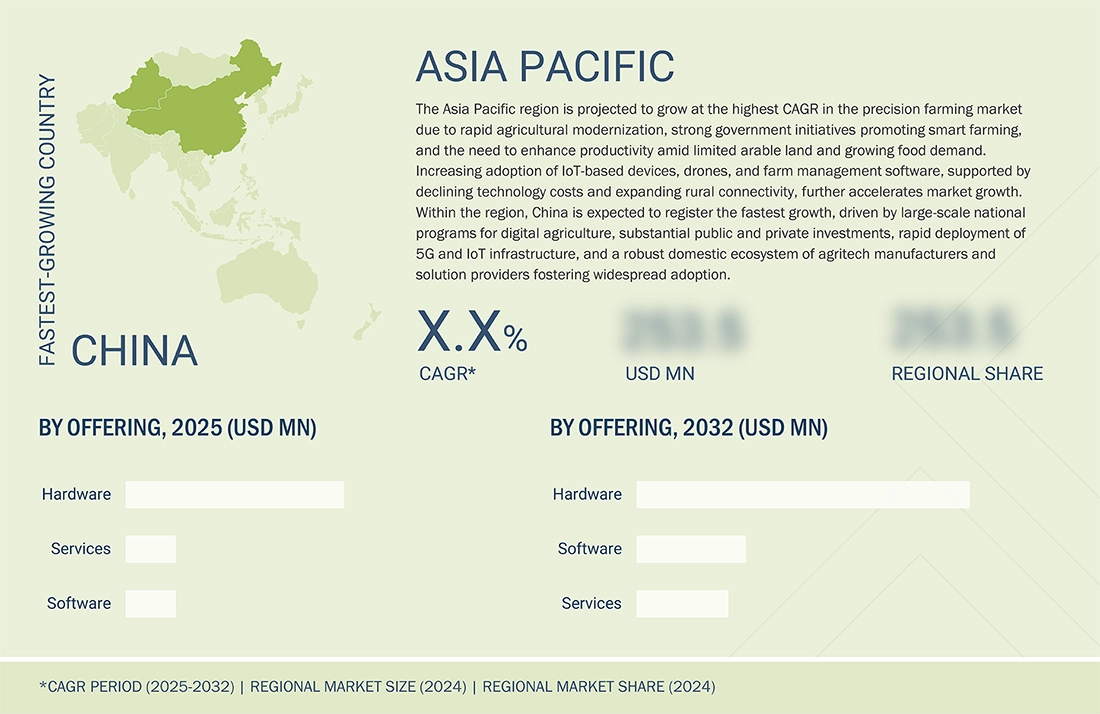
Asia Pacific to be fastest-growing region in global precision farming market during forecast period
Asia Pacific is expected to experience the highest CAGR in the precision farming industry due to increasing adoption of smart agricultural technologies, rising government support for sustainable farming, and rapid modernization of agriculture in countries like China, India, Japan, and Australia. The region faces growing food demand from its expanding population, which drives the need for higher productivity and efficient resource management. Investments in IoT-based solutions, AI-driven farm management software, and precision machinery are increasing, supported by favorable policies, subsidies, and initiatives promoting digital agriculture. Additionally, rising awareness of climate-resilient and environmentally sustainable practices encourages farmers to adopt precision farming technologies, making Asia Pacific the fastest-growing regional market.
The Europe precision farming market is projected to grow from USD 3.11 billion in 2025 to USD 6.30 billion by 2032, at a CAGR of 10.6%. Growth is driven by stringent EU sustainability targets, rising input costs, and the region’s shift toward climate-resilient agriculture. Adoption of GPS-guided machinery, variable-rate equipment, and advanced sensors is expanding rapidly across Western and Northern Europe. Supportive policies such as the CAP and the Green Deal are accelerating investments in digital technologies. Strong demand from arable farms, dairy operations, and horticulture is creating opportunities in automation, drone analytics, IoT soil networks, and AI-enabled farm management.
The North America precision farming market size is projected to grow from USD 4.10 billion in 2025 to USD 6.46 billion by 2032, at a CAGR of 6.7%. Growth is driven by labour shortages, climate variability, and the need to boost crop productivity. The rapid adoption of IoT sensors, GPS/GNSS guidance, AI-based analytics, drones, and variable-rate technology is accelerating the shift toward automated, data-driven farming. Government support through USDA programs, broadband expansion, and sustainability initiatives further strengthens adoption. Emerging opportunities in autonomous machinery, carbon-smart farming, and advanced soil and crop monitoring are continuing to shape the region’s transition toward connected digital agriculture.Explore the US Precision Farming Market size, share, and trends in North America, highlighting technology adoption, yield optimization, and sustainable farming growth.
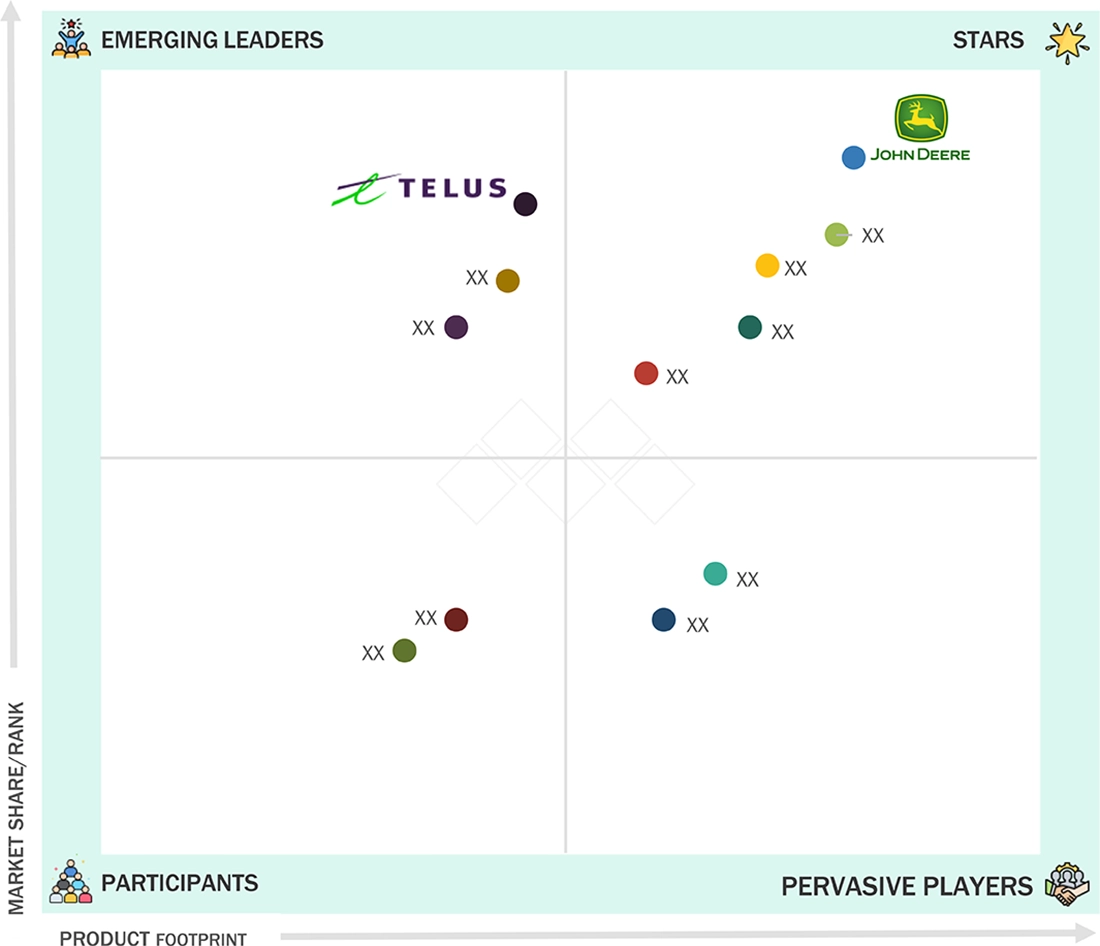
PRECISION FARMING MARKET SIZE, SHARE & GROWTH: COMPANY EVALUATION MATRIX
In the precision farming companies matrix, Deere & Company (Star) leads with a strong market share and a broad product range, thanks to its well-established brand, extensive solution offerings, and global customer base, making its advanced technologies widely adopted worldwide. TELUS (Emerging Leader) is gaining notable visibility through its innovative connected agriculture solutions and strategic investments, enabling it to quickly expand its market presence and seize emerging opportunities. While Deere & Company maintains dominance through scale and trusted technology, TELUS is well positioned to move closer to the leaders’ quadrant as demand for digital and data-driven farming solutions increases.
Source: Secondary Research, Interviews with Experts, MarketsandMarkets Analysis
PRECISION FARMING MARKET KEY PLAYERS
WHAT IS IN IT FOR YOU: Precision Farming Market REPORT CONTENT GUIDE
DELIVERED CUSTOMIZATIONS
We have successfully delivered the following deep-dive customizations:
| CLIENT REQUEST | CUSTOMIZATION DELIVERED | VALUE ADDS |
|---|---|---|
| Large Agribusiness |
|
|
| Equipment Manufacturer |
|
|
| Technology Vendor |
|
|
| Farm Cooperative |
|
|
| Food Processor |
|
|
RECENT DEVELOPMENTS
- May 2025 : The partnership between CNH Industrial N.V. and Starlink provided satellite internet access to farmers in remote areas, enhancing precision farming technologies through autonomous tractors and AI-driven weed detection by harnessing Starlink's network of over 7,000 satellites for real-time data and cloud operations.
- March 2025 : Deere & Company launched SmartDetect Digital, a safety system for mid-size and large wheel loaders, which employs stereo cameras and machine learning to identify people and objects, alert operators instantly, and connect with the John Deere Operations Center for near-miss alerts and weekly updates.
- February 2025 : Ag Leader Technology introduced RightPath as a passive implement steering system that uses the tractor's guidance line to steer farming equipment, improving input accuracy, reducing crop damage and operator fatigue, and supporting multiple GPS correction sources.
- February 2025 : Topcon Agriculture (Topcon Corporation) partnered with Bonsai Robotics to improve precision farming for permanent crops by combining Bonsai's vision-based autonomous navigation with Topcon's autosteering and telematics systems for automated operations, data-driven decisions, and accurate harvesting.
- August 2024 : Bayer AG introduced FieldView Drive 2.0, a faster, more secure device for real-time wireless data transfer and prescription delivery to farm equipment, thereby enhancing compatibility, efficiency, and supporting Bayer’s focus on sustainable digital farming.
Table of Contents
 Exclusive indicates content/data unique to MarketsandMarkets and not available with any competitors.
Methodology
The study involved major activities in estimating the current size of the precision farming market. Exhaustive secondary research has been done to collect information on the market, peer market, and parent market. To validate these findings, assumptions, and sizing with industry experts across the supply chain through primary research has been the next step. Both top-down and bottom-up approaches have been employed to estimate the complete market size. After that, market breakdown and data triangulation methods have been used to estimate the market size of segments and subsegments. Secondary and primary sources have been used to identify and collect information for an extensive technical and commercial study of the precision farming market.
Secondary Research
Secondary research for this study involved gathering information from various credible sources such as company reports, white papers, journals, and industry publications. This process helped in understanding the supply and value chains, identifying key players, analyzing market segmentation and regional trends, and tracking major market and technology developments. The data collected was used to estimate the overall market size, which was later validated through primary research.
Primary Research
Extensive primary research was conducted after gaining knowledge about the current scenario of the precision farming market through secondary research. Several primary interviews were conducted with experts from the demand and supply sides across four major regions—North America, Europe, Asia Pacific and RoW. This primary data was collected through questionnaires, emails, and telephonic interviews.

Notes: RoW mainly comprises the Middle East, Africa, and South America.
Other designations include product managers, sales managers, and marketing managers.
Three tiers of companies have been defined based on their total revenue as of 2024; tier 3: revenue lesser than USD 500 million; tier 2: revenue between USD 500 million and 1 billion; and tier 1: revenue more than USD 1 billion.
To know about the assumptions considered for the study, download the pdf brochure
Market Size Estimation
The bottom-up procedure has been employed to arrive at the overall size of the precision farming market.
- Analyzed major precision farming hardware, software, and service providers, studied their portfolios, and understood products/solutions/services based on their features and functions
- Analyzed the segmental revenue and scope revenue of the companies profiled in the study
- Arrived at the global precision farming market size by adding the scope revenue of key manufacturers in the market
- Conducted multiple discussions with key opinion leaders to understand different precision farming offering (hardware, software, and service), technology, applications, and current trends in the market, and analyzed the breakup of the scope of study by major precision farming hardware, software, and service providers
The top-down approach has been used to estimate and validate the total size of the precision farming market.
- The global size of the precision farming market was estimated through the data sanity of major companies offering precision farming products/solutions/services.
- The geographic penetration splits were estimated using secondary sources, based on several factors, such as the number of players in a specific region (North America, Europe, Asia Pacific, and RoW).
- The country-level penetration split was analyzed for each region to estimate the market size.
- The market size for the global offering (hardware, software, and service) was determined by understanding the penetration split of each offering in each region.
- The market size for the global application segments was estimated by analyzing the penetration split of each offering for each application.
- The market size for the global technology segments was estimated by analyzing the penetration split of each offering for each technology.
Precision Farming Market : Top-Down and Bottom-Up Approach

Data Triangulation
After arriving at the overall market size using the market size estimation processes as explained above, the market has been split into several segments and subsegments. To complete the entire market engineering process and arrive at the exact statistics of each market segment and subsegment, data triangulation and market breakdown procedures have been employed, wherever applicable. The data has been triangulated by studying various factors and trends from the demand and supply sides in the precision farming market.
Market Definition
Precision farming, also referred to as precision agriculture, is a modern farm management approach that utilizes advanced technologies to monitor and enhance agricultural operations. It focuses on aligning field inputs with specific crop requirements. Technologies such as satellite positioning systems, including global positioning system (GPS), remote sensing, and variable rate technology (VRT), are used to manage crops efficiently and optimize the use of resources such as fertilizers, pesticides, and water.
Key Stakeholders
- Precision farming component providers
- Precision farming integrators and installers
- Precision farming solution providers
- Product manufacturers
- Precision farming-related associations, organizations, forums, and alliances
- Government and corporate bodies
- Research institutes and organizations
- Venture capitalists, private equity firms, and start-ups
- Distributors and traders
- OEMs
- End users
- Market research and consulting firms
- Agri-food buyers
- Agriculture technology providers
Report Objectives
- To define, describe, and forecast the size of the precision farming market, by offering, technology, application, and region, in terms of value
- To describe and forecast the size of the precision farming market, by offering, in terms of volume
- To forecast the market for various segments with respect to the main regions, namely, North America, Europe, Asia Pacific, and the Rest of the World (RoW), in terms of value
- To provide macroeconomic outlooks with respect to main regions, namely, North America, Europe, Asia Pacific, and the Rest of the World (RoW)
- To provide detailed information regarding the drivers, restraints, opportunities, and challenges influencing the market’s growth
- To strategically analyze micromarkets with respect to individual growth trends, prospects, and contributions to the total market
- To provide ecosystem analysis, value chain, trends/disruptions impacting customer business, technology analysis, pricing analysis, technology analysis, key stakeholders & buying criteria, case study analysis, trade analysis, patent analysis, Porter’s five forces, key conferences & events, AI impact, impact of 2025 US tariff, and regulations related to the precision farming market
- To analyze the opportunities in the market for stakeholders by identifying high-growth segments and detailing the competitive landscape for market players
- To strategically profile key players and comprehensively analyze their market rankings, core competencies, company valuation, and financial metrics, and product/brand comparison, along with detailing the competitive landscape for the market leaders
- To analyze the competitive developments, such as product launches, software launches, agreements, collaborations, joint ventures, and acquisitions, carried out by market players
- To map the competitive intelligence based on company profiles, key player strategies, and game-changing developments, such as product developments, collaborations, and acquisitions
- To benchmark players within the market using the competitive leadership mapping framework, which analyzes market players on various parameters within the broad categories of business strategy excellence and strength of product portfolio.
Available customizations:
With the given market data, MarketsandMarkets offers customizations according to the company‘s specific needs. The following customization options are available for the report.
Company Information
- Detailed analysis and profiling of additional market players (up to five)
Key Questions Addressed by the Report
What is the current size of the global Precision Farming Market?
The global Precision Farming Market was valued at USD 10.94 billion in 2024 and is projected to grow from USD 11.38 billion in 2025 to USD 21.45 billion by 2032.
What is the expected CAGR of the Precision Farming Market?
The market is expected to register a CAGR of 9.5% from 2025 to 2032, driven by the adoption of data-driven agriculture technologies and smart farming practices.
What are the major growth drivers of the Precision Farming Market?
Key growth drivers include increasing adoption of IoT, AI, machine learning, GPS/GNSS technologies, growing demand for sustainable agriculture, government support for digital farming, and the need to improve crop yields while optimizing resource usage.
Which offering segment holds the largest share of the Precision Farming Market?
The hardware segment holds the largest market share due to widespread deployment of sensors, drones, GPS devices, automated machinery, and monitoring systems that enable precision agriculture operations.
Which technology segment dominates the Precision Farming Market?
Guidance Technology dominates the market as GPS- and GNSS-based systems help farmers achieve precise field navigation, reduce overlaps, minimize input waste, and improve operational efficiency.
Which application segment accounts for the largest market share?
Yield Monitoring is the leading application segment because it provides real-time crop performance insights, enabling farmers to optimize inputs, improve productivity, and maximize profitability.
Which region leads the global Precision Farming Market?
North America holds the largest market share, accounting for more than 43% of global revenue in 2024, supported by advanced agricultural infrastructure, high technology adoption, and favorable government initiatives.
Which region is expected to grow the fastest in the Precision Farming Market?
Asia Pacific is projected to be the fastest-growing region during the forecast period due to increasing agricultural modernization, government initiatives, rising food demand, and rapid adoption of smart farming technologies in countries such as China and India.
Who are the leading companies in the Precision Farming Market?
Major companies include Deere & Company, AGCO Corporation, CNH Industrial N.V., Topcon Corporation, and Ag Leader Technology.
What does a Precision Farming Market report analyze?
A comprehensive market report analyzes market size, forecasts, growth drivers, technology trends, competitive landscape, regional opportunities, application segments, regulatory developments, adoption patterns, and strategic initiatives of leading market players.
Need a Tailored Report?
Customize this report to your needs
Get 10% FREE Customization
Customize This ReportPersonalize This Research
- Triangulate with your Own Data
- Get Data as per your Format and Definition
- Gain a Deeper Dive on a Specific Application, Geography, Customer or Competitor
- Any level of Personalization
Let Us Help You
- What are the Known and Unknown Adjacencies Impacting the Precision Farming Market
- What will your New Revenue Sources be?
- Who will be your Top Customer; what will make them switch?
- Defend your Market Share or Win Competitors
- Get a Scorecard for Target Partners

Custom Market Research Services
We Will Customise The Research For You, In Case The Report Listed Above Does Not Meet With Your Requirements
Get 10% Free CustomisationTESTIMONIALS

Tetsuya Ohhira
Business Development Manager-Technology Business
Nikon Corporation,
Leading Japanese MNC specializing in optics and imaging productswww.nikon.com
MarketsandMarkets™ response
is quick. Their attitude is flexible and positive. Analyst Insights are globally considered and
significant. Client Services quickly respond to our inquiry and demand. Their wide range of global
surveys help us make our strategic plan.
We hope Knowledge Store will be easier to search
for a report.
VP - Marketing & Business Development
Leading Provider of Process Control Solutions
We engaged with MarketsandMarkets on a study to perform an analysis and recommend a Go-To-Market strategy for metrology and process control in the semiconductor market. The study was tailored to our targets and needs with well-defined milestones. Our overall experience with the MarketsandMarkets team was very good throughout the project in all aspects including the analysis methodologies used, the quality and depth of primary and secondary data sets, the professionalism and flexibility of the team and the ability to meet the target schedule and milestones. We want to thank MarketsandMarkets team for a job well done.
Growth opportunities and latent adjacency in Precision Farming Market


Bernard
Apr, 2026
How are technologies like Internet of Things, Artificial Intelligence, and GPS transforming modern agriculture?.
Joshua
Apr, 2026
Which precision farming technologies (GPS, GIS, drones, sensors) are most widely used and why?.
Ben
Apr, 2026
What are the main applications of precision farming in crop monitoring, yield tracking, and field mapping?.
User
Sep, 2019
Penetration of IoT and AI technologies in agriculture is increasing at rapid pace. Every year we are witnessing a large number of startups enetering this space. Does your report covers startups data and strategies adopted by them ?.
User
Feb, 2025
I would like to know the number of setups sold for both crop and livestock related precision Ag..
User
Sep, 2019
Automated Guidance steering, GPS, and remore sensing are playing critical role in automation of farm machinery and increasing productivity of farms. Does your report cover agricultural machinery automation data and their adoption trend?.
User
Apr, 2021
What is the future of Precision Farming in terms of Technology? What are the companies working on?.
User
Sep, 2019
I would require some market analysis, data and figures about the current and forecasted oeriod for precision agriculture market.
harshdeep
Dec, 2020
I need the detail of how many farmers have adopted precision farming and the results of the precision farming market when it comes out..
User
Nov, 2019
Have you included eastern European countries in your analysis. My focus is on major players in Estern Europe and Africa. What data you can provide? .
User
Mar, 2019
I would like to know the number of devices sold for both crop and livestock related precision Ag hardware, not just the dollar value of the market size..